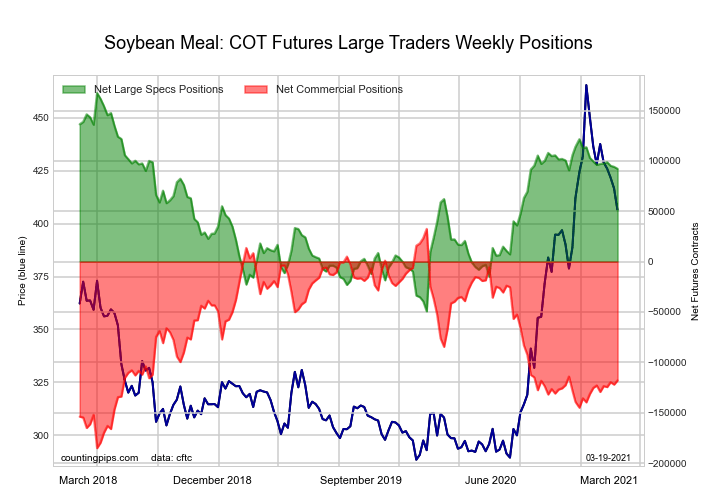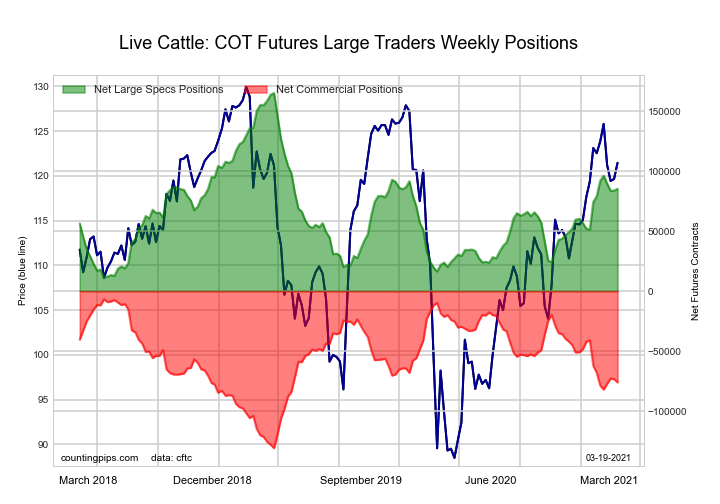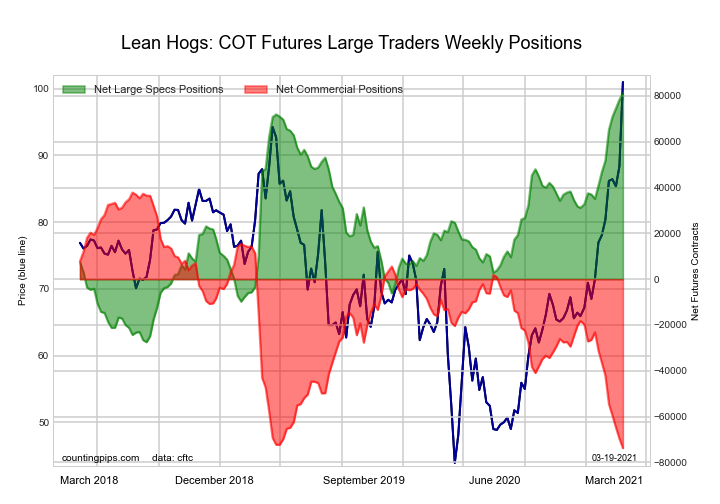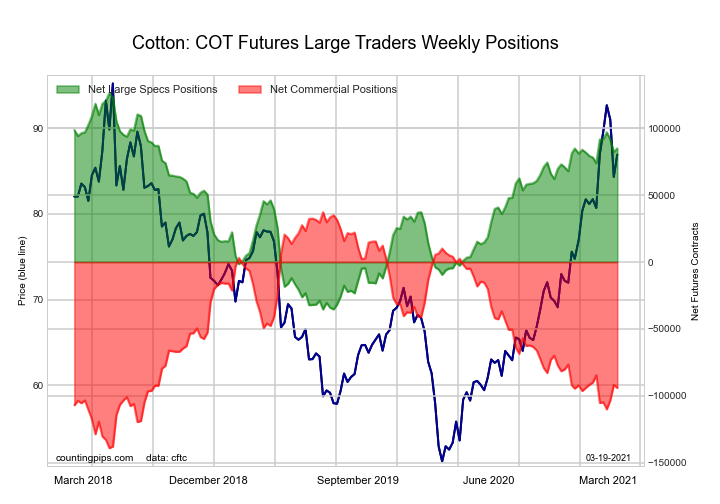
COT Soft Commodities Futures Charts: Soybeans, LeanHogs, Corn, Cattle, Sugar, Coffee

By CountingPips.comReceive our weekly COT Reports by Email

Here are the latest charts and statistics for the Commitment of Traders (COT) data published by the Commodities Futures Trading Commission (CFTC).

The latest COT data is updated through Tuesday March 16 2021 and shows a quick view of how large traders (for-profit speculators and commercial entities) were positioned in the futures markets.


CORN:
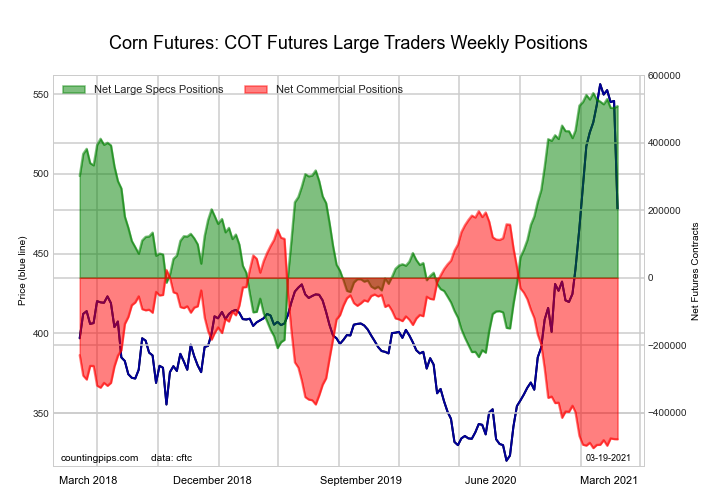
CORN

CORN Futures StatisticsSPECULATORSCOMMERCIALSSMALL TRADERS
– Percent of Open Interest Longs:32.646.88.3
– Percent of Open Interest Shorts:4.173.610.0
– Net Position:509,084-478,665-30,419
– Gross Longs:583,279838,502149,310
– Gross Shorts:74,1951,317,167179,729
– Long to Short Ratio:7.9 to 10.6 to 10.8 to 1
NET POSITION TREND:
– COT Index Score (3 Year Range Pct):95.13.830.1
– COT Index Reading (3 Year Range):Bullish-ExtremeBearish-ExtremeBearish
NET POSITION MOVEMENT INDEX:
– 6-Week Change in Strength Index:-2.52.41.4


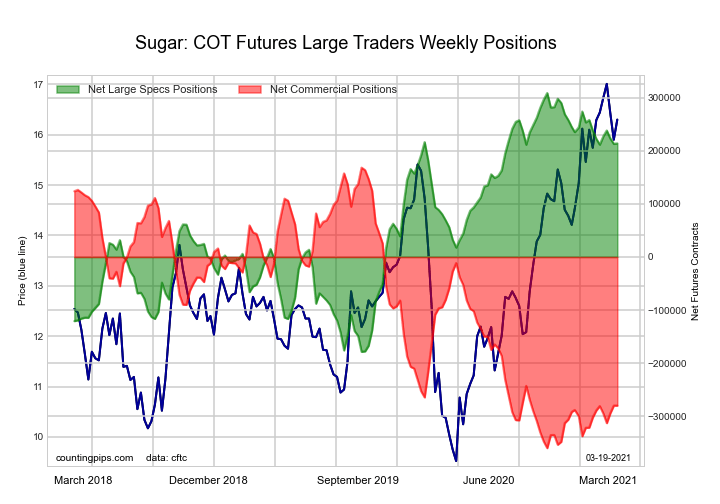
SUGAR:

SUGAR

SUGAR Futures StatisticsSPECULATORSCOMMERCIALSSMALL TRADERS
– Percent of Open Interest Longs:26.149.610.2
– Percent of Open Interest Shorts:5.776.23.9
– Net Position:213,767-279,63365,866
– Gross Longs:273,487519,254106,364
– Gross Shorts:59,720798,88740,498
– Long to Short Ratio:4.6 to 10.6 to 12.6 to 1
NET POSITION TREND:
– COT Index Score (3 Year Range Pct):80.515.189.4
– COT Index Reading (3 Year Range):Bullish-ExtremeBearish-ExtremeBullish-Extreme
NET POSITION MOVEMENT INDEX:
– 6-Week Change in Strength Index:-1.81.8-0.7


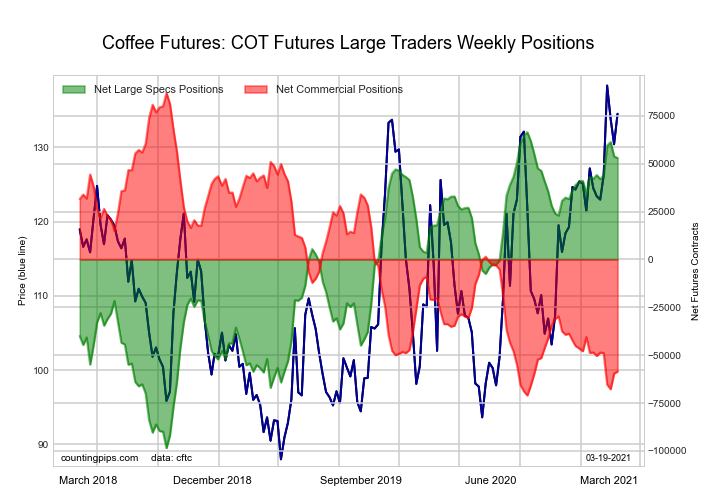
COFFEE:

COFFEE

COFFEE Futures StatisticsSPECULATORSCOMMERCIALSSMALL TRADERS
– Percent of Open Interest Longs:27.045.04.1
– Percent of Open Interest Shorts:8.065.92.1
– Net Position:52,943-58,5025,559
– Gross Longs:75,413125,74511,530
– Gross Shorts:22,470184,2475,971
– Long to Short Ratio:3.4 to 10.7 to 11.9 to 1
NET POSITION TREND:
– COT Index Score (3 Year Range Pct):91.97.926.8
– COT Index Reading (3 Year Range):Bullish-ExtremeBearish-ExtremeBearish
NET POSITION MOVEMENT INDEX:
– 6-Week Change in Strength Index:5.4-5.2-5.1


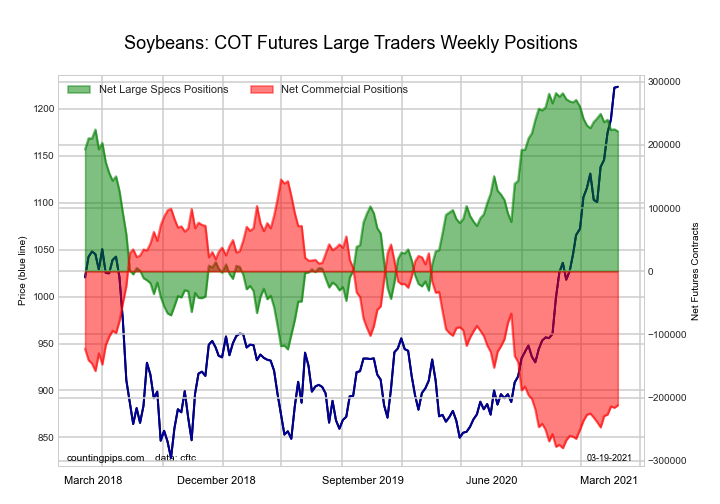
SOYBEANS:

SOYBEANS

SOYBEANS Futures StatisticsSPECULATORSCOMMERCIALSSMALL TRADERS
– Percent of Open Interest Longs:31.045.77.9
– Percent of Open Interest Shorts:5.170.59.0
– Net Position:221,531-212,051-9,480
– Gross Longs:265,531391,67667,451
– Gross Shorts:44,000603,72776,931
– Long to Short Ratio:6.0 to 10.6 to 10.9 to 1
NET POSITION TREND:
– COT Index Score (3 Year Range Pct):85.115.969.7
– COT Index Reading (3 Year Range):Bullish-ExtremeBearish-ExtremeBullish
NET POSITION MOVEMENT INDEX:
– 6-Week Change in Strength Index:-5.16.3-6.7


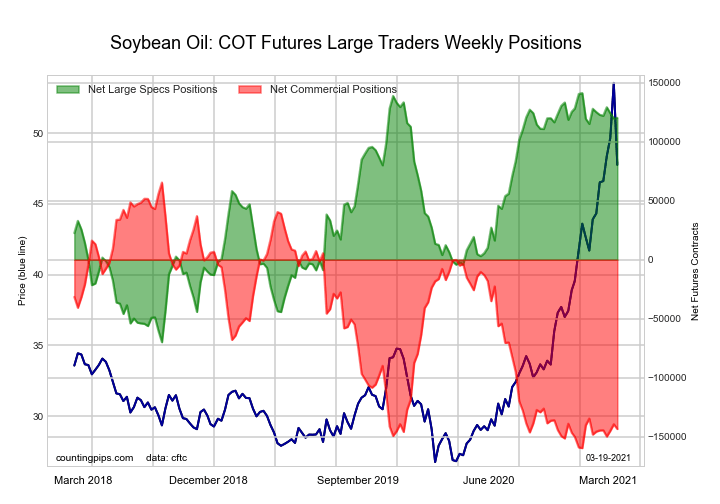
SOYBEAN OIL:

SOYBEAN OIL

SOYBEAN OIL Futures StatisticsSPECULATORSCOMMERCIALSSMALL TRADERS
– Percent of Open Interest Longs:30.841.610.0
– Percent of Open Interest Shorts:6.670.55.3
– Net Position:120,152-143,35123,199
– Gross Longs:152,943206,80249,602
– Gross Shorts:32,791350,15326,403
– Long to Short Ratio:4.7 to 10.6 to 11.9 to 1
NET POSITION TREND:
– COT Index Score (3 Year Range Pct):90.07.2100.0
– COT Index Reading (3 Year Range):Bullish-ExtremeBearish-ExtremeBullish-Extreme
NET POSITION MOVEMENT INDEX:
– 6-Week Change in Strength Index:-2.31.09.8


SOYBEAN MEAL:

SOYBEAN MEAL

SOYBEAN MEAL Futures StatisticsSPECULATORSCOMMERCIALSSMALL TRADERS
– Percent of Open Interest Longs:26.148.412.8
– Percent of Open Interest Shorts:3.876.96.6
– Net Position:92,181-117,93425,753
– Gross Longs:107,983200,73752,925
– Gross Shorts:15,802318,67127,172
– Long to Short Ratio:6.8 to 10.6 to 11.9 to 1
NET POSITION TREND:
– COT Index Score (3 Year Range Pct):65.330.973.8
– COT Index Reading (3 Year Range):BullishBearishBullish
NET POSITION MOVEMENT INDEX:
– 6-Week Change in Strength Index:-1.92.3-3.9


LIVE CATTLE:

LIVE CATTLE

LIVE CATTLE Futures StatisticsSPECULATORSCOMMERCIALSSMALL TRADERS
– Percent of Open Interest Longs:36.235.910.0
– Percent of Open Interest Shorts:11.158.312.7
– Net Position:85,285-76,008-9,277
– Gross Longs:123,037121,86433,844
– Gross Shorts:37,752197,87243,121
– Long to Short Ratio:3.3 to 10.6 to 10.8 to 1
NET POSITION TREND:
– COT Index Score (3 Year Range Pct):48.144.264.5
– COT Index Reading (3 Year Range):BearishBearishBullish
NET POSITION MOVEMENT INDEX:
– 6-Week Change in Strength Index:4.0-6.44.4


LEAN HOGS:

LEAN HOGS

LEAN HOGS Futures StatisticsSPECULATORSCOMMERCIALSSMALL TRADERS
– Percent of Open Interest Longs:42.630.89.1
– Percent of Open Interest Shorts:12.657.911.9
– Net Position:81,267-73,742-7,525
– Gross Longs:115,53883,46924,637
– Gross Shorts:34,271157,21132,162
– Long to Short Ratio:3.4 to 10.5 to 10.8 to 1
NET POSITION TREND:
– COT Index Score (3 Year Range Pct):100.00.042.0
– COT Index Reading (3 Year Range):Bullish-ExtremeBearish-ExtremeBearish
NET POSITION MOVEMENT INDEX:
– 6-Week Change in Strength Index:31.6-33.413.3


COTTON:

COTTON

COTTON Futures StatisticsSPECULATORSCOMMERCIALSSMALL TRADERS
– Percent of Open Interest Longs:40.241.17.1
– Percent of Open Interest Shorts:3.681.63.1
– Net Position:84,949-94,1179,168
– Gross Longs:93,35495,37016,432
– Gross Shorts:8,405189,4877,264
– Long to Short Ratio:11.1 to 10.5 to 12.3 to 1
NET POSITION TREND:
– COT Index Score (3 Year Range Pct):74.425.566.1
– COT Index Reading (3 Year Range):BullishBearishBullish
NET POSITION MOVEMENT INDEX:
– 6-Week Change in Strength Index:6.8-5.4-9.1


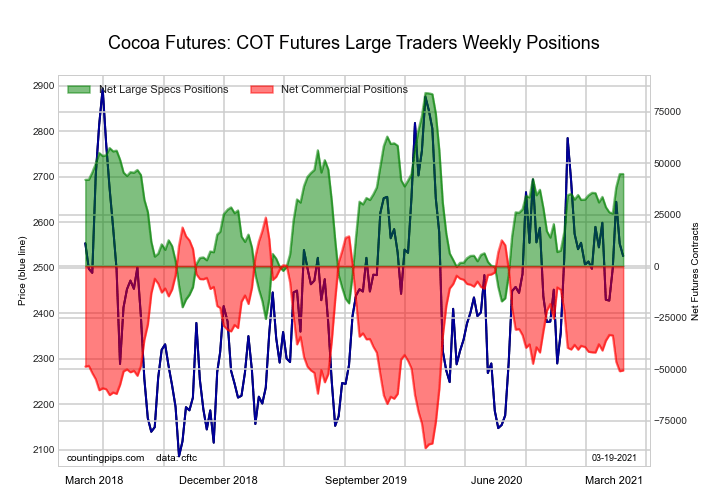
COCOA:

COCOA

COCOA Futures StatisticsSPECULATORSCOMMERCIALSSMALL TRADERS
– Percent of Open Interest Longs:37.137.45.6
– Percent of Open Interest Shorts:15.162.32.8
– Net Position:44,756-50,5795,823
– Gross Longs:75,41176,05511,434
– Gross Shorts:30,655126,6345,611
– Long to Short Ratio:2.5 to 10.6 to 12.0 to 1
NET POSITION TREND:
– COT Index Score (3 Year Range Pct):64.133.774.7
– COT Index Reading (3 Year Range):BullishBearishBullish
NET POSITION MOVEMENT INDEX:
– 6-Week Change in Strength Index:10.1-8.7-16.2


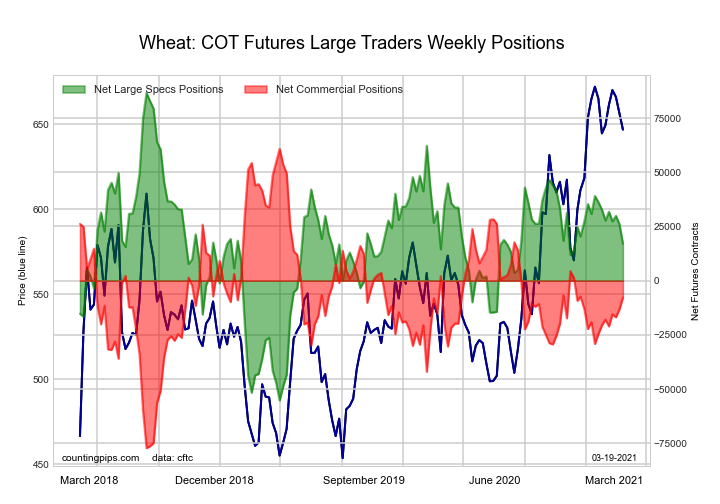
WHEAT:

WHEAT

WHEAT Futures StatisticsSPECULATORSCOMMERCIALSSMALL TRADERS
– Percent of Open Interest Longs:28.237.78.0
– Percent of Open Interest Shorts:24.139.610.2
– Net Position:17,056-7,681-9,375
– Gross Longs:118,153158,20133,353
– Gross Shorts:101,097165,88242,728
– Long to Short Ratio:1.2 to 11.0 to 10.8 to 1
NET POSITION TREND:
– COT Index Score (3 Year Range Pct):51.050.456.8
– COT Index Reading (3 Year Range):BullishBullishBullish
NET POSITION MOVEMENT INDEX:
– 6-Week Change in Strength Index:-11.19.313.8


Article By CountingPips.comReceive our weekly COT Reports by Email

*COT Report: The COT data, released weekly to the public each Friday, is updated through the most recent Tuesday (data is 3 days old) and shows a quick view of how large speculators or non-commercials (for-profit traders) were positioned in the futures markets.

The CFTC categorizes trader positions according to commercial hedgers (traders who use futures contracts for hedging as part of the business), non-commercials (large traders who speculate to realize trading profits) and nonreportable traders (usually small traders/speculators).

Find CFTC criteria here: (http://www.cftc.gov/MarketReports/CommitmentsofTraders/ExplanatoryNotes/index.htm).

COT Bonds Futures Charts: Eurodollars, 2-Year, 5-Year, Ultra 10-Year Notes, 30-Day Fed Funds

By CountingPips.comReceive our weekly COT Reports by Email

Here are the latest charts and statistics for the Commitment of Traders (COT) data published by the Commodities Futures Trading Commission (CFTC).

The latest COT data is updated through Tuesday March 16 2021 and shows a quick view of how large traders (for-profit speculators and commercial entities) were positioned in the futures markets.


30-Day Federal Funds:

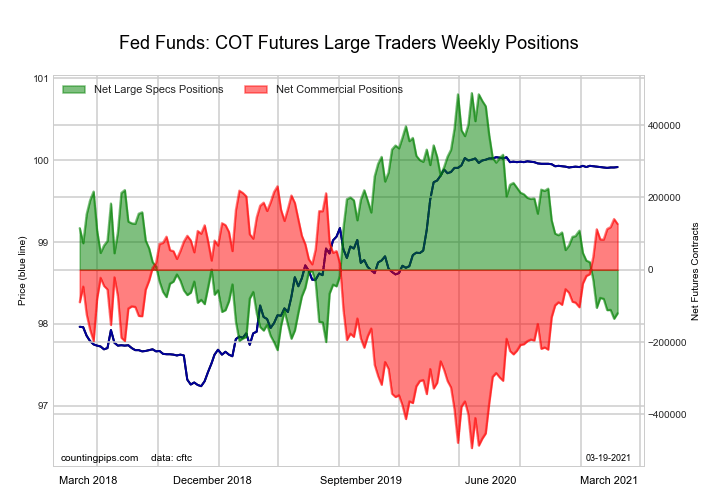
30-Day Federal Funds

30-Day Federal Funds StatisticsSPECULATORSCOMMERCIALSSMALL TRADERS
– Percent of Open Interest Longs:6.171.71.9
– Percent of Open Interest Shorts:17.659.62.6
– Net Position:-120,238126,824-6,586
– Gross Longs:63,712751,38620,219
– Gross Shorts:183,950624,56226,805
– Long to Short Ratio:0.3 to 11.2 to 10.8 to 1
NET POSITION TREND:
– COT Index Score (3 Year Range Pct):14.385.659.1
– COT Index Reading (3 Year Range):Bearish-ExtremeBullish-ExtremeBullish
NET POSITION MOVEMENT INDEX:
– 6-Week Change in Strength Index:-2.12.01.0


2-Year Treasury Note:

2-Year Treasury Note

2-Year Treasury Note StatisticsSPECULATORSCOMMERCIALSSMALL TRADERS
– Percent of Open Interest Longs:16.176.05.9
– Percent of Open Interest Shorts:29.562.95.6
– Net Position:-316,515309,9186,597
– Gross Longs:381,0761,799,172138,912
– Gross Shorts:697,5911,489,254132,315
– Long to Short Ratio:0.5 to 11.2 to 11.0 to 1
NET POSITION TREND:
– COT Index Score (3 Year Range Pct):21.077.038.3
– COT Index Reading (3 Year Range):BearishBullishBearish
NET POSITION MOVEMENT INDEX:
– 6-Week Change in Strength Index:-22.131.4-30.0


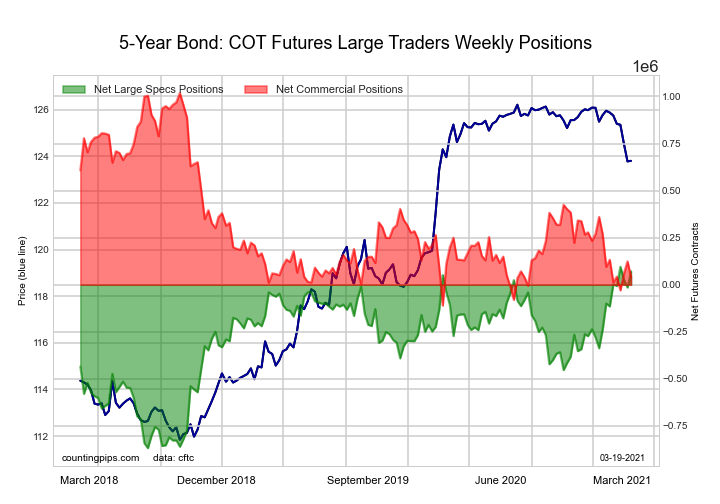
5-Year Treasury Note:

5-Year Treasury Note

5-Year Treasury Note StatisticsSPECULATORSCOMMERCIALSSMALL TRADERS
– Percent of Open Interest Longs:17.072.47.9
– Percent of Open Interest Shorts:14.971.211.2
– Net Position:71,85941,620-113,479
– Gross Longs:581,4342,478,234269,227
– Gross Shorts:509,5752,436,614382,706
– Long to Short Ratio:1.1 to 11.0 to 10.7 to 1
NET POSITION TREND:
– COT Index Score (3 Year Range Pct):97.613.431.9
– COT Index Reading (3 Year Range):Bullish-ExtremeBearish-ExtremeBearish
NET POSITION MOVEMENT INDEX:
– 6-Week Change in Strength Index:19.4-8.1-35.7


10-Year Treasury Note:

10-Year Treasury Note

10-Year Treasury Note StatisticsSPECULATORSCOMMERCIALSSMALL TRADERS
– Percent of Open Interest Longs:17.472.38.1
– Percent of Open Interest Shorts:17.366.913.5
– Net Position:4,104204,053-208,157
– Gross Longs:661,2622,750,856306,792
– Gross Shorts:657,1582,546,803514,949
– Long to Short Ratio:1.0 to 11.1 to 10.6 to 1
NET POSITION TREND:
– COT Index Score (3 Year Range Pct):83.737.417.4
– COT Index Reading (3 Year Range):Bullish-ExtremeBearishBearish-Extreme
NET POSITION MOVEMENT INDEX:
– 6-Week Change in Strength Index:-6.012.2-19.8


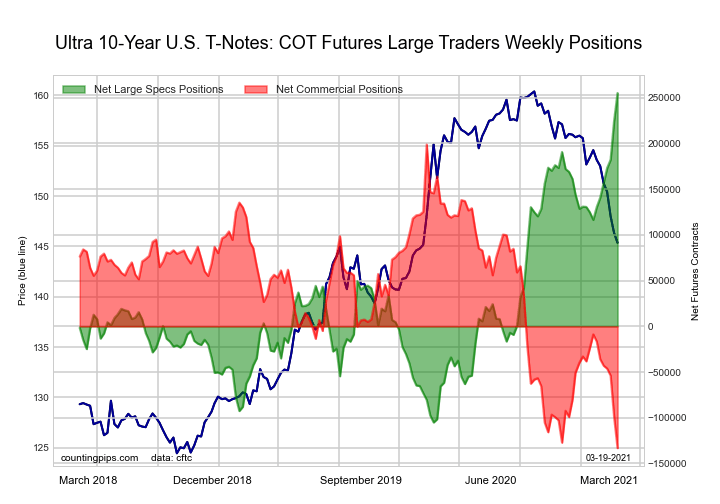
Ultra 10-Year Notes:

Ultra 10-Year Notes

Ultra 10-Year Notes StatisticsSPECULATORSCOMMERCIALSSMALL TRADERS
– Percent of Open Interest Longs:26.264.09.0
– Percent of Open Interest Shorts:6.074.518.6
– Net Position:255,181-133,158-122,023
– Gross Longs:331,359809,744113,453
– Gross Shorts:76,178942,902235,476
– Long to Short Ratio:4.3 to 10.9 to 10.5 to 1
NET POSITION TREND:
– COT Index Score (3 Year Range Pct):100.00.06.1
– COT Index Reading (3 Year Range):Bullish-ExtremeBearish-ExtremeBearish-Extreme
NET POSITION MOVEMENT INDEX:
– 6-Week Change in Strength Index:34.6-35.1-8.0


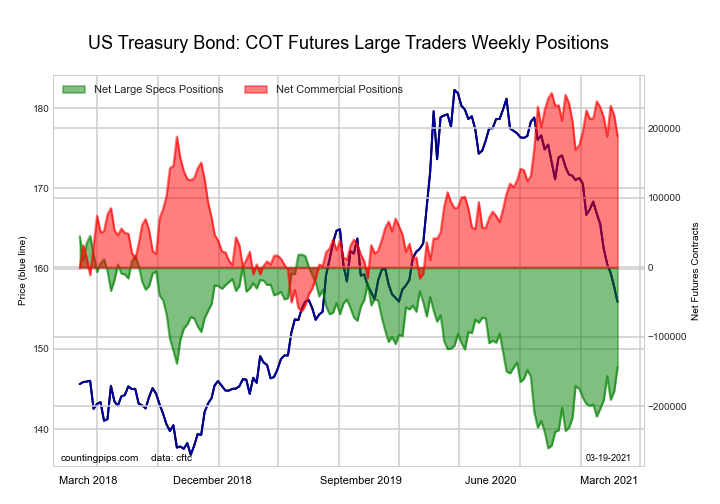
US Treasury Bonds:

US Treasury Bonds

US Treasury Bonds StatisticsSPECULATORSCOMMERCIALSSMALL TRADERS
– Percent of Open Interest Longs:7.777.112.7
– Percent of Open Interest Shorts:19.661.416.4
– Net Position:-143,237188,582-45,345
– Gross Longs:92,408927,941152,576
– Gross Shorts:235,645739,359197,921
– Long to Short Ratio:0.4 to 11.3 to 10.8 to 1
NET POSITION TREND:
– COT Index Score (3 Year Range Pct):38.280.219.5
– COT Index Reading (3 Year Range):BearishBullish-ExtremeBearish-Extreme
NET POSITION MOVEMENT INDEX:
– 6-Week Change in Strength Index:23.3-16.0-16.1


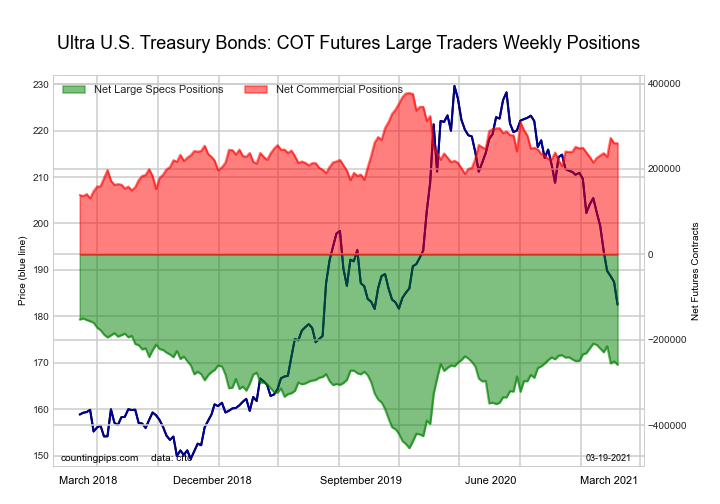
Ultra US Treasury Bonds:

Ultra US Treasury Bonds

Ultra US Treasury Bonds StatisticsSPECULATORSCOMMERCIALSSMALL TRADERS
– Percent of Open Interest Longs:5.681.112.3
– Percent of Open Interest Shorts:27.758.912.4
– Net Position:-258,663260,207-1,544
– Gross Longs:65,590950,409144,267
– Gross Shorts:324,253690,202145,811
– Long to Short Ratio:0.2 to 11.4 to 11.0 to 1
NET POSITION TREND:
– COT Index Score (3 Year Range Pct):64.252.313.4
– COT Index Reading (3 Year Range):BullishBullishBearish-Extreme
NET POSITION MOVEMENT INDEX:
– 6-Week Change in Strength Index:-15.413.910.8


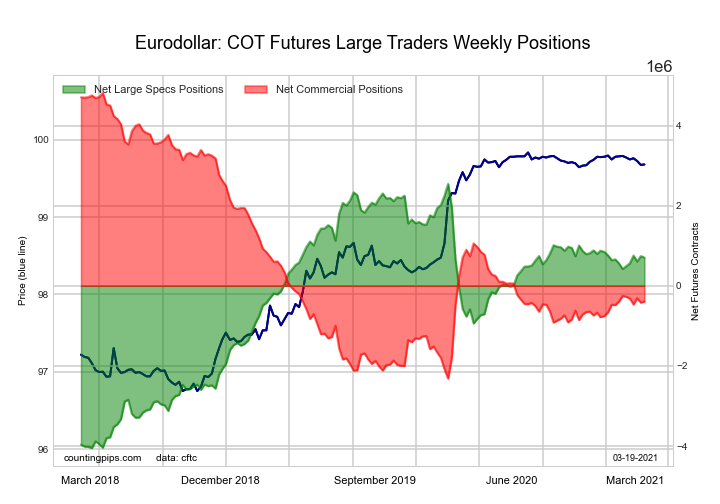
3-Month Eurodollars:

3-Month Eurodollars

3-Month Eurodollars StatisticsSPECULATORSCOMMERCIALSSMALL TRADERS
– Percent of Open Interest Longs:22.847.85.2
– Percent of Open Interest Shorts:16.251.58.2
– Net Position:703,331-391,915-311,416
– Gross Longs:2,417,5925,063,373553,161
– Gross Shorts:1,714,2615,455,288864,577
– Long to Short Ratio:1.4 to 10.9 to 10.6 to 1
NET POSITION TREND:
– COT Index Score (3 Year Range Pct):72.127.062.9
– COT Index Reading (3 Year Range):BullishBearishBullish
NET POSITION MOVEMENT INDEX:
– 6-Week Change in Strength Index:4.3-1.9-18.4


Article By CountingPips.comReceive our weekly COT Reports by Email

*COT Report: The COT data, released weekly to the public each Friday, is updated through the most recent Tuesday (data is 3 days old) and shows a quick view of how large speculators or non-commercials (for-profit traders) were positioned in the futures markets.

The CFTC categorizes trader positions according to commercial hedgers (traders who use futures contracts for hedging as part of the business), non-commercials (large traders who speculate to realize trading profits) and nonreportable traders (usually small traders/speculators).

Find CFTC criteria here: (http://www.cftc.gov/MarketReports/CommitmentsofTraders/ExplanatoryNotes/index.htm).

The 3 Types Of Investors – Which One Are You?

By Orbex

Everyone has their own investment style, which is a reflection of their personality.

This is why certain investment tricks may work great for one person but may be useless for another. We all have different strengths to exploit and weaknesses to protect.

On the other hand, there are some generalities that can help us find similarities in different trading styles. Doing this might help us connect with other traders, and watch out for certain phenomena in the markets.

Also, we can see certain commonalities that could give us inspiration for new strategies. Or, perhaps, it can help us find compatible ideas on how to improve our results.

1.- Spec trader

Perhaps the most (in)famous. The speculative trader is generally looking for an opportunity to jump on that others haven’t spotted yet. It’s also understood to be one of the hardest types of trading, since you have to constantly be consuming information looking for that unseen opportunity.

Spec traders typically have to have more “give” in their trading account, because they have more variance in their results. They typically rely on diversity to ensure they make money in the long run; jumping on several opportunities by not risking much of their balance.

That way, they can take advantage of bigger opportunities, while limiting their losses.

The ups and downs make it quite stressful; though the constant action can be appealing to certain people. Examples abound in popular media, such as the WallStreetBets guys.

2.- Investor trader

Sometimes called a “deep trader,” this type of trader is kind of the opposite of a spec trader. A spec trader narrows their focus to particular areas and make a deep dive into finding data.

For example, they might specialize in mining stocks, and specifically copper miners. And then they might obsess over knowing everything about copper mining to the point of actually taking a guided tour of a copper mine.

Typically, an investor trader is looking to find a company they can know all the ins and outs of, and can then take a larger stake with more confidence.

They try to beat the spec traders by specializing in a certain area. Although larger investments typically imply higher risk, the objective is to offset them by investing in solid assets that appreciate over time.

Activist investors can fall into this category, so think of the Icahn or Elliott.

3.- Value trader

Value traders don’t care about all the hubbub around the markets. They are looking for a solid investment that will provide a return over time.

Generally, they are mathematical in their approach to the markets, focusing more on quantifiable measures. For example, focusing more on dividends than price action.

Often they are found obsessively tracking bond yields.

The idea is to combine a comfortable range of assets and minimize risk by focusing on the underlying value of the asset. They tend to be more interested in consistent, long-term returns, and don’t really care about a quick profit.

The classic example of a value investor is Warren Buffet.

By Orbex

Gold & Silver Capped By USD Rally

By Orbex

Gold

Gold prices have been broadly higher over the week with price advancing further off the 1700 handle.

However, the market gave back some of those gains on Thursday following the March FOMC meeting on Wednesday. The Fed struck a firmly optimistic view on the economy and raised all of its forecasts for 2021, projecting firm improvements in inflation GDP and labor market conditions.

Despite maintaining its view that rates will remain on hold until 2023, changes in the dot plot suggest there is a growing hawkish shift within the Fed that will need to be monitored going forward.

In light of this meeting, the dollar has turned higher, pulling gold down into the end of the week.

Gold prices were pushed further lower on Thursday as the Philly Fed manufacturing index came out almost twice as high as expected sending the dollar even higher.

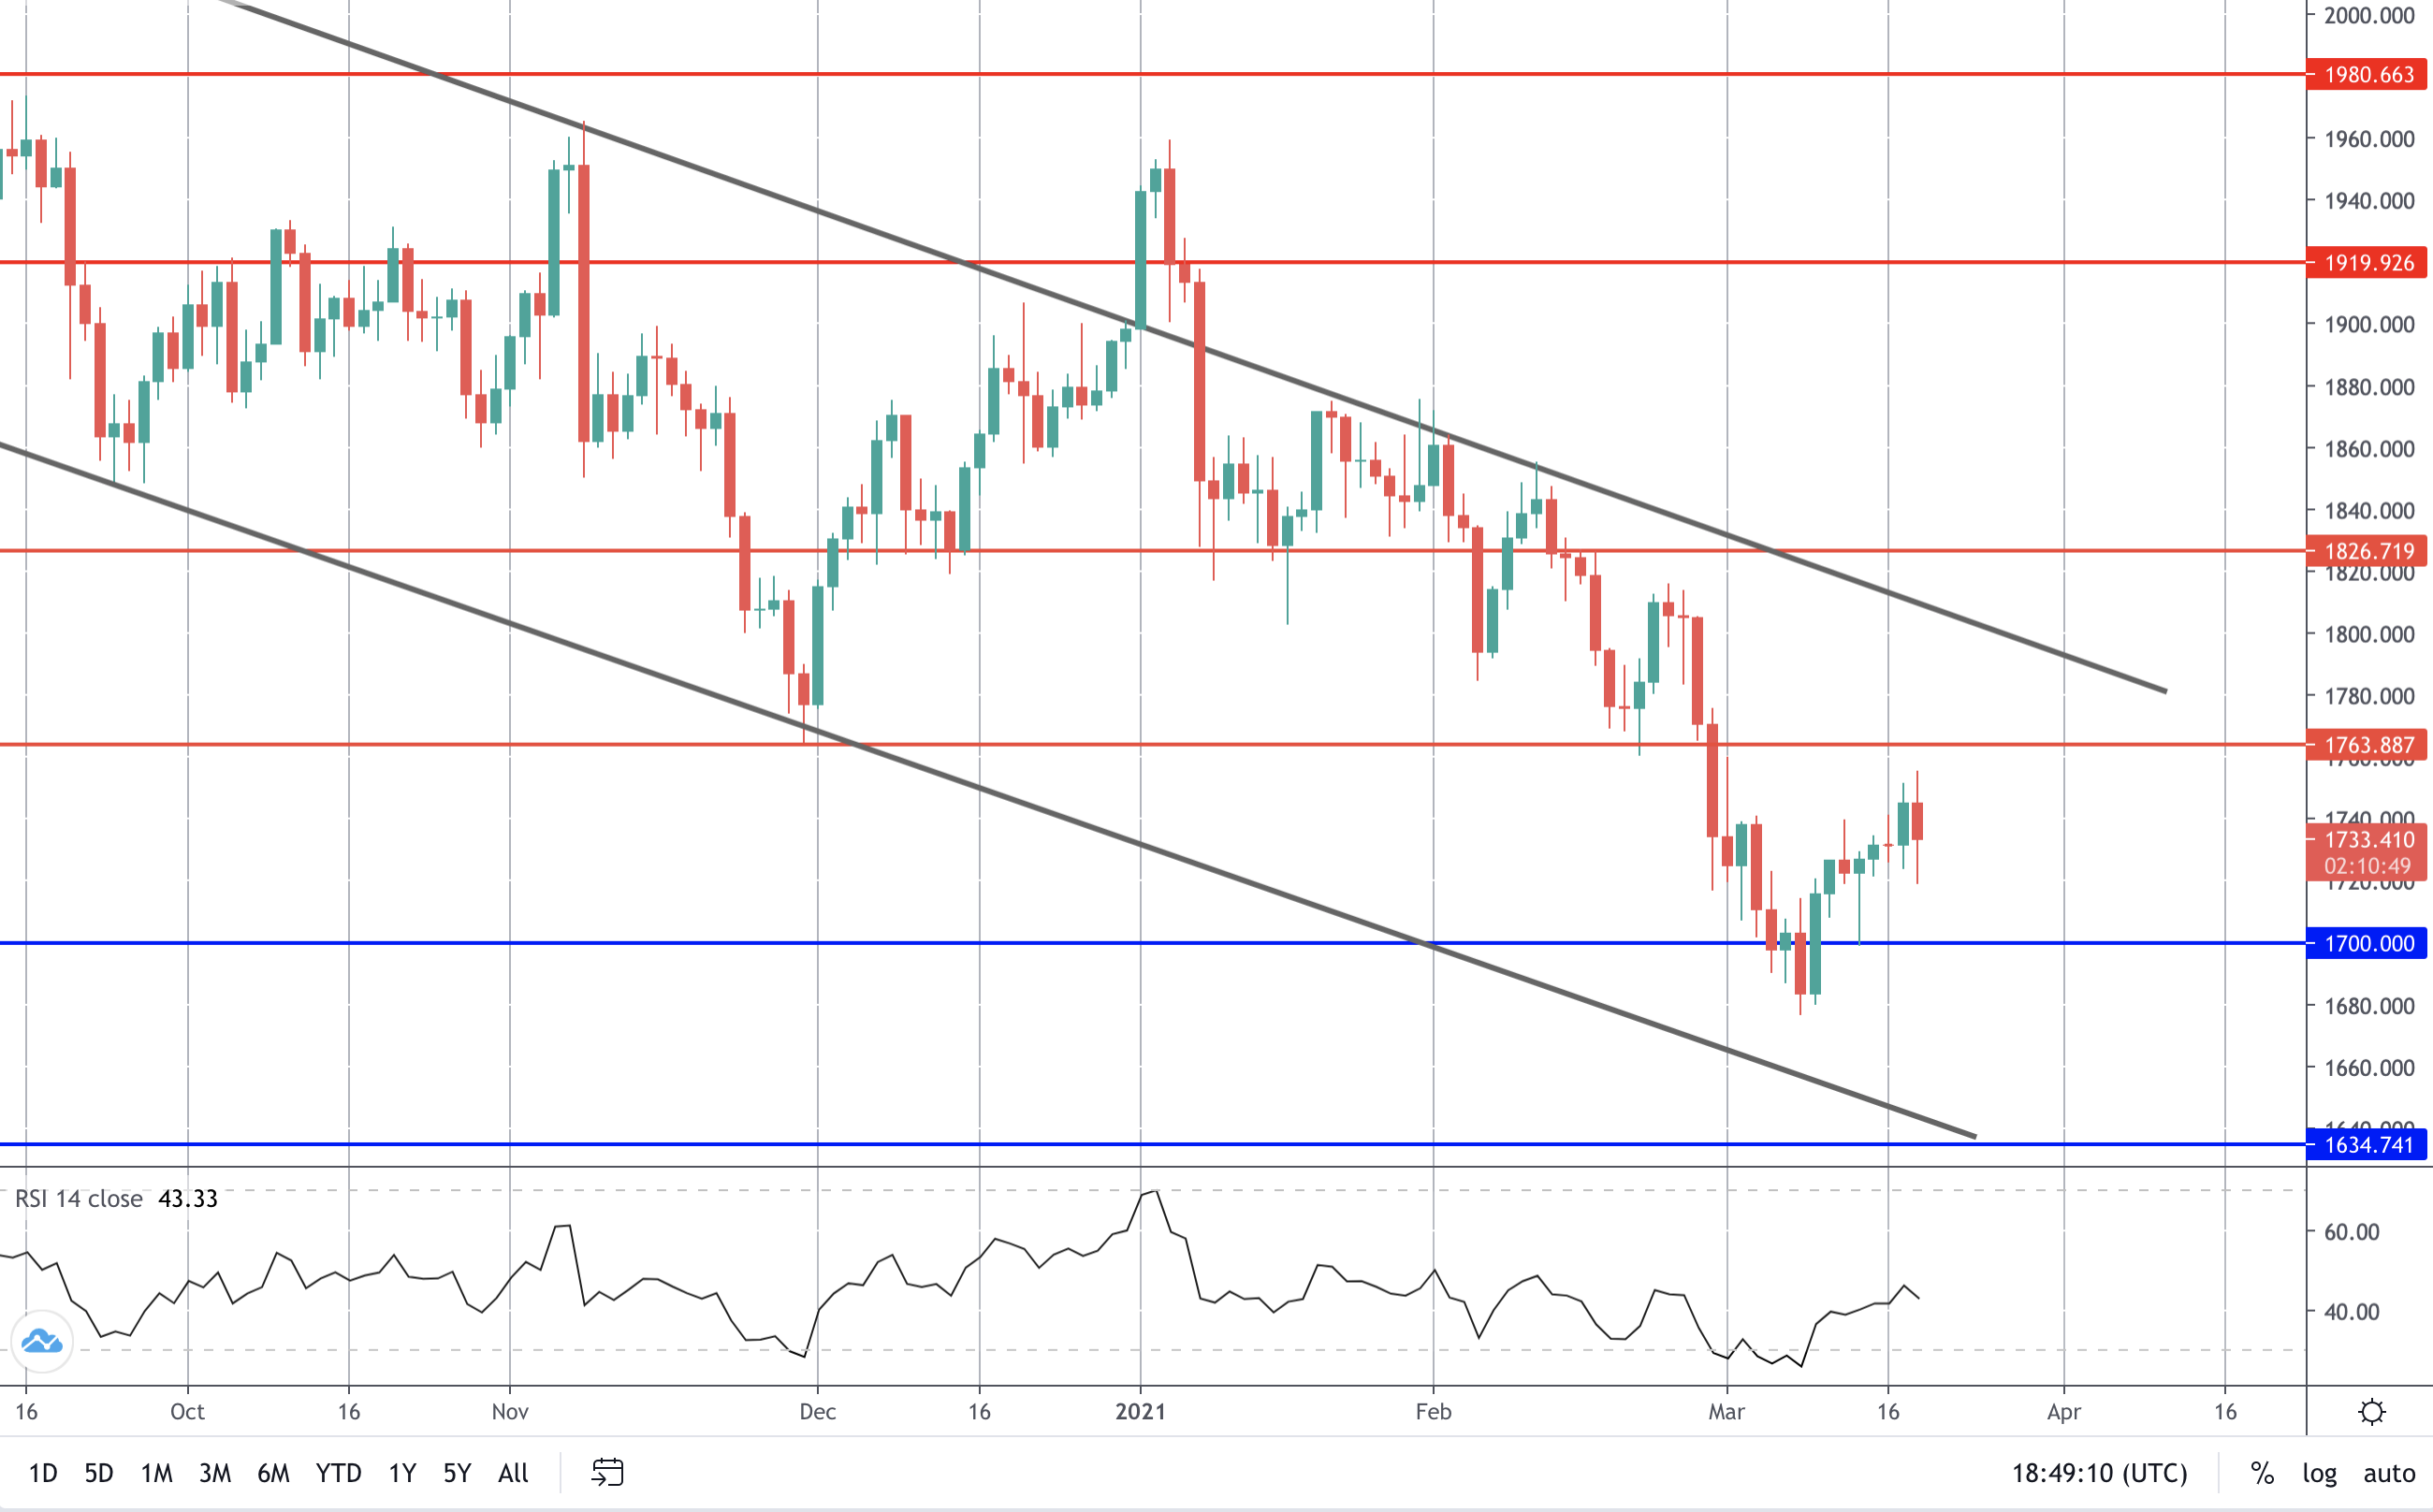
Bear Channel Continues in Gold

xauusd

The bounce off the 1700 level has seen price trading back up to just shy of the 1763.88 level. While price remains below here, and with the bear channel top sitting just above, the focus is on a continued push lower with a break of the 1700 level now a risk.

Below there, 1634.74 is the next big support to watch.

Silver

The silver market has seen much more muted price action than gold this week with price action remaining tightly congested around the 26.00 level and the rising channel low.

The downside impact from the resurgence in USD this week hasn’t impact silver as heavily. The market has been underpinned to an extent by the strength in manufacturing data which supports a better demand outlook for silver.

However, with equities pulling back as the dollar rally builds, there are growing downside risks for silver in the near term.

Silver Hovering Around Support

xagusd

Silver prices continue to oscillate around the 26.00 level with the level having attracted plenty of order flow over recent months.

The rising channel low is still supporting silver also, keeping the near-term bias bullish for now. However, with momentum waning, price could take a dip lower towards the 22.25 level, a break of which could spell a bigger reversal for silver.

By Orbex

Did You Make These Trading Mistakes During COVID?

By Orbex

No one is perfect. No trader doesn’t have losses.

We all make mistakes at some point, and it’s important to pay attention to them so we can learn to improve. Someone said, “I don’t make mistakes, I make learning experiences”.

Sometimes it’s good to review what’s happened and find some company with others who faced similar circumstances. Or maybe learn from what others did to improve our own trading.

That someone also said, “learning from your mistakes is good, learning from others’ mistakes is better.” So, let’s see what happened last year and what we can learn from it.

Business as usual

In hindsight, it’s pretty evident to see when things started to go wrong for the markets in 2020.

But at the time, that was a much more difficult proposition. And this isn’t something that’s unique to covid. Whenever a recession comes along, it’s of course hard to anticipate.

It’s also hard to identify the point at which things turn over.

Market corrections are normal, and initial reports are confusing. There tends to be an expectation that corrective action will be taken.

So, traders can find themselves holding on to a “normal” portfolio, instead of a “crisis” portfolio, longer than they should. Trading strategies that worked perhaps for years leading up to the crisis suddenly don’t work, and it’s hard to adjust to the new circumstances.

What warning signs did we miss, that we can look out for during the next recession or financial crisis?

It’s time to panic

Once the crisis became obvious, uncertainty sets in, and many traders decide to sell everything (even if it implies a loss) and just get out of the market. It’s too dangerous now!

Sure; through most of March, even the most educated immunologists didn’t know much about what was happening with the virus. That level of uncertainty made most traders incredibly nervous.

However, a recession is often a great buying opportunity in the market. Of course, you need to reorient your portfolio, and change strategy. But selling out everything and staying away until it’s recovered is missing out on a potential opportunity. And potentially, it means taking losses that were unnecessary.

In fact, many of the stocks that dropped precipitously in March and April recovered or even exceeded their prior market value in a matter of months.

I’m an expert

In a world of uncertainty, some people can become more confident in what little they do know. This can lead them to take risks they might not take otherwise since their usual instinct to listen to other, more experienced, or knowledgeable people doesn’t kick in.

This is precisely because experts are uncertain, and people with less experience often are more certain because they don’t know all the risks.

Confidence is important in trading, but there is a fine line separating it from overconfidence. It’s important to know if you are confident because you thoroughly understand the situation; or because you are unaware of all the risks.

By Orbex

Fibonacci Retracements Analysis 19.03.2021 (AUDUSD, USDCAD)

Article By RoboForex.com

AUDUSD, “Australian Dollar vs US Dollar”

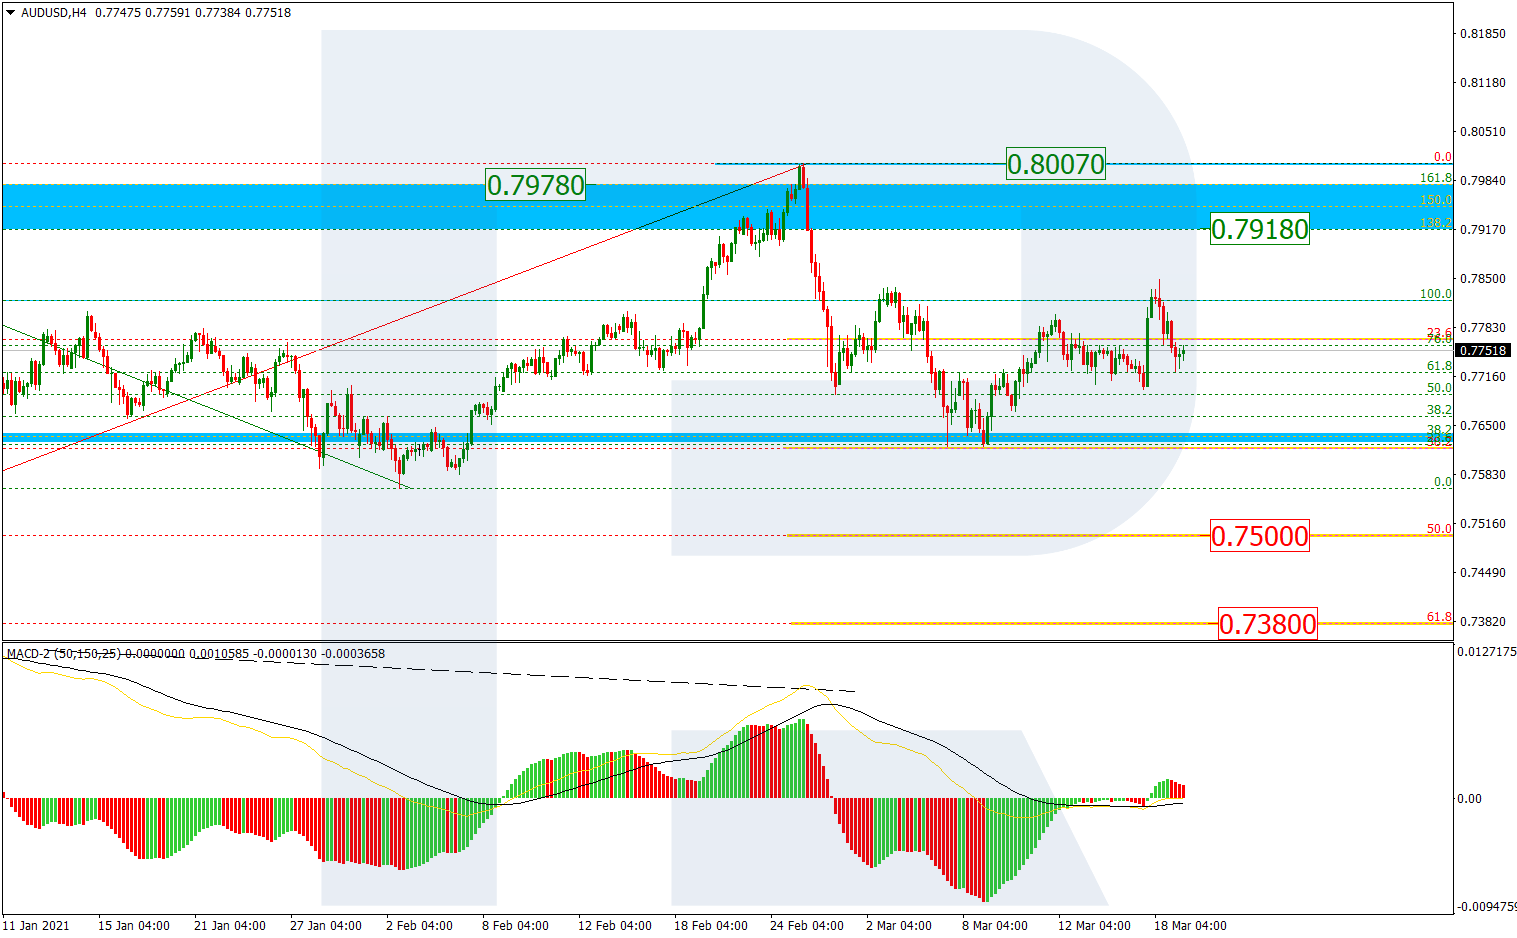
As we can see in the H4 chart, the first “bearish” wave in AUDUSD is experiencing a correction to the upside, which may be over soon. The downside targets may be 50.0% and 61.8% fibo at 0.7500 and 0.7380 respectively. At the same time, despite a divergence on MACD, one shouldn’t exclude a further uptrend to reach the high at 0.8007.

AUDUSD_H4
Risk Warning: the result of previous trading operations do not guarantee the same results in the future

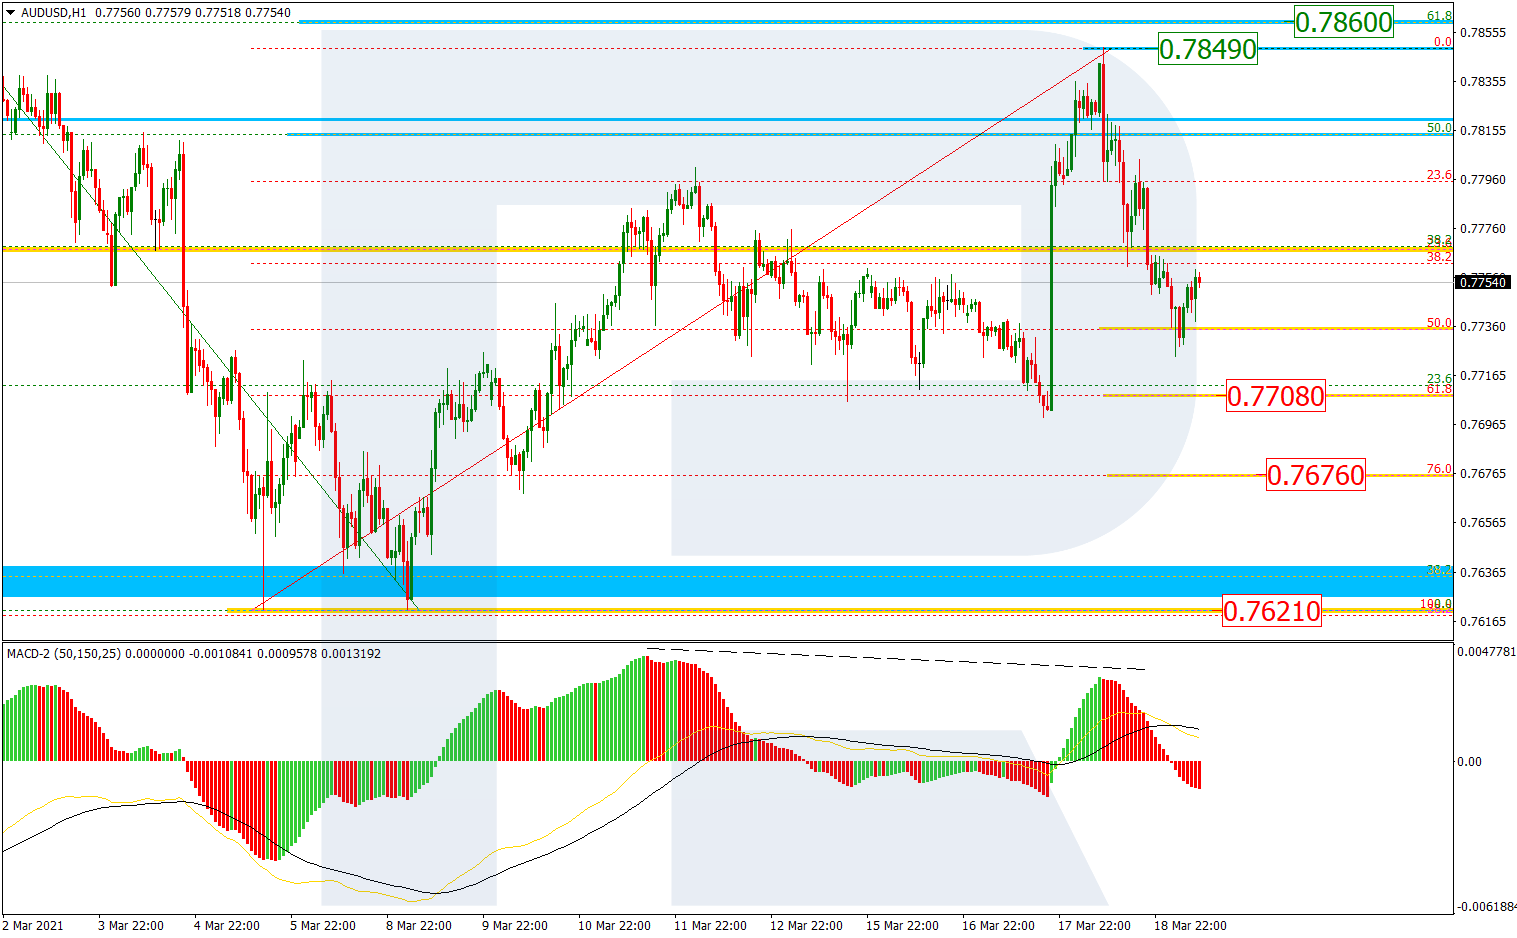
The H1 chart shows a more detailed structure of the current ascending correction, which, after reaching 50.0% fibo, failed to get to 61.8% fibo at 0.7860. Also, there is a local divergence on MACD, which helped the pair to fall towards 50.0% fibo. Later, the price may continue falling to reach 61.8% and 76.0% fibo at 0.7708 and 0.7676 respectively. The resistance is the high at 0.7849.

AUDUSD_H1
Risk Warning: the result of previous trading operations do not guarantee the same results in the future

USDCAD, “US Dollar vs Canadian Dollar”

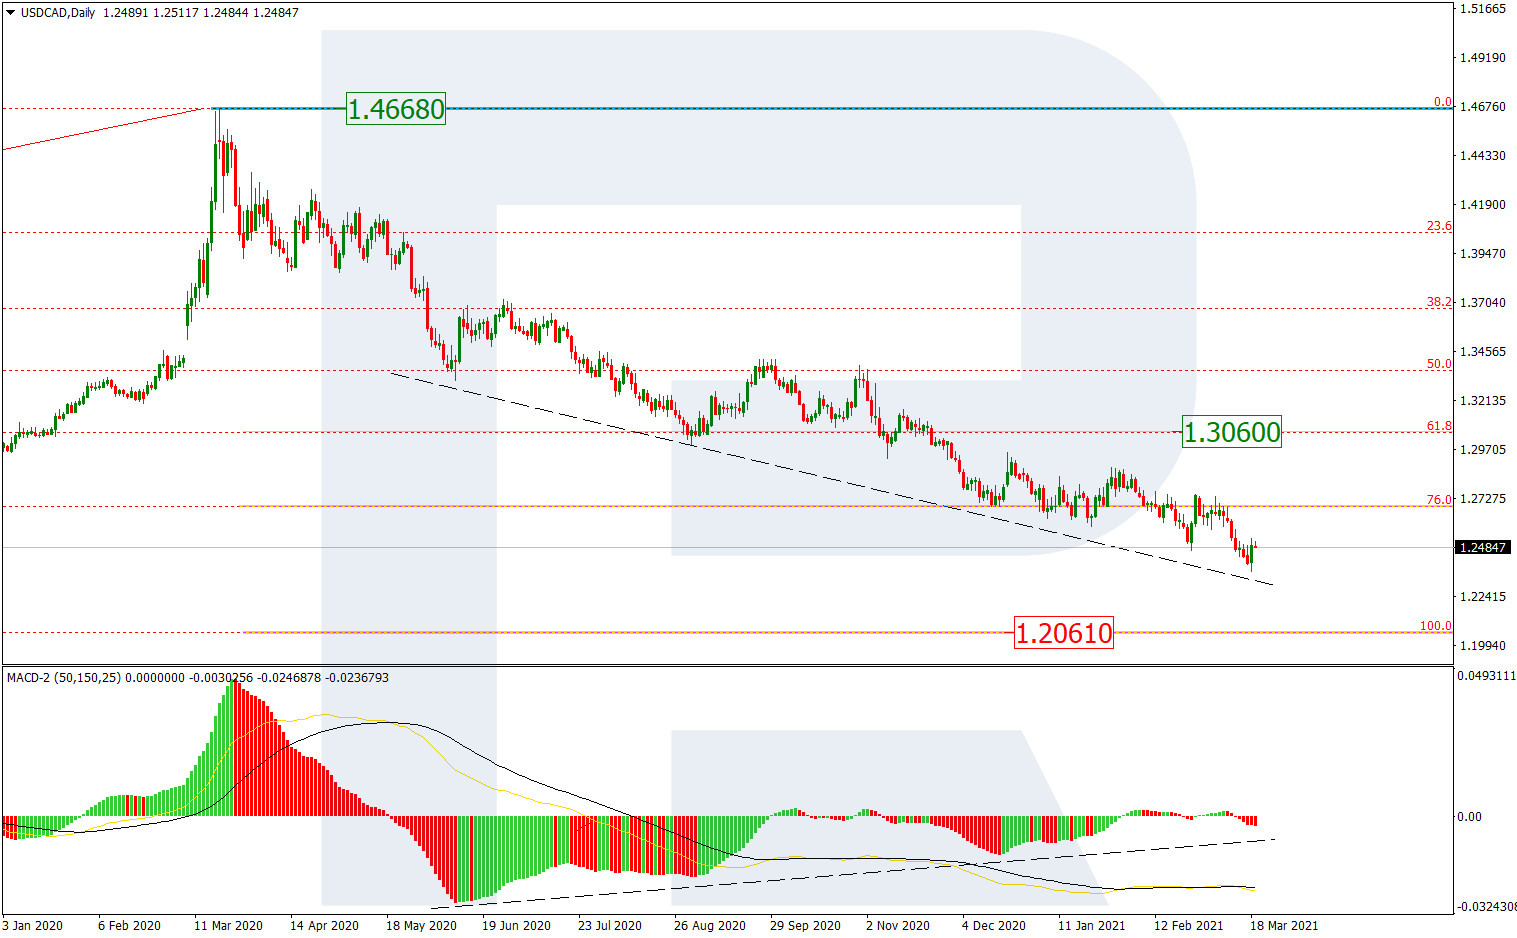
In the daily chart, USDCAD continues forming the stable downtrend towards the fractal low at 1.2061. At the same time, there is a convergence on MACD, which may hint at a possible pullback to the upside to return to 61.8% fibo at 1.3060.

USDCAD_D1
Risk Warning: the result of previous trading operations do not guarantee the same results in the future

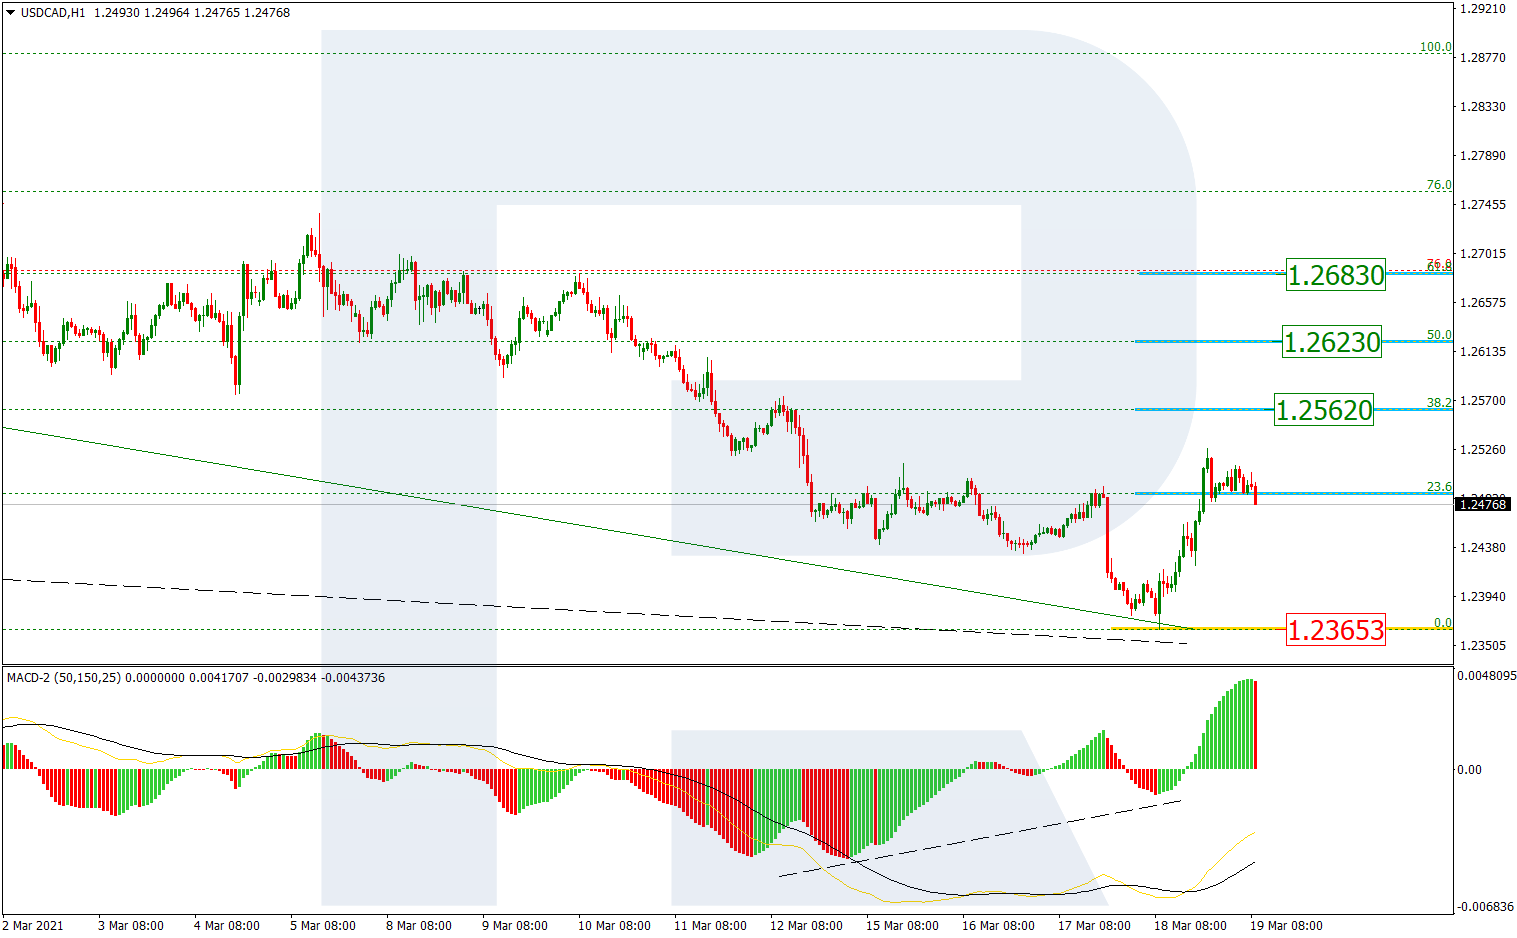
The H1 chart shows a correctional uptrend after a local convergence. The first rising impulse has reached 23.6% fibo and may continue towards 38.2%, 50.0%, and 61.8% fibo at 1.2562, 1.2623, and 1.2683 respectively. The support is the low at 1.2365.

USDCAD_H1

Article By RoboForex.com

Attention!
Forecasts presented in this section only reflect the author’s private opinion and should not be considered as guidance for trading. RoboForex LP bears no responsibility for trading results based on trading recommendations described in these analytical reviews.

Ichimoku Cloud Analysis 19.03.2021 (USDRUB, EURJPY, BRENT)

Article By RoboForex.com

USDRUB, “US Dollar vs Russian Ruble”

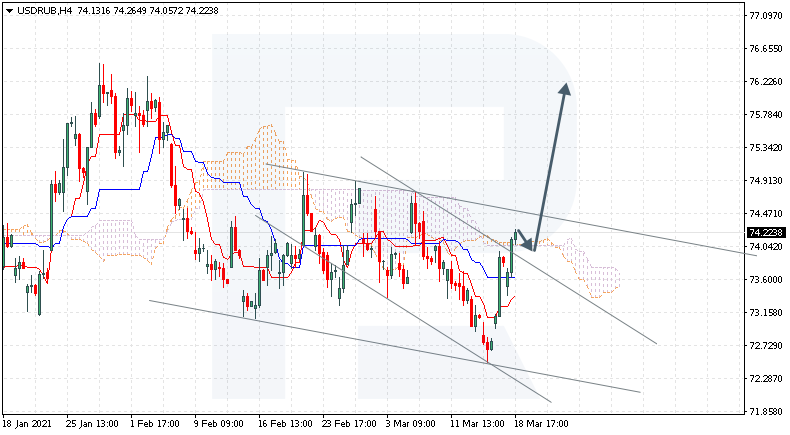
USDRUB is trading at 74.22; the instrument is moving above Ichimoku Cloud, thus indicating an ascending tendency. The markets could indicate that the price may test the cloud’s downside border at 73.95 and then resume moving upwards to reach 76.25. Another signal in favor of a further uptrend will be a rebound from the descending channel’s upside border. However, the bullish scenario may be canceled if the price breaks the cloud’s downside border and fixes below 73.55. In this case, the pair may continue falling towards 72.35. To confirm further growth, the asset must break the descending channel’s upside border and fix above 74.75.

USDRUB
Risk Warning: the result of previous trading operations do not guarantee the same results in the future

EURJPY, “Euro vs Japanese Yen”

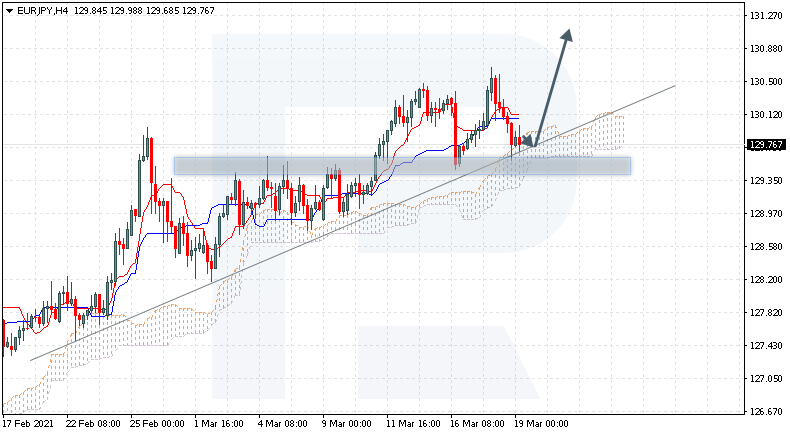
EURJPY is trading at 129.76; the instrument is moving above Ichimoku Cloud, thus indicating an ascending tendency. The markets could indicate that the price may test the cloud’s upside border at 129.55 and then resume moving upwards to reach 131.15. Another signal in favor of a further uptrend will be a rebound from the ascending trendline. However, the bullish scenario may no longer be valid if the price breaks the cloud’s downside border and fixes below 129.25. In this case, the pair may continue falling towards 128.35.

EURJPY
Risk Warning: the result of previous trading operations do not guarantee the same results in the future

BRENT

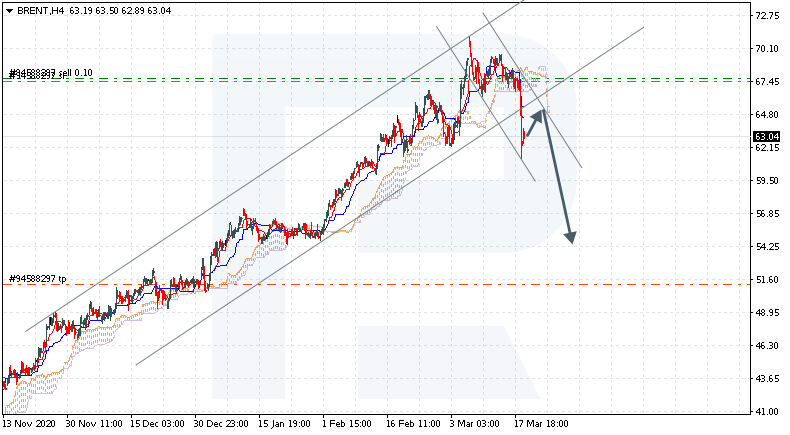
Brent is trading at 63.04; the instrument is moving below Ichimoku Cloud, thus indicating a descending tendency. The markets could indicate that the price may test the cloud’s downside border at 64.75 and then resume moving downwards to reach 54.25. Another signal in favor of a further downtrend will be a rebound from the descending channel’s upside border. However, the bearish scenario may no longer be valid if the price breaks the cloud’s upside border and fixes above 69.75. In this case, the pair may continue growing towards 74.05.

BRENT

Article By RoboForex.com

Attention!
Forecasts presented in this section only reflect the author’s private opinion and should not be considered as guidance for trading. RoboForex LP bears no responsibility for trading results based on trading recommendations described in these analytical reviews.

The Analytical Overview of the Main Currency Pairs on 2021.03.19

by JustForex

The EUR/USD currency pair

Technical indicators of the currency pair:
  • Prev Open: 1.1978
  • Prev Close: 1.1913
  • % chg. over the last day: -0.54%.

On Thursday, the euro fell against the dollar as a sell-off in shares pushed the dollar higher. Also, the market received positive data for the dollar from the manufacturing sector. The Philadelphia Manufacturing Index unexpectedly rose to 51.8 from 23.1 a month earlier, indicating a big difference in the US and Eurozone economies’ recovery.

Trading recommendations
  • Support levels: 1.1882, 1.1834
  • Resistance levels: 1.1990, 1.2113

The main scenario for EUR/USD is sideways trading between 1.1882 and 1.1990. The ADX showed a very weak reaction to Thursday’s decline. At the same time, the position of the MACD below the zero mark and the price-fixing below the moving averages indicate that the pair will continue to decline. Mixed indicators show a flat.

Alternative scenario: if the price manages to consolidate below the level of 1.1882, the pair may return to the decline to 1.1834. A breakdown of 1.1990 could send the pair towards 1.2113.

EUR/USD
There is no news feed for today.

The GBP/USD currency pair

Technical indicators of the currency pair:
  • Prev Open: 1.3958
  • Prev Close: 1.3926
  • % chg. over the last day: -0,23%

The sterling showed little reaction to the appreciation of the dollar, and at the same time, the positive background was unable to support the pair. The Bank of England comments remained unchanged, which slightly disappointed the FX market. But as the decision was not surprising, volatility remained low.

Trading recommendations
  • Support levels: 1.3857, 1.3775
  • Resistance levels: 1.3997, 1.4224

The main scenario for GBP/USD is trading sideways between 1.3857 and 1.3997. The ADX shows a low value of potential and falls on all timeframes from the H1 to the D1. It indicates a high likelihood of the pair staying in the range until the beginning of next week.

Alternative scenario: if the pair consolidates above 1.3997, it may resume growth to the year’s highs. A break at 1.3857 could send the pair towards 1.3775.

GBP/USD
There is no news feed for today.

The USD/JPY currency pair

Technical indicators of the currency pair:
  • Prev Open: 108.85
  • Prev Close: 108.92
  • % chg. over the last day: +0,06%

The dollar-yen pair is beginning to show signs of correction from both the technical and the fundamental sides. Falling stock markets could put significant pressure on the pair. Long shadows at the top of the daily candlesticks indicate strong resistance around 109.34.

Trading recommendations
  • Support levels: 108.35, 107.08
  • Resistance levels: 109.34, 109.86

The main scenario is trading in a sideways range between 109.34 and 108.35. The ADX on the hourly timeframe is kept at the minimum values. The likelihood of a quick resumption of growth in the pair has significantly decreased. The price-fixing below the moving averages more and more indicates a fall in price to the first support level.

An alternative scenario implies the price-fixing below 108.35. In this case, the pair may return to the decline to 107.08. A breakdown of 109.34 will resume growth.

USD/JPY
There is no news feed for today.

The USD/CAD currency pair

Technical indicators of the currency pair:
  • Prev Open: 1.2404
  • Prev Close: 1.2489
  • % chg. over the last day: +0.69%

The Canadian dollar showed the greatest volatility among the G10 currencies, as a result of which the pair broke through two resistance levels at once. The reason for the sharp rise in the pair was the fall in oil prices. New restrictions in Europe amid the pandemic have worsened forecasts of global energy demand.

Trading recommendations
  • Support levels: 1.2446, 1.2364
  • Resistance levels: 1.2512, 1.2589

The main scenario is buying. On Thursday’s northern impulse, the ADX showed a strong reaction. The MACD has sharply entered the positive area, and the price has consolidated above the moving averages. It may indicate a mid-term northern correction.

Alternative scenario: if the price manages to gain a foothold below 1.2466, the pair may resume its southern movement.

USD/CAD
News feed for 2021.03.19:
  • – The Core Retail Sales Index in Canada (m/m) (Jan) at 15:30 (GMT+2).

by JustForex


This article reflects a personal opinion and should not be interpreted as an investment advice, and/or offer, and/or a persistent request for carrying out financial transactions, and/or a guarantee, and/or a forecast of future events.

FedEx Higher Pre-Market Following Earnings Beat

By Orbex

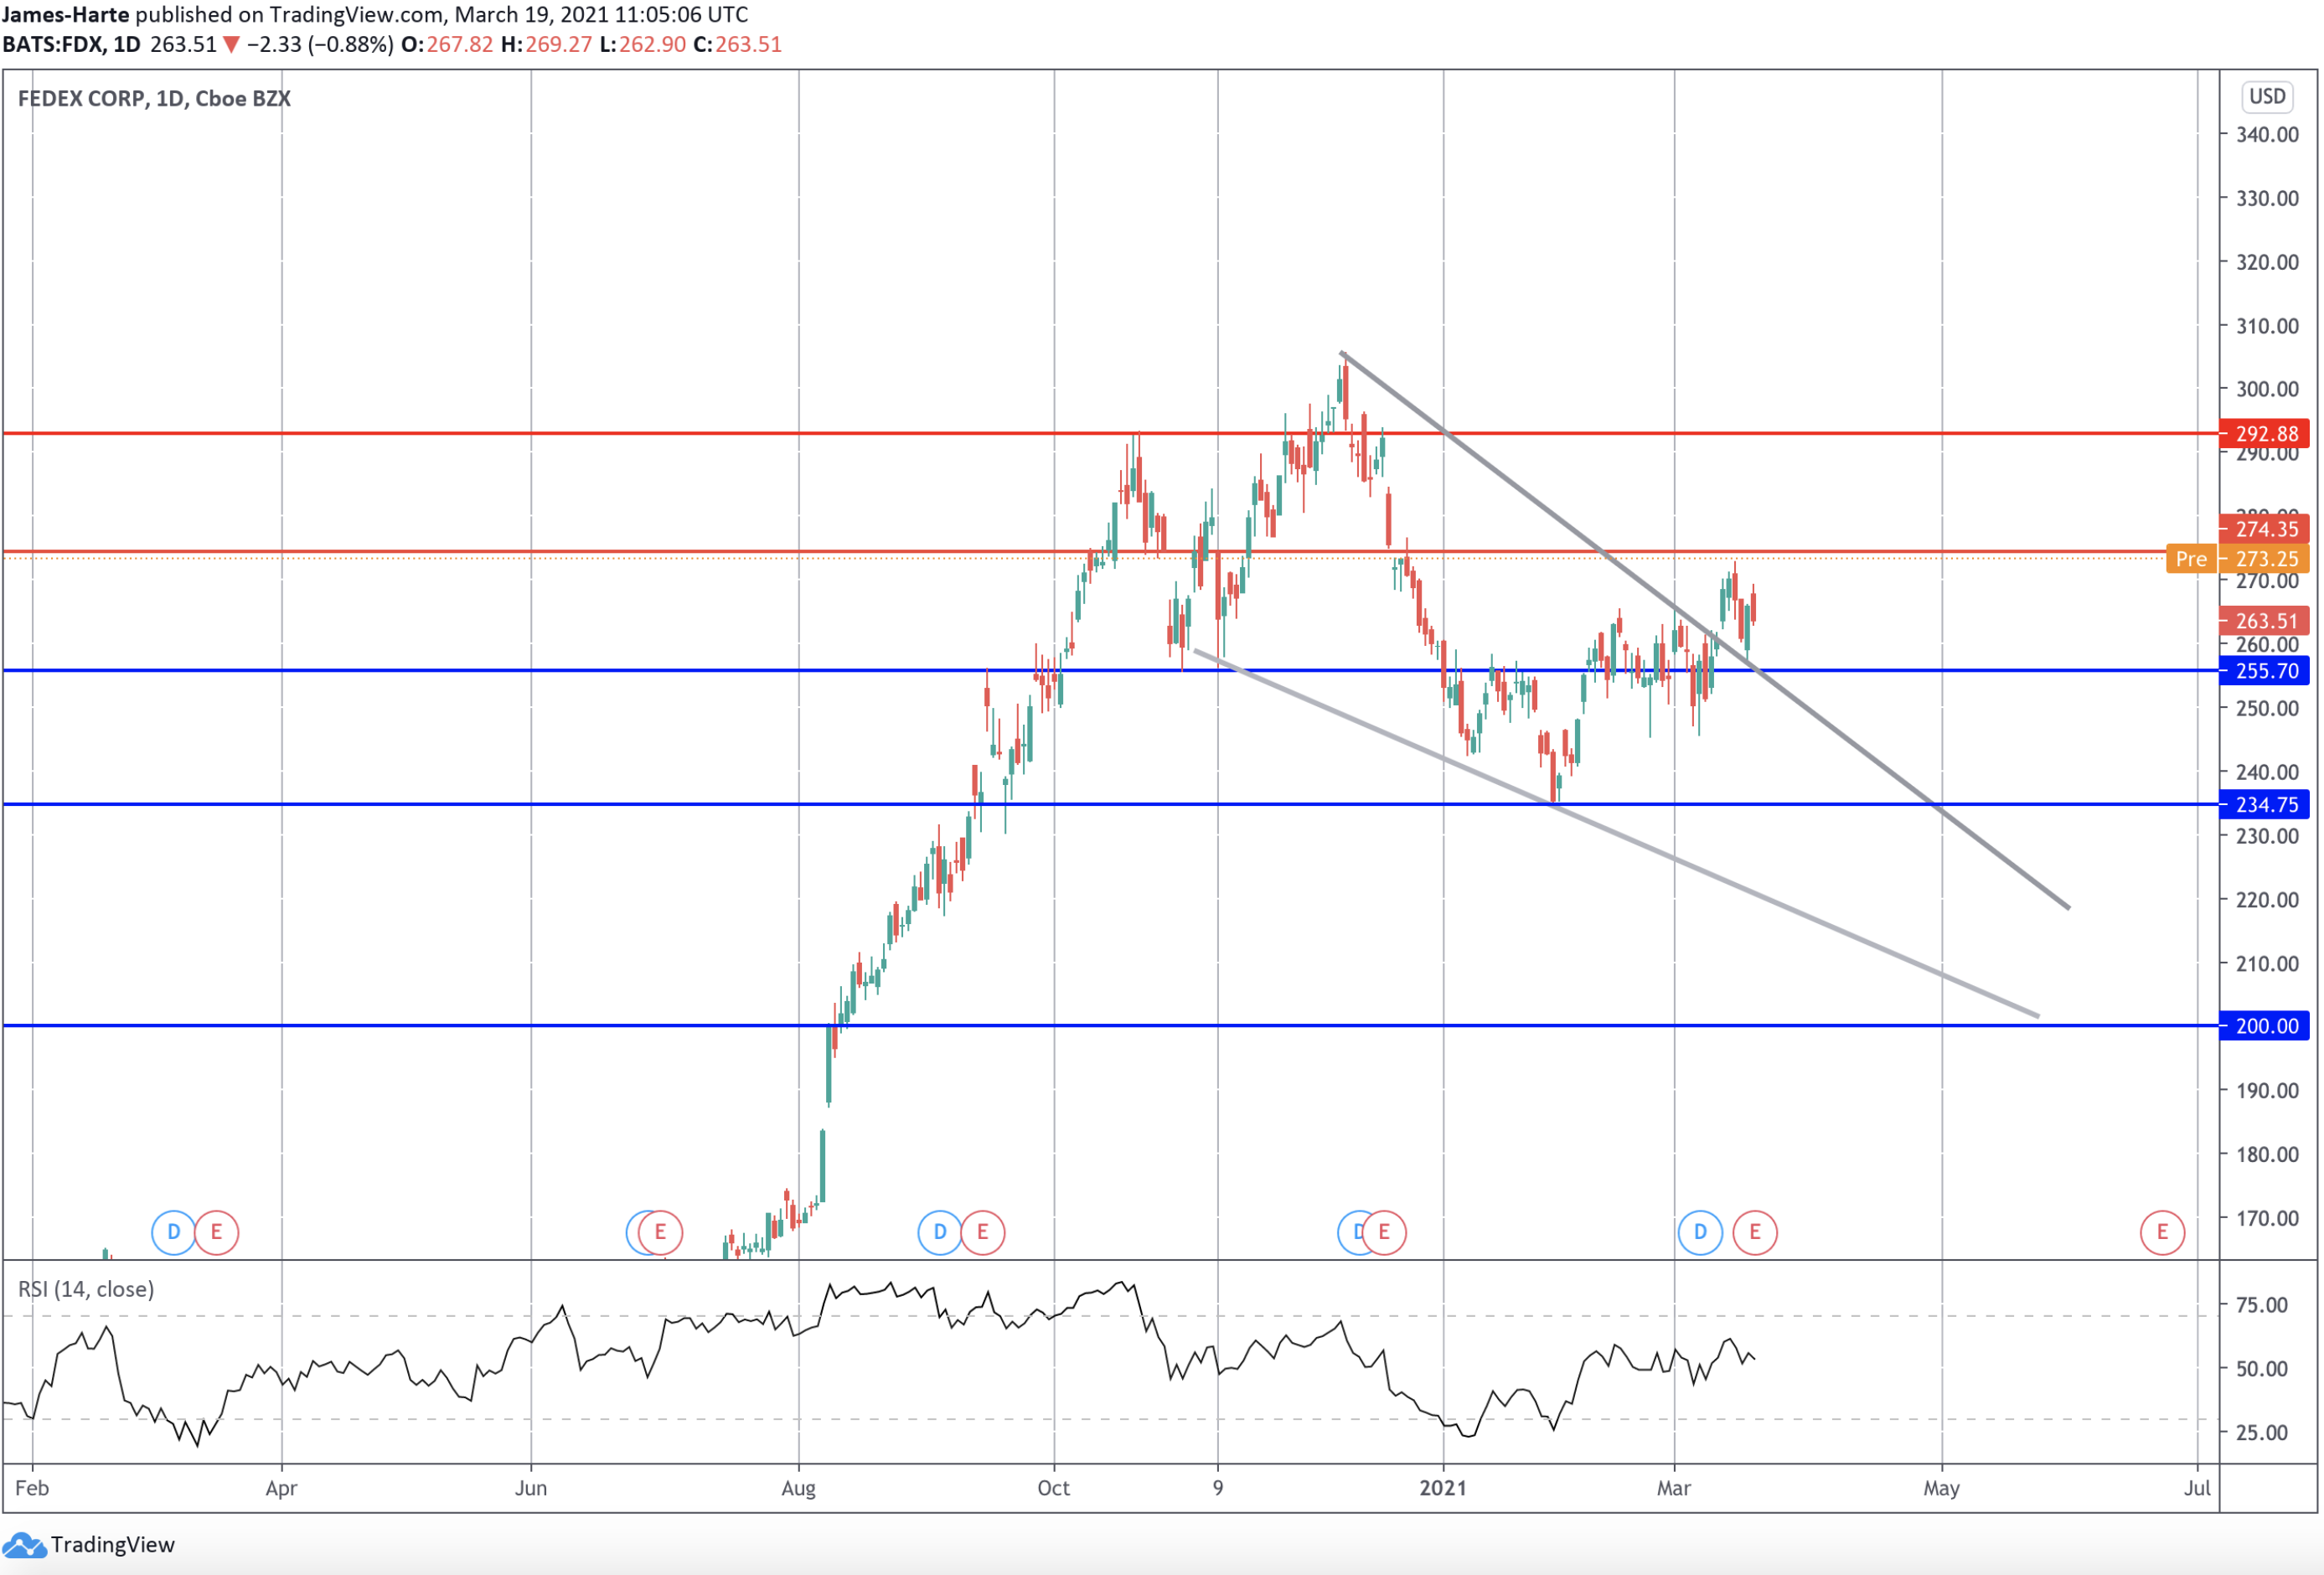
Shares in FedEx are trading a little higher pre-market on Friday with the company’s stock price extending gains on the back of a solid quarterly earnings report. FedEx shares have rallied recently with price making its way back up off the 234.75 lows to highs of around 273 currently.

This week, FedEx reported quarterly earnings per share of $3.47 over Q4 2020. This beat estimates for a $3.30 EPS. Revenues were also higher than expected at $21.51 billion vs $19.97 expected.

Unprecedented Seasonal Demand

FedEx CEO Fred Smith pointed to “unprecedented holiday season demand” as a result of the pandemic.

With social restrictions and lockdowns in place across most of the firm’s key markets, the demand for its services was far higher than usual. Revenues alone were up 23% on the same quarter a year earlier, reflecting just how sharp the increase in demand was.

EPS was up almost double from the same period a year prior, again reflecting the company’s strong performance.

Downside From February Storms Noted

Looking ahead, Smith forecasts:

“demand for our unmatched e-commerce and international express solutions to remain very high for the foreseeable future.”

However, the company did note that extremely bad weather over February in the US impacted operations with several of its key operations centers. This included the FedEx Express hub in Memphis losing operating income in the $350 million region.

The FedEx Express CEO Don Colleran released a statement on March 1st saying:

“As manufacturers obtain approval to ship COVID-19 vaccines with greater temperature ranges and varying dosing allotments, we anticipate more of these packages moving to more places through our global network.”

Split Risks Ahead

In response to the earnings report, FedEx shares jumped 3% in after-hours trading and have since continued higher with price now back up at the recent highs ahead of the open on Friday.

Looking ahead, the risks are broadly split for FedEx. A general improvement in the economy is a supportive factor. However, the return to normal conditions also likely to see a drop in demand for the delivery provider.

FedEx Breaking Out?

fedex shares

FedEx has now broken above the falling wedge pattern which had framed the correction from December highs.

Price is now sitting above the 255.70 level. While that holds as support, the focus is on a continued push higher with a break of the 274.35 level the next objective for bulls.

By Orbex

Oil prices decreased amid new restrictions in Europe. The negotiations between the United States and China show a deep rift

by JustForex

All hopes for better relations between China and the United States were dashed after the first talks began with mutual accusations in Anchorage, Alaska. At the meeting, each side sharply criticized the other for human rights, trade, and international relations. The Center for Strategic and International Studies points out that it is too early to conclude that this meeting is a harbinger of negative events, but it is certainly a rough start, and it shows the full depth of differences between the two countries.

The situation in the negotiations led to sales on Asian stock exchanges. The Shanghai Composite Index decreased by 1% at the beginning of trading, while the CSI 300 decreased by 1.9%. Prior to that, American stock exchanges showed a sharp decline. The Nasdaq 100 decreased by 3.1% and the S&P 500 lost 1.5%.

US Treasury bonds yield stabilized after a sharp rise in treasuries to 1.75% for the first time since January 2020. Oil prices have lost about 10%, partly due to fears of new restrictions in Europe related to the pandemic. Against this background, the US dollar rose.

Investors have begun the preparation for “Black Friday”, as in addition to the negative political background, the expiration of futures contracts and options is there to begin. This may strengthen the bearish mood in the market.

Nevertheless, hedge funds believe that this is only a short-term correction. Tribeca Investment Partners points out that the economic recovery is in full swing, and central banks around the world are supporting it, keeping monetary policy soft. The aggregate fundamental factors suggest that this is only a short-term fixation of profits, and stock market performance remains bullish.

Main market quotes:

S&P 500 (F) 3,919.62 +13.62 (+0.35%)

Dow Jones 32,862.30 -153.07 (-0.46%)

DAX 14,715.25 -60.27 (-0.41%)

FTSE 100 6,710.79 -68.89 (-1.02%)

USD Index 91.690 -0.180 (-0.20%)

Important events:
  • – Australia Retail Sales (m/m) at 02:30 (GMT+2);
  • – BoJ Press Conference at 04:30 (GMT+2);
  • – Canada Core Retail Sales (m/m) (Jan.) at 15:30 (GMT+2).

by JustForex


This article reflects a personal opinion and should not be interpreted as an investment advice, and/or offer, and/or a persistent request for carrying out financial transactions, and/or a guarantee, and/or a forecast of future events.