
By CountingPips.com – Receive our weekly COT Reports by Email
Here are the latest charts and statistics for the Commitment of Traders (COT) data published by the Commodities Futures Trading Commission (CFTC).
The latest COT data is updated through Tuesday March 16 2021 and shows a quick view of how large traders (for-profit speculators and commercial entities) were positioned in the futures markets.
CORN:
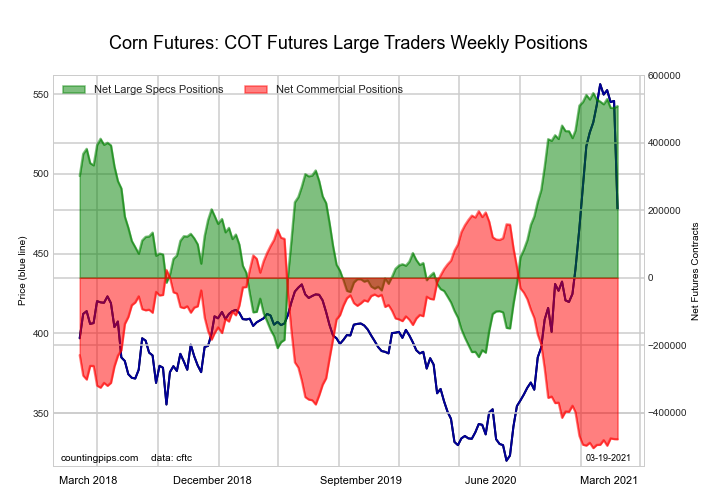
| CORN Futures Statistics | SPECULATORS | COMMERCIALS | SMALL TRADERS |
| – Percent of Open Interest Longs: | 32.6 | 46.8 | 8.3 |
| – Percent of Open Interest Shorts: | 4.1 | 73.6 | 10.0 |
| – Net Position: | 509,084 | -478,665 | -30,419 |
| – Gross Longs: | 583,279 | 838,502 | 149,310 |
| – Gross Shorts: | 74,195 | 1,317,167 | 179,729 |
| – Long to Short Ratio: | 7.9 to 1 | 0.6 to 1 | 0.8 to 1 |
| NET POSITION TREND: | |||
| – COT Index Score (3 Year Range Pct): | 95.1 | 3.8 | 30.1 |
| – COT Index Reading (3 Year Range): | Bullish-Extreme | Bearish-Extreme | Bearish |
| NET POSITION MOVEMENT INDEX: | |||
| – 6-Week Change in Strength Index: | -2.5 | 2.4 | 1.4 |
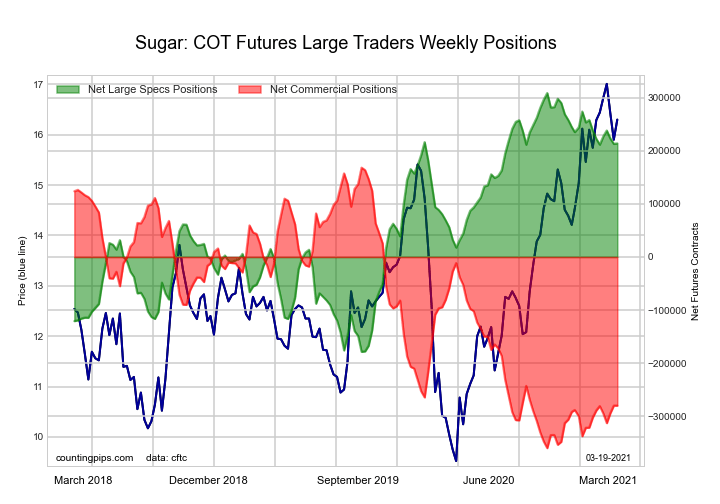
SUGAR:
Free Reports:
 Download Our Metatrader 4 Indicators – Put Our Free MetaTrader 4 Custom Indicators on your charts when you join our Weekly Newsletter
 Get our Weekly Commitment of Traders Reports - See where the biggest traders (Hedge Funds and Commercial Hedgers) are positioned in the futures markets on a weekly basis.
| SUGAR Futures Statistics | SPECULATORS | COMMERCIALS | SMALL TRADERS |
| – Percent of Open Interest Longs: | 26.1 | 49.6 | 10.2 |
| – Percent of Open Interest Shorts: | 5.7 | 76.2 | 3.9 |
| – Net Position: | 213,767 | -279,633 | 65,866 |
| – Gross Longs: | 273,487 | 519,254 | 106,364 |
| – Gross Shorts: | 59,720 | 798,887 | 40,498 |
| – Long to Short Ratio: | 4.6 to 1 | 0.6 to 1 | 2.6 to 1 |
| NET POSITION TREND: | |||
| – COT Index Score (3 Year Range Pct): | 80.5 | 15.1 | 89.4 |
| – COT Index Reading (3 Year Range): | Bullish-Extreme | Bearish-Extreme | Bullish-Extreme |
| NET POSITION MOVEMENT INDEX: | |||
| – 6-Week Change in Strength Index: | -1.8 | 1.8 | -0.7 |
COFFEE:
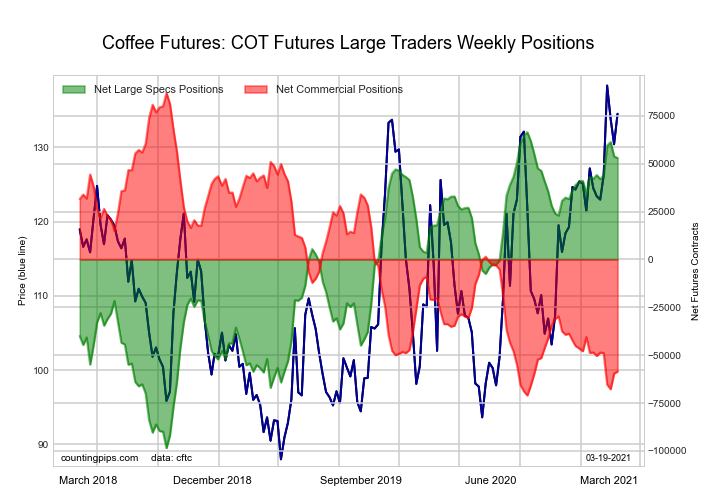
| COFFEE Futures Statistics | SPECULATORS | COMMERCIALS | SMALL TRADERS |
| – Percent of Open Interest Longs: | 27.0 | 45.0 | 4.1 |
| – Percent of Open Interest Shorts: | 8.0 | 65.9 | 2.1 |
| – Net Position: | 52,943 | -58,502 | 5,559 |
| – Gross Longs: | 75,413 | 125,745 | 11,530 |
| – Gross Shorts: | 22,470 | 184,247 | 5,971 |
| – Long to Short Ratio: | 3.4 to 1 | 0.7 to 1 | 1.9 to 1 |
| NET POSITION TREND: | |||
| – COT Index Score (3 Year Range Pct): | 91.9 | 7.9 | 26.8 |
| – COT Index Reading (3 Year Range): | Bullish-Extreme | Bearish-Extreme | Bearish |
| NET POSITION MOVEMENT INDEX: | |||
| – 6-Week Change in Strength Index: | 5.4 | -5.2 | -5.1 |
SOYBEANS:
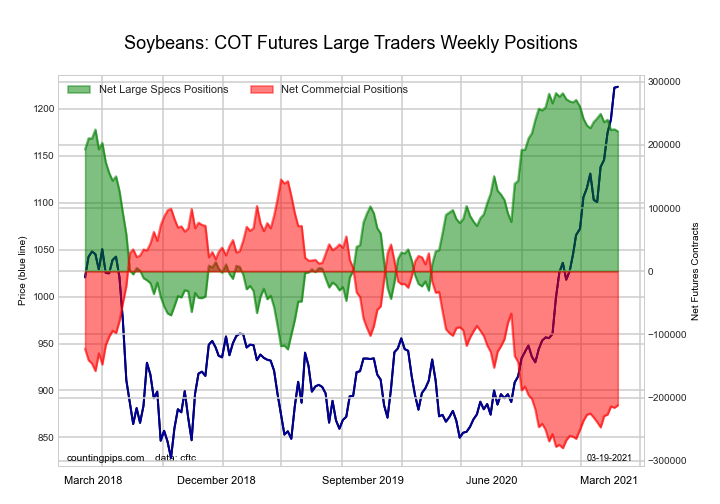
| SOYBEANS Futures Statistics | SPECULATORS | COMMERCIALS | SMALL TRADERS |
| – Percent of Open Interest Longs: | 31.0 | 45.7 | 7.9 |
| – Percent of Open Interest Shorts: | 5.1 | 70.5 | 9.0 |
| – Net Position: | 221,531 | -212,051 | -9,480 |
| – Gross Longs: | 265,531 | 391,676 | 67,451 |
| – Gross Shorts: | 44,000 | 603,727 | 76,931 |
| – Long to Short Ratio: | 6.0 to 1 | 0.6 to 1 | 0.9 to 1 |
| NET POSITION TREND: | |||
| – COT Index Score (3 Year Range Pct): | 85.1 | 15.9 | 69.7 |
| – COT Index Reading (3 Year Range): | Bullish-Extreme | Bearish-Extreme | Bullish |
| NET POSITION MOVEMENT INDEX: | |||
| – 6-Week Change in Strength Index: | -5.1 | 6.3 | -6.7 |
SOYBEAN OIL:
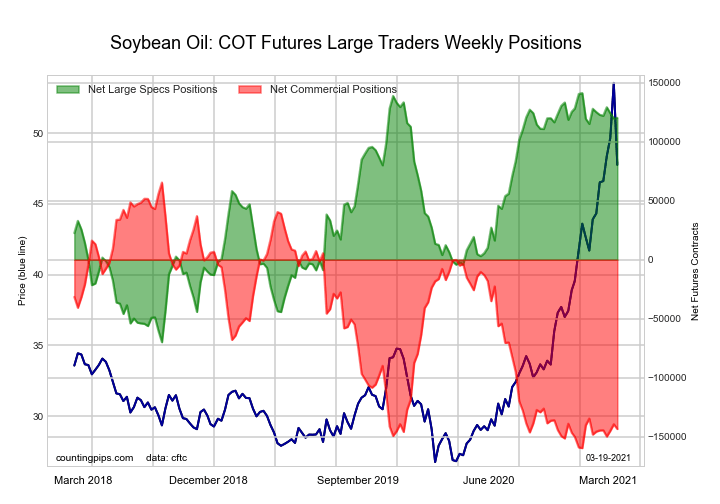
| SOYBEAN OIL Futures Statistics | SPECULATORS | COMMERCIALS | SMALL TRADERS |
| – Percent of Open Interest Longs: | 30.8 | 41.6 | 10.0 |
| – Percent of Open Interest Shorts: | 6.6 | 70.5 | 5.3 |
| – Net Position: | 120,152 | -143,351 | 23,199 |
| – Gross Longs: | 152,943 | 206,802 | 49,602 |
| – Gross Shorts: | 32,791 | 350,153 | 26,403 |
| – Long to Short Ratio: | 4.7 to 1 | 0.6 to 1 | 1.9 to 1 |
| NET POSITION TREND: | |||
| – COT Index Score (3 Year Range Pct): | 90.0 | 7.2 | 100.0 |
| – COT Index Reading (3 Year Range): | Bullish-Extreme | Bearish-Extreme | Bullish-Extreme |
| NET POSITION MOVEMENT INDEX: | |||
| – 6-Week Change in Strength Index: | -2.3 | 1.0 | 9.8 |
SOYBEAN MEAL:
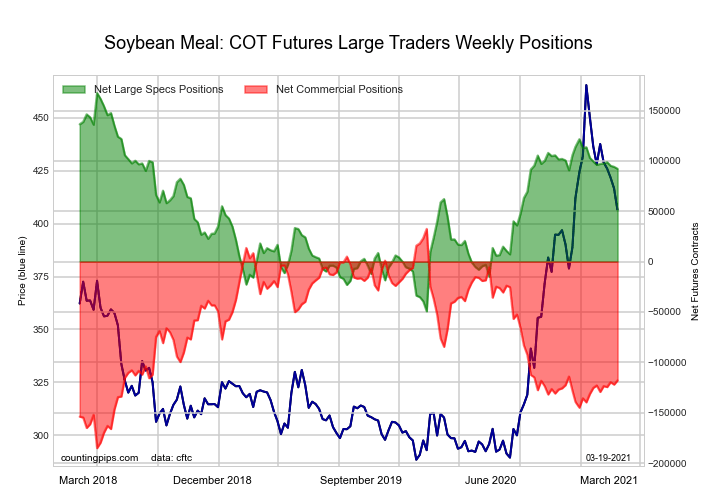
| SOYBEAN MEAL Futures Statistics | SPECULATORS | COMMERCIALS | SMALL TRADERS |
| – Percent of Open Interest Longs: | 26.1 | 48.4 | 12.8 |
| – Percent of Open Interest Shorts: | 3.8 | 76.9 | 6.6 |
| – Net Position: | 92,181 | -117,934 | 25,753 |
| – Gross Longs: | 107,983 | 200,737 | 52,925 |
| – Gross Shorts: | 15,802 | 318,671 | 27,172 |
| – Long to Short Ratio: | 6.8 to 1 | 0.6 to 1 | 1.9 to 1 |
| NET POSITION TREND: | |||
| – COT Index Score (3 Year Range Pct): | 65.3 | 30.9 | 73.8 |
| – COT Index Reading (3 Year Range): | Bullish | Bearish | Bullish |
| NET POSITION MOVEMENT INDEX: | |||
| – 6-Week Change in Strength Index: | -1.9 | 2.3 | -3.9 |
LIVE CATTLE:
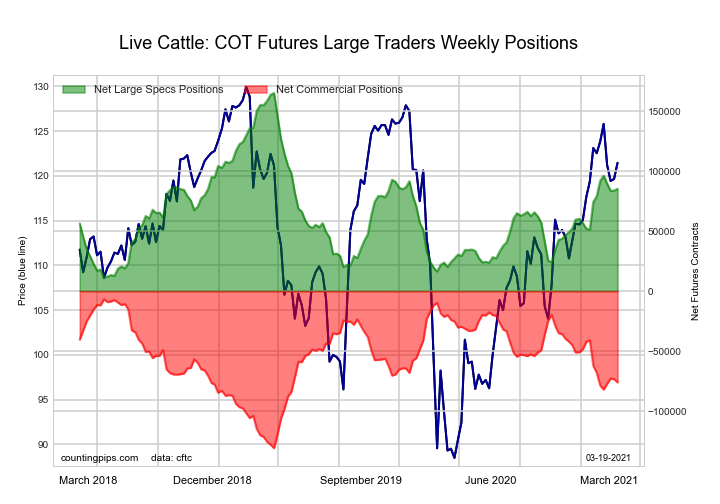
| LIVE CATTLE Futures Statistics | SPECULATORS | COMMERCIALS | SMALL TRADERS |
| – Percent of Open Interest Longs: | 36.2 | 35.9 | 10.0 |
| – Percent of Open Interest Shorts: | 11.1 | 58.3 | 12.7 |
| – Net Position: | 85,285 | -76,008 | -9,277 |
| – Gross Longs: | 123,037 | 121,864 | 33,844 |
| – Gross Shorts: | 37,752 | 197,872 | 43,121 |
| – Long to Short Ratio: | 3.3 to 1 | 0.6 to 1 | 0.8 to 1 |
| NET POSITION TREND: | |||
| – COT Index Score (3 Year Range Pct): | 48.1 | 44.2 | 64.5 |
| – COT Index Reading (3 Year Range): | Bearish | Bearish | Bullish |
| NET POSITION MOVEMENT INDEX: | |||
| – 6-Week Change in Strength Index: | 4.0 | -6.4 | 4.4 |
LEAN HOGS:
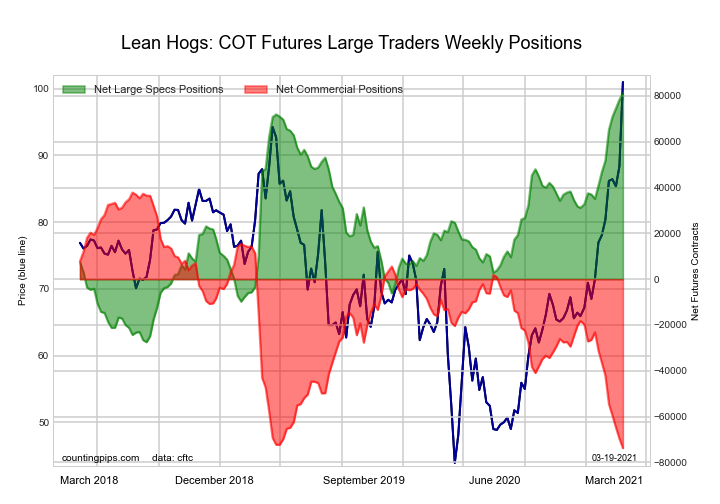
| LEAN HOGS Futures Statistics | SPECULATORS | COMMERCIALS | SMALL TRADERS |
| – Percent of Open Interest Longs: | 42.6 | 30.8 | 9.1 |
| – Percent of Open Interest Shorts: | 12.6 | 57.9 | 11.9 |
| – Net Position: | 81,267 | -73,742 | -7,525 |
| – Gross Longs: | 115,538 | 83,469 | 24,637 |
| – Gross Shorts: | 34,271 | 157,211 | 32,162 |
| – Long to Short Ratio: | 3.4 to 1 | 0.5 to 1 | 0.8 to 1 |
| NET POSITION TREND: | |||
| – COT Index Score (3 Year Range Pct): | 100.0 | 0.0 | 42.0 |
| – COT Index Reading (3 Year Range): | Bullish-Extreme | Bearish-Extreme | Bearish |
| NET POSITION MOVEMENT INDEX: | |||
| – 6-Week Change in Strength Index: | 31.6 | -33.4 | 13.3 |
COTTON:
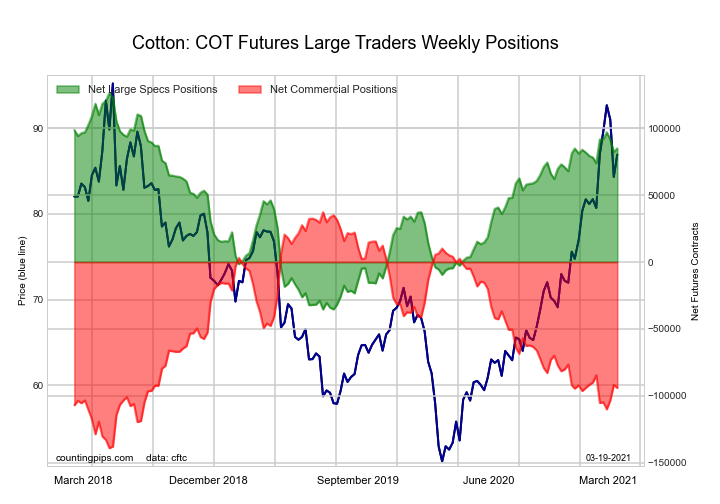
| COTTON Futures Statistics | SPECULATORS | COMMERCIALS | SMALL TRADERS |
| – Percent of Open Interest Longs: | 40.2 | 41.1 | 7.1 |
| – Percent of Open Interest Shorts: | 3.6 | 81.6 | 3.1 |
| – Net Position: | 84,949 | -94,117 | 9,168 |
| – Gross Longs: | 93,354 | 95,370 | 16,432 |
| – Gross Shorts: | 8,405 | 189,487 | 7,264 |
| – Long to Short Ratio: | 11.1 to 1 | 0.5 to 1 | 2.3 to 1 |
| NET POSITION TREND: | |||
| – COT Index Score (3 Year Range Pct): | 74.4 | 25.5 | 66.1 |
| – COT Index Reading (3 Year Range): | Bullish | Bearish | Bullish |
| NET POSITION MOVEMENT INDEX: | |||
| – 6-Week Change in Strength Index: | 6.8 | -5.4 | -9.1 |
COCOA:
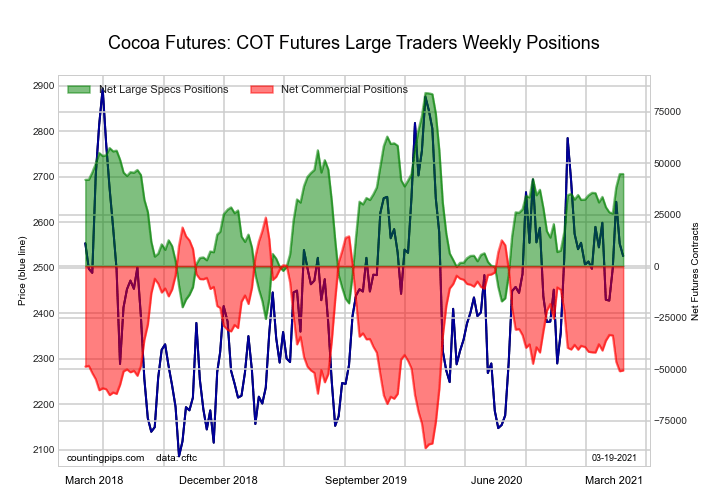
| COCOA Futures Statistics | SPECULATORS | COMMERCIALS | SMALL TRADERS |
| – Percent of Open Interest Longs: | 37.1 | 37.4 | 5.6 |
| – Percent of Open Interest Shorts: | 15.1 | 62.3 | 2.8 |
| – Net Position: | 44,756 | -50,579 | 5,823 |
| – Gross Longs: | 75,411 | 76,055 | 11,434 |
| – Gross Shorts: | 30,655 | 126,634 | 5,611 |
| – Long to Short Ratio: | 2.5 to 1 | 0.6 to 1 | 2.0 to 1 |
| NET POSITION TREND: | |||
| – COT Index Score (3 Year Range Pct): | 64.1 | 33.7 | 74.7 |
| – COT Index Reading (3 Year Range): | Bullish | Bearish | Bullish |
| NET POSITION MOVEMENT INDEX: | |||
| – 6-Week Change in Strength Index: | 10.1 | -8.7 | -16.2 |
WHEAT:
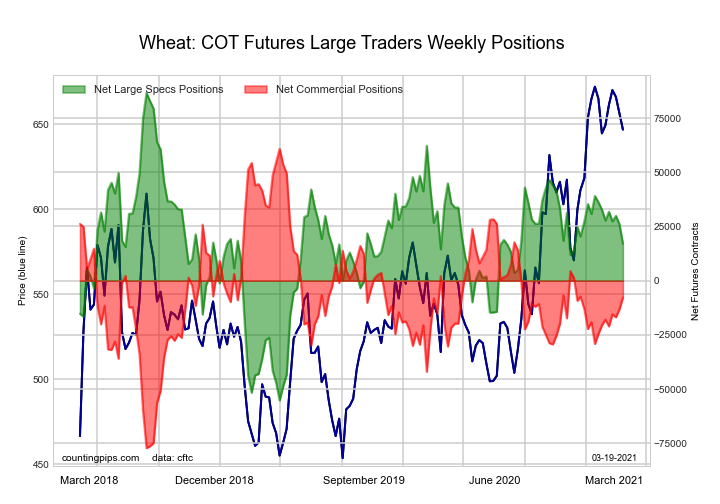
| WHEAT Futures Statistics | SPECULATORS | COMMERCIALS | SMALL TRADERS |
| – Percent of Open Interest Longs: | 28.2 | 37.7 | 8.0 |
| – Percent of Open Interest Shorts: | 24.1 | 39.6 | 10.2 |
| – Net Position: | 17,056 | -7,681 | -9,375 |
| – Gross Longs: | 118,153 | 158,201 | 33,353 |
| – Gross Shorts: | 101,097 | 165,882 | 42,728 |
| – Long to Short Ratio: | 1.2 to 1 | 1.0 to 1 | 0.8 to 1 |
| NET POSITION TREND: | |||
| – COT Index Score (3 Year Range Pct): | 51.0 | 50.4 | 56.8 |
| – COT Index Reading (3 Year Range): | Bullish | Bullish | Bullish |
| NET POSITION MOVEMENT INDEX: | |||
| – 6-Week Change in Strength Index: | -11.1 | 9.3 | 13.8 |
Article By CountingPips.com – Receive our weekly COT Reports by Email
*COT Report: The COT data, released weekly to the public each Friday, is updated through the most recent Tuesday (data is 3 days old) and shows a quick view of how large speculators or non-commercials (for-profit traders) were positioned in the futures markets.
The CFTC categorizes trader positions according to commercial hedgers (traders who use futures contracts for hedging as part of the business), non-commercials (large traders who speculate to realize trading profits) and nonreportable traders (usually small traders/speculators).
Find CFTC criteria here: (http://www.cftc.gov/MarketReports/CommitmentsofTraders/ExplanatoryNotes/index.htm).

- COT Metals Charts: Weekly Speculator Changes led by Copper Jul 26, 2026
- COT Bonds Charts: Speculator Bets led by SOFR 3-Months & 5-Year Bonds Jul 26, 2026
- COT Energy Charts: Weekly Speculator Bets led by WTI Crude & Natural Gas Jul 26, 2026
- COT Soft Commodities Charts: Weekly Speculator Bets led by Corn & Soybeans Jul 26, 2026
- The US introduces new import tariffs for 60 countries. Brent crude surpasses $100 per barrel Jul 24, 2026
- USD/JPY Breaks Records: Nothing Slows the Yen’s Decline Jul 24, 2026
- Oil prices reached a 6‑week high. The AUD strengthened on the back of a strong labor‑market report Jul 23, 2026
- EUR/USD Recovers as Dollar Weakens Jul 23, 2026
- Bitcoin rose to $66,000. The New Zealand dollar continues to strengthen Jul 22, 2026
- Inflationary pressure is easing in Canada. In New Zealand, on the contrary, inflation is rising Jul 21, 2026