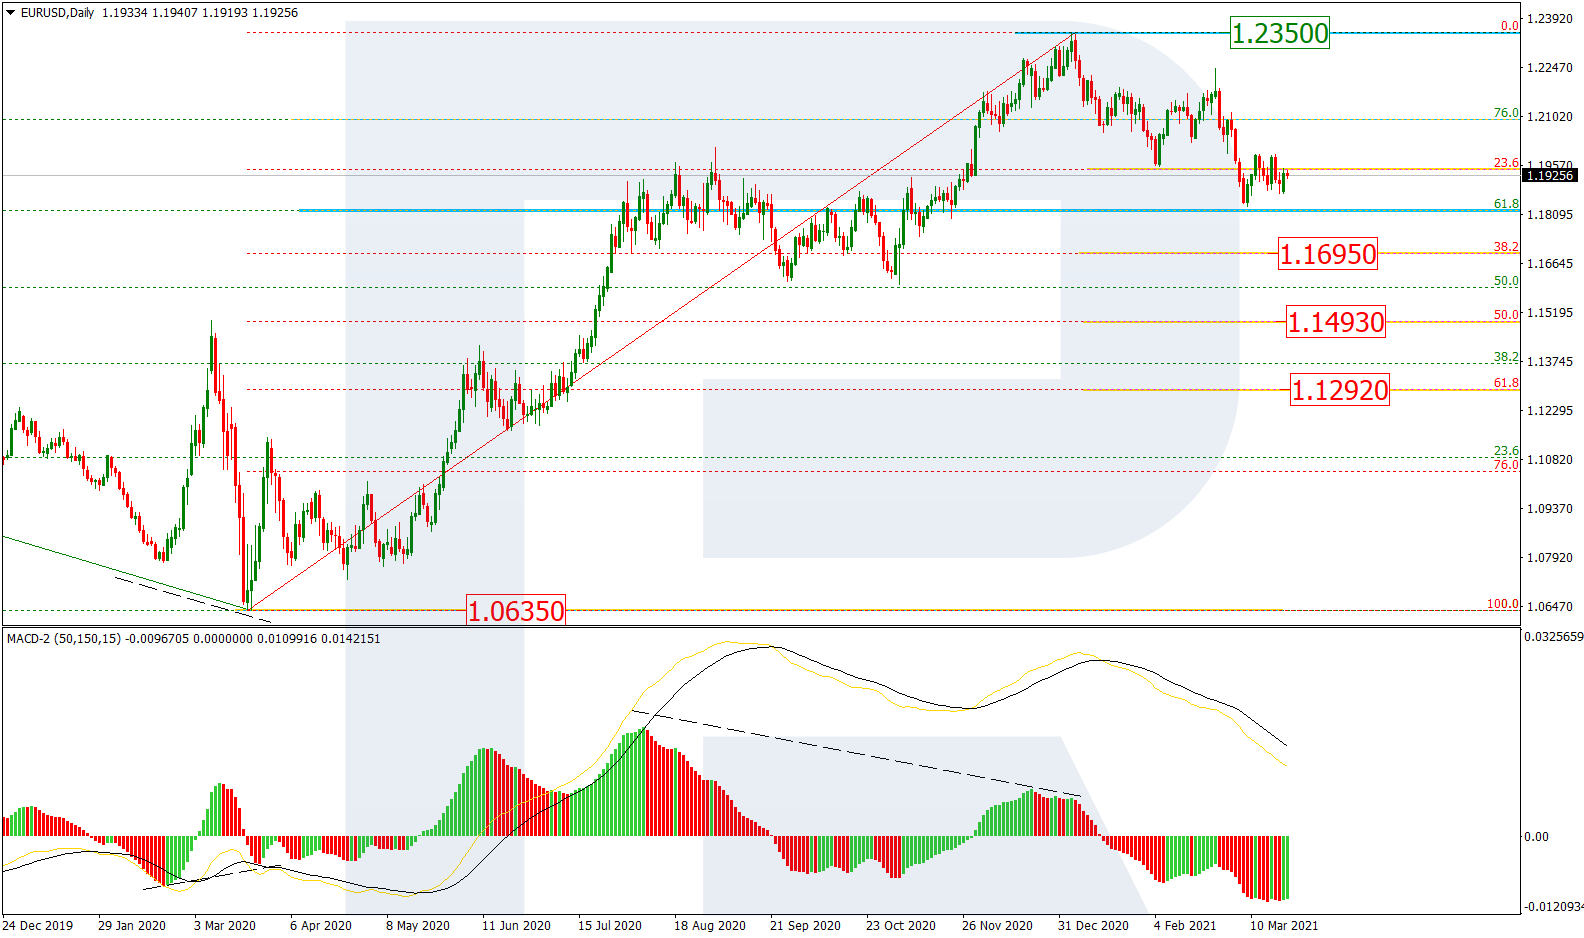
As we can see in the daily chart, the asset continues the “bearish” phase after a divergence on MACD. After falling and reaching 23.6% fibo, the pair has started consolidating but may soon resume falling towards 38.2%, 50.0%, and 61.8% fibo at 1.1695, 1.1493, and 1.1292 respectively. The key resistance remains at the high at 1.2350.
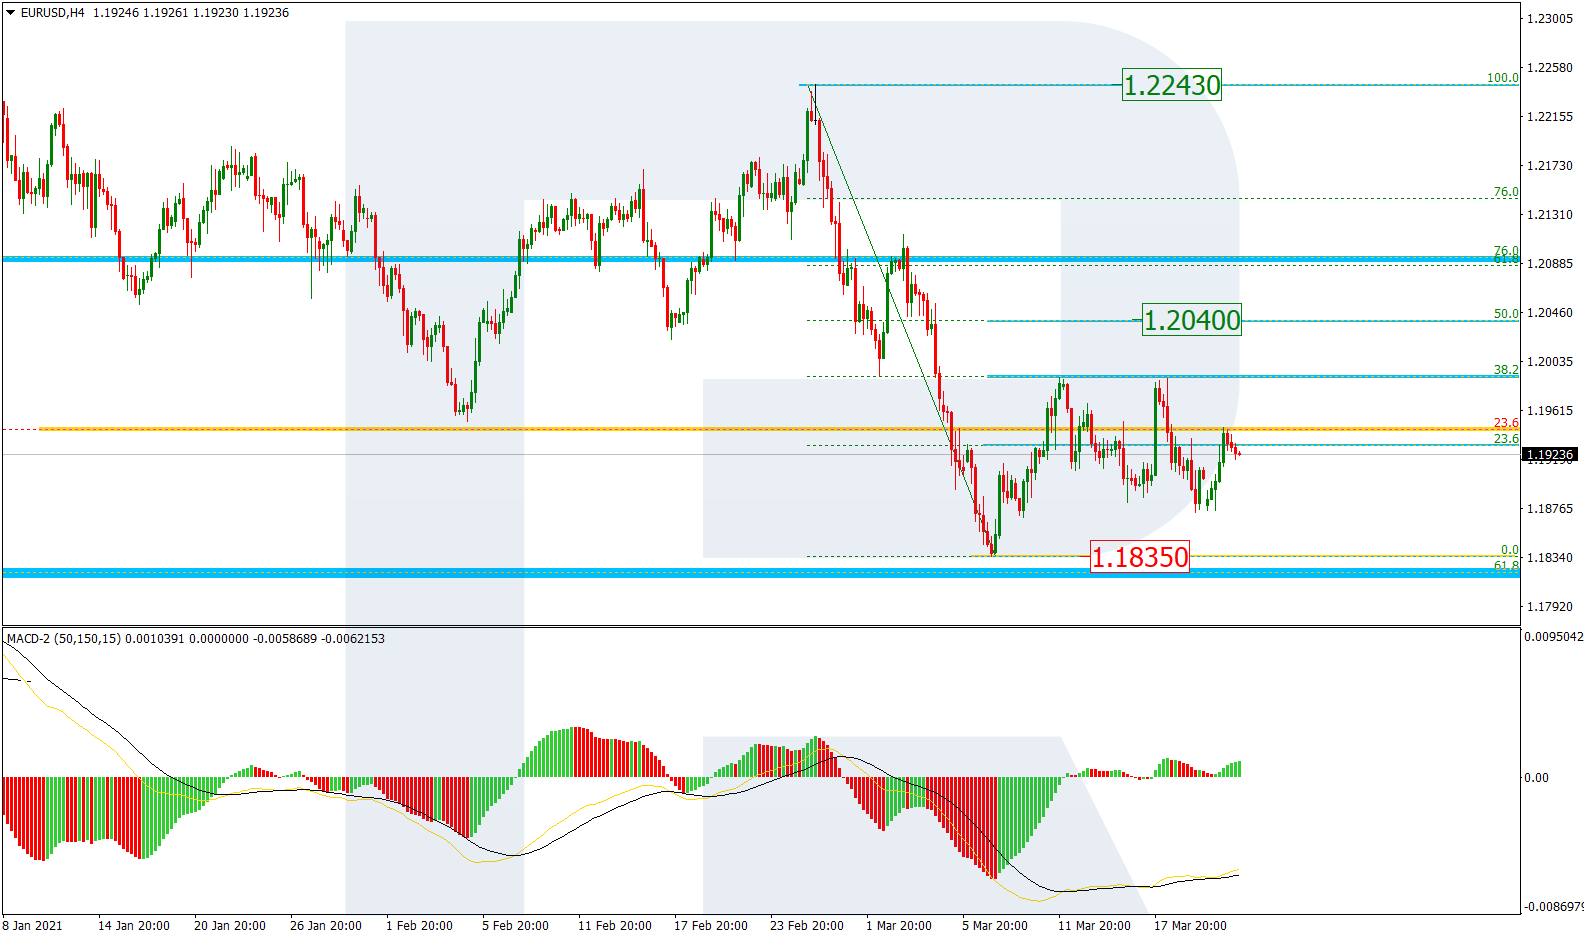
The H4 chart shows a more detailed structure of the current short-term correction after the previous descending impulse, which has already tested 38.2% fibo twice and may yet continue towards 50.0% fibo at 1.2040. After finishing the correction, the asset may resume falling to reach and break the low at 1.1835. Later, the asset may continue its decline towards the mid-term targets. The key resistance is the fractal high at 1.2243.
USDJPY, “US Dollar vs. Japanese Yen”
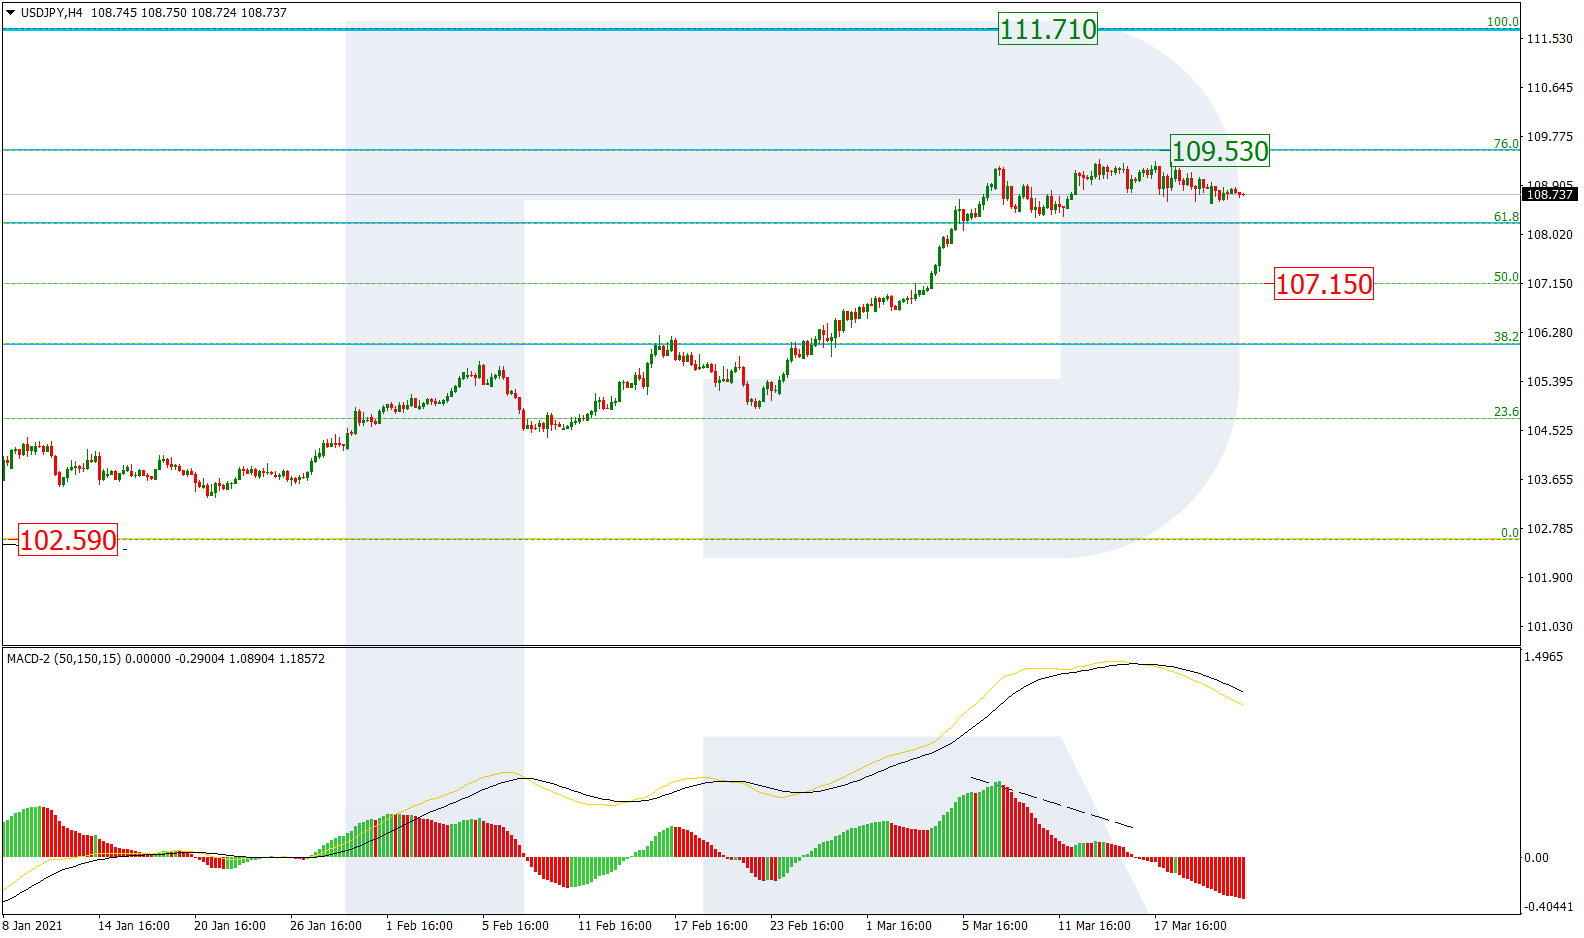
The H4 chart shows a slow descending correction after a divergence on MACD. At the same time, one should note that after breaking 61.8% fibo, the previous uptrend has failed to reach 76.0% fibo at 109.53. The long-term upside target is the fractal high at 111.71. The key correctional target right now is the support at 50.0% fibo at 107.15.
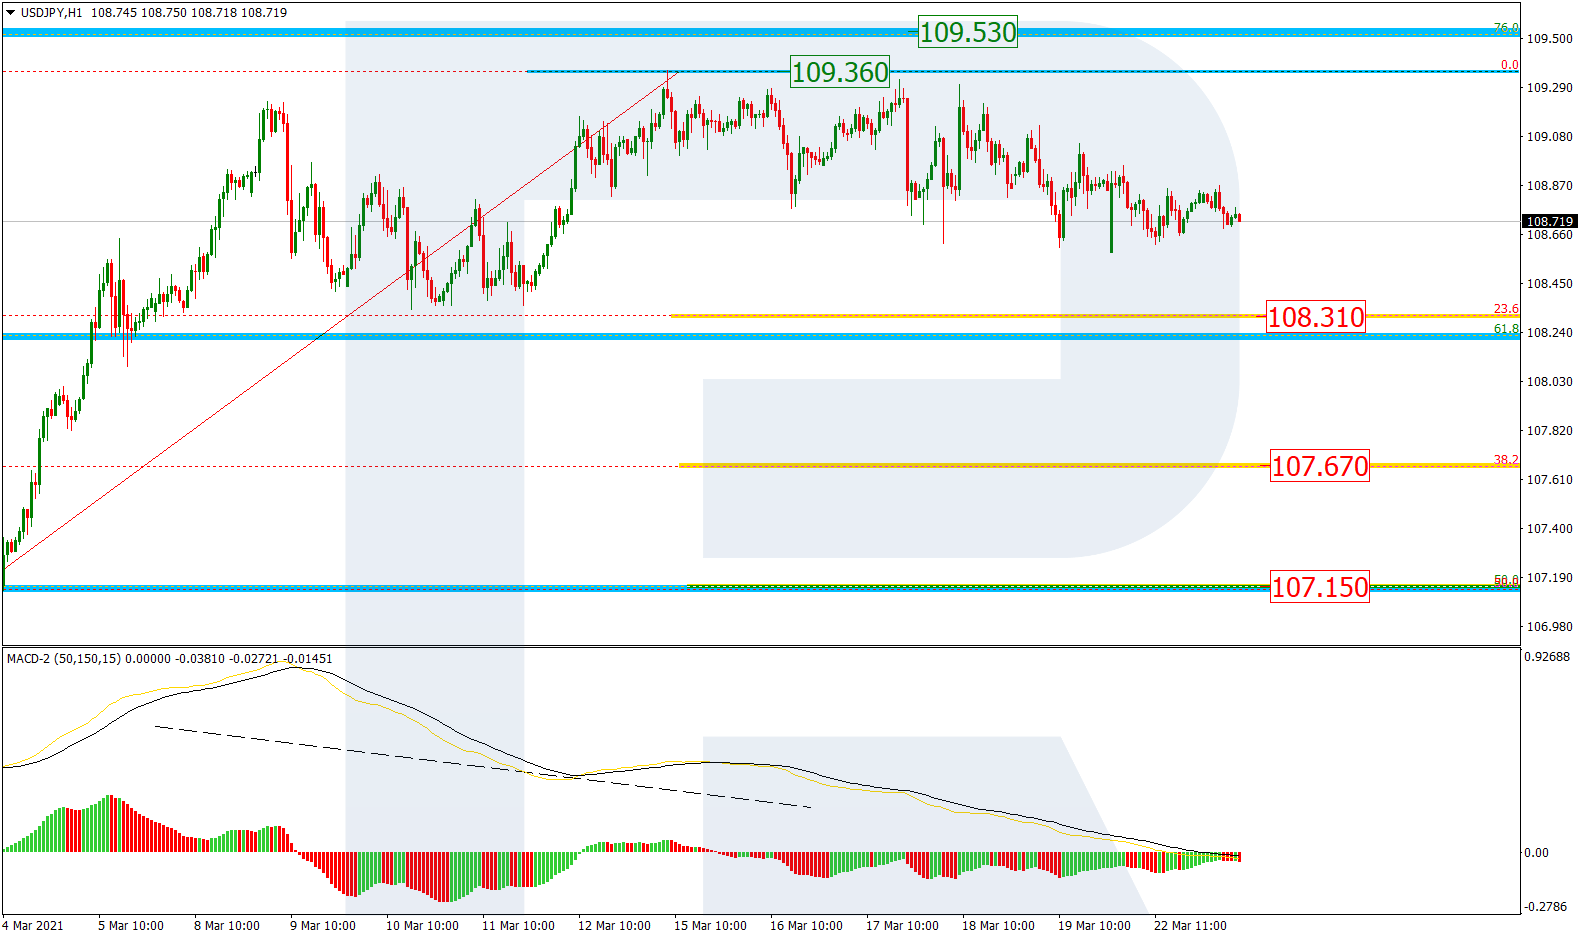
In the H1 chart, USDJPY is correcting to the downside and may reach 23.6, 38.2%, and 50.0% fibo at 108.31, 107.67, and 107.15 respectively. A breakout of the current high at 109.36 may complete the correction.
Attention! Forecasts presented in this section only reflect the author’s private opinion and should not be considered as guidance for trading. RoboForex LP bears no responsibility for trading results based on trading recommendations described in these analytical reviews.
On Friday, the euro rose slightly. The pair continues to trade in a narrow range, showing no signs of exiting it. No important economic events are expected. Jerome Powell will address Congress with a report on monetary policy. The market expects no changes in it.
Trading recommendations
Support levels: 1.1882, 1.1834
Resistance levels: 1.1990, 1.2113
The main scenario for EUR/USD is trading in the lateral range between 1.1882 and 1.1990. The ADX is at a minimum, which indicates no pressure in either direction. Only the position of the MACD and moving averages indicates a slight increase. But growth may be limited by the first resistance level.
Alternative scenario: if the price manages to consolidate below the level of 1.1882, the pair may return to the decline to 1.1834. A breakout of 1.1990 could send the pair towards 1.2113.
News feed for 2021.03.23:
– Federal Reserve Chairman Jerome Powell’s Speech at 16:00 (GMT+2);
– The US New Home Sales (Feb) at 16:00 (GMT+2);
– FOMC Member Lael Brainard’s Speech at 16:00 (GMT+2).
The GBP/USD currency pair
Technical indicators of the currency pair:
Prev Open: 1.3834
Prev Close: 1.3856
% chg. over the last day: +0,16%
The volatility in the sterling has dropped significantly. The pair is trading near the moving averages on the daily chart. These are important levels where the issue of further growth or the beginning of a deep correction is decided. Important data on wages in the UK is planned for today, but it is unlikely to cause strong movements.
Trading recommendations
Support levels: 1.3775, 1.3680
Resistance levels: 1.3875, 1.3997
The main scenario for GBP/USD is selling. The bearish direction remains a priority in the short term as the ADX begins to show signs of increasing bearish strength. The support level was broken, and the price firmly consolidated below.
Alternative scenario: if the pair consolidates above 1.3895, the pair may resume growth to 1.3997.
News feed for 2021.03.23:
– Average Salary Including bonuses in the UK (Jan) at 09:00 (GMT+2);
– The UK Jobless Claims (Feb) at 09:00 (GMT+2);
– The UK industrial Orders Index (CBI) (Mar) at 13:00 (GMT+2).
The USD/JPY currency pair
Technical indicators of the currency pair:
Prev Open: 108.62
Prev Close: 108.83
% chg. over the last day: +0,11%
In the dollar-yen pair, volatility has been declining for the sixth session in a row. Stock markets were up slightly on Monday. But they have been declining in the Asian session on Tuesday. Bond yields have stabilized. Treasuries are in the area of 1.68%.
Trading recommendations
Support levels: 108.35, 107.08
Resistance levels: 109.34, 109.86
The main scenario is trading in a sideways range between 109.34 and 108.35. The ADX on the hourly timeframe fell to the minimum values. The MACD is near zero, and the price is near the moving averages. The instrument has lost all signs of correction.
An alternative scenario implies the price-fixing below 108.35. In this case, the pair may return to the decline to 107.08. A breakout of 109.34 will resume growth.
News feed for 2021.03.23:
– Federal Reserve Chairman Jerome Powell’s Speech at 16:00 (GMT+2);
– The US New Home Sales (Feb) at 16:00 (GMT+2);
– FOMC Member Lael Brainard’s Speech at 16:00 (GMT+2).
The USD/CAD currency pair
Technical indicators of the currency pair:
Prev Open: 1.2518
Prev Close: 1.2520
% chg. over the last day: +0.02%
The Canadian dollar will continue its correctional growth in light of the continuing decline in oil prices. The outlook for commodity markets remains negative in the medium term, as European countries such as Germany and France are expanding quarantine measures.
Trading recommendations
Support levels: 1.2446, 1.2364
Resistance levels: 1.2546, 1.2589
The main scenario is buying. The slight northern impulse on Tuesday triggered a strong ADX reaction. This is a sign that the price may break the first resistance level. The MACD is above zero, and the price is above the moving averages. By a combination of factors, there is an increasing northern signal.
Alternative scenario: if the price manages to gain a foothold below 1.2477, the pair may resume its southern movement.
This article reflects a personal opinion and should not be interpreted as an investment advice, and/or offer, and/or a persistent request for carrying out financial transactions, and/or a guarantee, and/or a forecast of future events.
On Monday, share prices rose slightly amid stabilization of government bonds yield. US Treasuries retreated from the 1.70% level and are 2 basis points lower. Today, the attention of investors will be fixed on the joint speech of Janet Yellen and Jerome Powell in the US Congress. As expected, politicians will express their previous opinion on the need to support the economy by maintaining a soft monetary policy.
This morning, the Office for National Statistics reported that UK unemployment rose less-than-expected during the quarantine as the government’s dismissal program saved workplaces. The number of people looking for job opportunities rose from 11,000 to 1.7 million, bringing the unemployment rate to 5%. Economists had expected the rate to be 5.2%. The number of employed people decreased by 147 000 people.
The forecast for the growth of unemployment has changed. The fourth-quarter unemployment rate is now expected to be 6.5%, but not 7.5% as it was specified in the November forecast. This is also well below the peak of recessions in previous decades, despite the fact that the economy experienced its deepest recession in three centuries last year.
Meanwhile, new restrictions are being introduced in Germany. Chancellor Angela Merkel and regional leaders have agreed to introduce a new lockdown during Easter celebrations to try to counter the third wave of Covid-19.
According to the plan, all stores will be closed from April 1 for five days, with the exception of grocery stores, which will open on April 3. Citizens will be encouraged to stay at home, private gatherings are limited to one household and a maximum of five people. Public gatherings are prohibited.
Against this background, oil prices continue to remain under pressure, losing just over 1% at the opening of trading in the Asian session. S P 500 futures decreased after a slight increase on Monday.
Main market quotes:
S&P 500 (F) 3,921.38 -8.62 (-0,22%)
Dow Jones 32,731.20 +103.23 (+0,32%)
DAX 14,657.21 +36.21 (+0,25%)
FTSE 100 6,726.10 +17.39 (+0,26%)
USD Index 91.983 +0.242 (+0,26%)
Important events:
– UK Average Salary Level including bonuses (Jan) at 09:00 (GMT+2);
– United Kingdom Claimant Count Change (Feb) at 09:00 (GMT+2);
– United Kingdom CBI Industrial Trends Orders (Mar) at 13:00 (GMT+2);
– Federal Reserve Chair Jerome Powell’s speech at 16:00 (GMT+2);
This article reflects a personal opinion and should not be interpreted as an investment advice, and/or offer, and/or a persistent request for carrying out financial transactions, and/or a guarantee, and/or a forecast of future events.
Fasten your seatbelts folks, the next few days could be volatile for the Dollar.
This week is jampacked with a host of speeches from US Fed officials, including the joint congressional testimony by Fed Chair Jerome Powell and Treasury Secretary Yellen later today. Normally non-events for the market, these speeches could become real shakers if fresh insight is offered on monetary policy and the health of the US economy.
Powell is widely expected to reiterate the central bank’s plan to support the recovery “for as long as it takes” during his testimony to Congress. Given the market sensitivity to the developments in the bond markets, Powell and Fed officials may be forced to choose their words wisely.
What about the Dollar?
The Dollar entered Tuesday on a positive note, almost clawing back all the losses from the previous session. Prices are approaching the 92.10 resistance level as of writing with a breakout on the horizon.
The upside could face obstacles in the short term if Powell reiterates a dovish tone during his testimony. However, bulls are likely to remain supported by rising bond yields in the medium term. Appetite towards the Dollar has been sweetened by the speedy rollouts of Covid-19 vaccines while Biden’s $1.9 trillion stimulus continues to brighten the growth outlook, driving up bond yields.
Focusing on the technicals, prices are trading above the 20 Simple Moving Average while the MACD trades above the 0 level. A solid breakout above 92.10 could open the doors towards 92.50 and 93.00, respectively. Should prices sink back below 91.70, the DXY could re-test the 91.35 support and 90.75.
Disclaimer: The content in this article comprises personal opinions and should not be construed as containing personal and/or other investment advice and/or an offer of and/or solicitation for any transactions in financial instruments and/or a guarantee and/or prediction of future performance. ForexTime (FXTM), its affiliates, agents, directors, officers or employees do not guarantee the accuracy, validity, timeliness or completeness, of any information or data made available and assume no liability as to any loss arising from any investment based on the same.
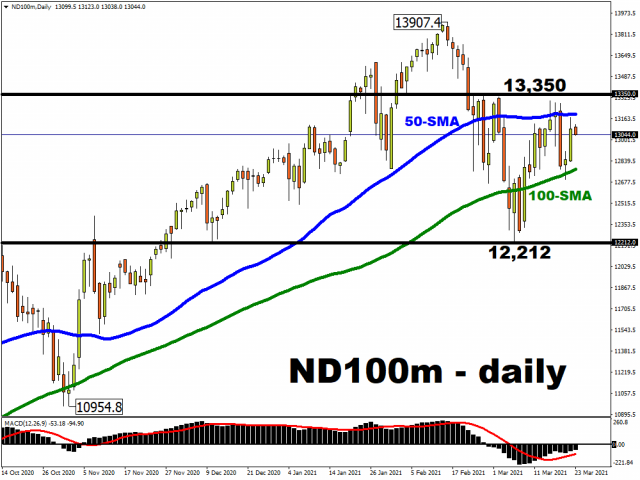
Such gains helped to restore the tech-heavy index’s year-to-date performance into positive territory, now up 1.54% for the period. Up until last week, the Nasdaq 100 had found its advances gathered so far in 2021 to be fleeting, as it fluctuated between gains and losses for its year-to-date performance.
What caused the Nasdaq to fall?
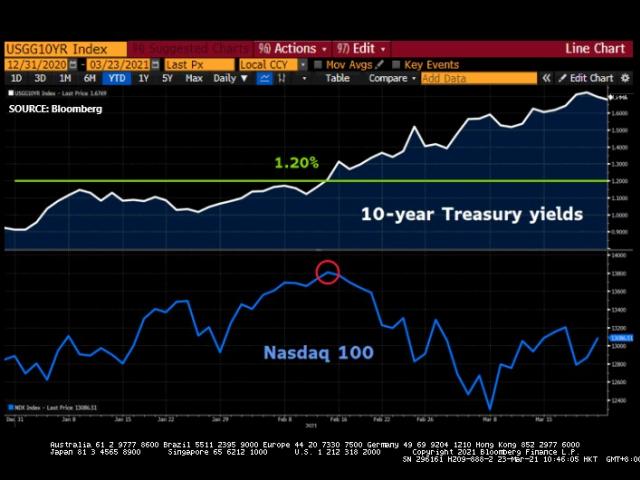
Surging Treasury yields have been the culprit for causing tech stocks’ declines since mid-February.
The Nasdaq 100’s highest ever closing price was recorded on 12 February, which coincided with 10-year Treasury yields breaching the psychologically-important 1.20% mark. Since then, 10-year yields have climbed by as much as 55 basis points higher, while the Nasdaq 100 remains 5.22% below its record high.
The rosier US economic outlook has prompted market participants to:
Sell US Treasuries, which caused yields to rise
Sell expensive tech stocks, which caused the tech-heavy Nasdaq to fall
Rotate funds into other equity sectors that would benefit from the economic recovery.
(Note: The S&P 500, the Dow Jones index, and the Russell 2000 index all posted record highs last week)
Considering that the role that soaring Treasury yields has played in being the arch-nemesis to tech stocks, it’s important to note that there are several key auctions of Treasury notes this week amounting to over US$200 billion.
Lackluster demand for these Treasury notes may trigger another yields spike, potentially causing further volatility on the Nasdaq 100 and dragging the index back towards its 100-day simple moving, or perhaps even lower, depending on how much higher yields climb.
Tumultuous Thursday for Tech?
This week is also set to feature a high-profile grilling of the tech titans. The CEOs of Facebook (Mark Zuckerberg), Google (Sundar Pichai), and Twitter (Jack Dorsey) are set to testify before lawmakers in Washington who are accusing these social media platforms of not doing enough to battle misinformation.
These three social media companies make up 75% of the equally-weighted FXTM Social Media index, with the fourth constituent being Snapchat.
Since posting a record high on 17 February, the Social index has been trading sideways, looking for a fresh catalyst. Since that record high, Facebook has been the sole gainer for the period, which is helping prop up the broader index against the declines in the other three constituents:
Although Big Tech hasn’t been a stranger to the ire of US lawmakers, a fresh bout of uncertainty stemming from this hearing before the House subcommittee may further dampen these stock prices.
Beyond Thursday’s hearing, news that US President is set to nominate Lina Khan to the Federal Trade Commission may weigh on tech stocks over the longer term. Khan has long warned against the dominance of tech giants and is a known proponent of breaking up Big Tech. Such an appointment indicates that the Biden administration’s antitrust agenda is likely to present a major headwind for these tech counters over the coming years.
Disclaimer: The content in this article comprises personal opinions and should not be construed as containing personal and/or other investment advice and/or an offer of and/or solicitation for any transactions in financial instruments and/or a guarantee and/or prediction of future performance. ForexTime (FXTM), its affiliates, agents, directors, officers or employees do not guarantee the accuracy, validity, timeliness or completeness, of any information or data made available and assume no liability as to any loss arising from any investment based on the same.
As we discussed last February, the technical outlook for both gold and oil completely reversed during 2020 and early 2021 leaving a positive outlook for crude oil due to the vaccination process and improved future prospects.
During the last few days, there has been a growing fear regarding increasing cases in Europe. This increase has caused several countries to tighten their measures in an attempt to curb the pandemic. This in turn has generated a level of uncertainty that we will have to pay attention to in the coming days in order to see the evolution of the pandemic and the possible evolution in the financial markets and commodities.
Analysis of Gold
During the first part of 2020, gold was one of the market’s main protagonists with a rise of more than 25% that took it to 2,089 dollars per ounce. However, since reaching this maximum at the beginning of August, the price continued to fall within the bearish channel until it reached the key support in the area coinciding with the lower red band around 1,675 dollars and the 61.8% fibonacci retracement level of the previous uptrend.
After reaching this level, the price finally made a bullish bounce in search of its 18-session average in black which acts as the main resistance level. Here, the price has stopped after being affected by the dollar rallies triggered by the US bond rallies and the plunge of the Turkish lira that is taking place following the dismissal by Tayyip Erdogan of the governor of the Turkish central bank after disagreements with economic policy.
It is important to watch the price action as, if the current trend in US bonds and the instability in the currency market following the recent events in Turkey continues to strengthen the dollar, gold could make another downward push back to its important support level, thus cutting short this latest upward bounce.
This bearish bounce around its moving average resistance could be interpreted as a channel failure, as the price will not return to its upper band, which could lead to further declines. As long as gold is unable to break above the upper trend band of the bearish channel and its 200-session moving average, sentiment will remain negative.
Source: Admirals (Formerly Admiral Markets) MetaTrader 5 – Gold Daily Chart. Date Range: 6 December 2019 – 22 March 2021. Date Captured: 22 March 2021. Past performance is not necessarily an indication of future performance.
Price evolution of the last five years:
2020: 21.86%
2019: 15.45%
2018: -3.22%
2017: 12.75%
2016: 10.12%
Brent Analysis
After several positive weeks since the beginning of February and rises of more than 20% due to the growing optimism for the future after the start of the vaccination process, in the last few sessions we have seen an increase in instability. This is due to the increase in cases of coronavirus in European countries, jeopardising recovery as new measures could be implemented, affecting the price of crude oil.
Technically speaking, it seems that crude oil has finally found a resistance as last week the price fell almost 7% closing at a level close to 65 dollars after bouncing off the upper band of the bullish channel and the blue resistance level that we can see in the weekly chart, although on Friday it recovered 2.61%. It is important to watch the next few sessions and see how the pandemic evolves as it could be pivotal in deciding the future trend.
Currently, the first important support level is around 60 dollars per barrel as this is the area between its previous resistance level, its broken downtrend line (in dashed lines) and its 18 session average.
The loss of this level could lead to further declines in search of its 200 session average in red or even the lower band of the bullish channel.
Source: Admirals MetaTrader 5 – Brent Weekly Chart. Date Range: 7 September 2014 – 22 February 2021. Date Captured: 22 March 2021. Past performance is not necessarily an indication of future performance.
Price evolution of the last five years:
2020: -21.52%
2019: 22.68%
2018: -19.55%
2017: 17.69%
2016: 52.41%
Trade Commodity CFDs With Admirals
With the Trade.MT5 account from Admirals, you can trade Contracts For Difference (CFDs) on gold, Brent crude and many other commodities! CFDs allow traders to attempt to profit from both rising and falling prices, whilst also benefiting from the use of leverage. Click the banner below to open an account today:
INFORMATION ABOUT ANALYTICAL MATERIALS:
The given data provides additional information regarding all analysis, estimates, prognosis, forecasts, market reviews, weekly outlooks or other similar assessments or information (hereinafter “Analysis”) published on the websites of Admiral Markets investment firms operating under the Admiral Markets trademark (hereinafter “Admiral Markets”) Before making any investment decisions please pay close attention to the following:
This is a marketing communication. The content is published for informative purposes only and is in no way to be construed as investment advice or recommendation. It has not been prepared in accordance with legal requirements designed to promote the independence of investment research, and that it is not subject to any prohibition on dealing ahead of the dissemination of investment research.
Any investment decision is made by each client alone whereas Admiral Markets shall not be responsible for any loss or damage arising from any such decision, whether or not based on the content.
With view to protecting the interests of our clients and the objectivity of the Analysis, Admiral Markets has established relevant internal procedures for prevention and management of conflicts of interest.
The Analysis is prepared by an independent analyst, Roberto Rojas (analyst), (hereinafter “Author”) based on their personal estimations.
Whilst every reasonable effort is taken to ensure that all sources of the content are reliable and that all information is presented, as much as possible, in an understandable, timely, precise and complete manner, Admiral Markets does not guarantee the accuracy or completeness of any information contained within the Analysis.
Any kind of past or modeled performance of financial instruments indicated within the content should not be construed as an express or implied promise, guarantee or implication by Admiral Markets for any future performance. The value of the financial instrument may both increase and decrease and the preservation of the asset value is not guaranteed.
Leveraged products (including contracts for difference) are speculative in nature and may result in losses or profit. Before you start trading, please ensure that you fully understand the risks involved.
– Seven out of 10 people will not splurge excessive savings accumulated over the pandemic, according to a global poll carried out by one of the world’s largest independent financial advisory and fintech organizations.
When asked by deVere Group ‘Are you likely to spend the majority of the extra money you have managed to save over the last 12 months?’ 72% responded ‘no’. 16% said ‘yes’ and 12% ‘did not know.’
The 450-plus respondents are clients who currently reside in North America, the UK, Asia, Africa, the Middle East, East Asia, Australasia and Latin America.
Nigel Green, deVere Group CEO and founder, says: “The pandemic has been a time of great financial worry and insecurity for many households.
“But for others, especially those in developed economies who have been able to continue working from home throughout, they have accumulated more savings than they usually would due to the lack of services, travel and leisure activities to spend their incomes on.”
For example, Bloomberg estimates that the U.S. has $1.5 trillion in extra savings.
The deVere CEO continues: “The historic levels of excess savings are fueling economic rebound forecasts, and with them inflation fears, as there’s expectations that families will splurge the extra money built-up during the pandemic.
“However, our poll suggests that most people are not planning to spend much of the additional cash.
“Naturally, we should expect an increase in spending as economies re-open, but the majority of those surveyed appear to welcome having an extra financial buffer.
“The pandemic has got people thinking about and valuing more than ever what really matters to them. For most of us, this includes ensuring that we and our loved ones are financially secure to have the opportunities and lifestyles that we desire.”
He goes on to say: “Whilst it is certainly a positive to have accumulated savings for the future, in order for the cash not to be eroded over time in bank accounts offering almost zero interest, the money should be ‘put to work’ through a sensible investment strategy.
“In all my years of being a financial professional, I have only ever come across a handful of individuals who have acquired enough money for their retirement by saving alone – and that has usually been because it was inherited wealth.
“To me, having the correct investment mix — or, in other words, a properly diversified and regularly reviewed portfolio — is vital for long-term financial success. In order for a portfolio to be truly diversified, I believe it needs to incorporate different asset classes, sectors and geographical regions.”
Mr Green concludes: “After an initial burst, households are not likely to aggressively spend their excess savings accumulated during the pandemic.
“But in order to enhance the purchasing power of the additional funds, understandably many will be seeking to top-up their investment portfolios.”
About:
deVere Group is one of the world’s largest independent advisors of specialist global financial solutions to international, local mass affluent, and high-net-worth clients. It has a network of more than 70 offices across the world, over 80,000 clients and $12bn under advisement.
– In the first part of this research article, we shared more detail related to the Excess Phase Peak technical pattern that is setting up in the NASDAQ and to highlight the validity of our Gann/Fibonacci Technical research which suggested a peak in the markets may set up sometime after April 1, 2021. We’ve received many questions and comments from our readers and followers related to these articles. Many people seem to believe we are calling for an April 1 market peak based on this research, yet the technical patterns we are highlighting suggest a longer-term market peak may already be setting up.
In this second part of our more detailed “what next” article, my research team and I will highlight exactly why we believe traders and investors need to be prepared for an extended technical topping pattern and how it will likely set up over the next 60 to 90+ days. Let’s continue our research from Part I and go into more detail related to this technical setup.
In Part I, we focused on the NASDAQ and how the recent downside price rotation may align with our Gann/Fibonacci research as well as align with the Excess Phase Topping pattern highlighted in our November 2020 research. Now, we’re going to focus on the Dow Jones Industrial Average and our Custom US Stock Market Index showing how these two market sectors have yet to react like the NASDAQ already has.
Dow Jones Has Yet To Break Key Price Channel
Looking at the chart below, we can see that the INDU has yet to break the YELLOW upward price trend line. We have not seen price move below this support channel yet, thus we don’t have any confirmation that a weakening in price trend is taking place. In fact, recently the INDU has rallied higher over the last few weeks as capital has shifted away from the NASDAQ and into various other sectors.
Next, we believe the INDU still has another 3% to 5% to rally further before reaching the GREEN 1.618% Fibonacci Price Amplitude Arc on the chart below. This suggests the INDU may continue to rally a bit further before reaching resistance while the NASDAQ may attempt a more moderate price rally within the sideways (#B) Flagging channel. This setup suggests the INDU and SPY have not yet reacted to price weakness like the NASDAQ already has.
We’ve drawn a MAGENTA line on this chart highlighting what we believe a “technical breakdown” in price will look like for the INDU. First, a rollover top sets up, prompting a downward price trend to set up the sideways Flagging trend. After 4 to 8+ weeks of sideways Flagging, a broad downtrend will take place where price will fall -10% to -15% – targeting the CYAN support level near $29,000. Much like the NASDAQ, this critical support level is the last line of defense before a bigger breakdown in price may occur – possibly resulting in a very deep price correction.
Custom US Stock Market Index Chart Mirrors INDU
This final Custom US Stock Market Index Weekly chart, below, shows a similar type of setup as the INDU. These Custom Index charts are tools we use to help gauge the overall market trends and possible technical setups. They help to normalize price trends and variances between the major US indexes and provide a different perspective of price on a chart.
The first thing we notice when looking at this chart is that the Custom US Stock Market Index has yet to break the YELLOW upward price channel – just like the INDU chart. Secondly, we can see the Custom US Stock Market Index chart is much closer to the heavy MAGENTA Fibonacci Price Amplitude Arc than the INDU chart is – this suggests there may only be a 3% to 5% upside potential left in the markets related to any potential rally attempt. Readers need to understand this does not mean that markets are limited to +3% to +5% at this stage – many sectors may trend +10% or more while the Custom US Stock Market Index chart rallies only 1.5% or so. The stock market is a “market of stocks” – not a single entity related to the Custom US Stock Market Index chart. Therefore, we may see various rally ranges in various sectors while we see more muted trends in some of these major indexes.
The last thing we want to point out on this chart is the Fibonacci Price Amplitude Arc that originates from February 2020 (pre-COVID-19 highs). It appears there is a high likelihood of a weakening uptrend on this chart after April 15, 2021. It also appears there is a likely APEX inflection point near May 5 through May 10. This APEX in price may become a key date for a potential breakdown in the trend on this Custom US Stock Market Index chart.
Overall, what we are seeing on this chart is that we have yet to break below the YELLOW upward price trend line and we are nearing the key Fibonacci Price Amplitude Arc levels – this suggests the markets may be nearing a period of consolidation and/or weakening upward price trending. The key to all of these setups is the process of the Excess Phase Peak setup – where price must complete the four phases (A through D) before finally attempting a larger breakdown event (#E).
Additionally, traders should stay keenly aware that various sectors will likely continue to trend in wide ranges with varying degrees of trend slopes while this extended pattern continues to setup. On this Custom US Stock Market Index chart, we are suggesting that the #C breakdown event (targeting #D), may take place in July or August 2021. This suggests we have about 3+ months of rotational sideways trending to navigate before the extended Excess Phase Peak #C breakdown event takes place.
As these trends continue to setup, we want you to understand how various opportunities for trend will continue to setup over the next few months in various sectors and indexes. These price rotations will likely prompt 8% to 25% price trends in a number of the best performing sectors and symbols. The key to finding and targeting this success is to know which sectors/trends are have the highest probability for success. That is what our Best Asset Now strategy does for us – it shows us when to engage with the market trends and which assets are the best performing assets to invest in.
Don’t miss the opportunities in the broad market sectors over the next 6+ months. 2021 and beyond are going to be incredible years for traders. What we expect to see is not the same type of market trend that we have experienced over the past 8+ years – this is a completely different set of market dynamics. You can sign up now for my FREE webinar that teaches you how to find, enter, and profit from only those sectors that have the most strength and momentum. Staying ahead of sector trends is going to be key to success in volatile markets.
For those who believe in the power of trading on relative strength, market cycles, and momentum but don’t have the time to do the research every day then my BAN Trader Pro newsletter service does all the work for you with daily market reports, research, and trade alerts. More frequent or experienced traders have been killing it trading options, ETFs, and stocks using my BAN Hotlist ranking the hottest ETFs, which is updated daily for my premium subscribers
Tomorrow and Wednesday we have a couple of the most important data releases for the pound this month.
The general trend for the currency right now is pretty much down to expectations around the covid recovery. BOE officials have stressed repeatedly that monetary policy will hinge on jobs and inflation.
Both are connected, and both data sets are coming out now.
It’s not surprising, then, that analysts are forecasting some volatility in pound pairs over the next couple of days. Some of the data we will be looking at is from February, when the UK was already experiencing optimism thanks to the covid vaccine rollout.
The coming data could be the indication for a new trend and therefore may shake up the markets.
What we are looking for
We start with unemployment data from January. It used to be that the ILO data was leaked to the market a little beforehand, leading to some extra volatility before traders got to their desks.
So, if you are trading around that time, be sure to keep an eye out for that.
Probably the most important bit of data is the Claimant Count Change And, somewhat unusually, a consensus hasn’t formed among economists yet.
The UK registered a loss of 20K jobs in December. But that was in the lead-up of Brexit and the middle of a lockdown. It wouldn’t be unsurprising to get a positive number of jobs added in January, which could help give the pound a boost.
It’s not all smooth sailing
Expectations for the ILO Unemployment rate, however, are for it to tick higher to 5.2% compared to 5.1% in December.
Although moving in the wrong direction, it still could be within the margin of rounding.
We’d need to see a move of at least a couple of decimals to suggest that a trend has been forming. We should also remember that the ILO figure is the average of three months.
So, in reality, the move is comparing the roll-off of October. If unemployment rises, it implies that January had a worse job situation than October.
A move lower would suggest that the UK might have turned the corner already, and could substantially strengthen the pound.
The situation with prices
On Wednesday, we get another avalanche of data out of the UK.
However, here, we want to focus on the Consumer Price Index, y/y change. That is projected to have accelerated in February to 0.8% from 0.7% prior.
It’s important to compare to core CPI change, which is the figure that is followed by the BOE. Core CPI strips out the more volatile elements, such as food and energy.
But it can be an indication of the trend. That’s because the cost of food and energy ultimately gets reflected in the underlying cost of producing and bringing goods to market.
Core CPI is projected to remain well below target at 1.4% compared to 1.4% prior.
Shares in Drugmaker Pfizer are trading a little lower ahead of the market open at the start of the week.
Despite the sales, Pfizer shares have been higher over recent weeks. Price rallied up off the 2021 lows of around 33 though prices remain some way off the 2021 highs (mid 37s) and down firmly from the 2020 highs above the 42 level.
Pfizer Down From 2020 Highs
Pfizer shares suffered a sharp sell-off from 2020 highs as other COVID vaccines entered the market across December 2020 and over Q1 so far with the company losing its competitive advantage.
The company was the first to have a COVID vaccine approved in the UK and US. However, despite the UK government ordering 40 million doses of the Pfizer vaccine, the Astra Zeneca- Oxford jab has proven to be more popular. The UK government ordered 100 million doses and a further 17 million from Moderna.
Countries Turning Away From AX-Oxford Jab
Over recent weeks, however, Pfizer has been gaining market share again as an increasing number of EU countries have turned against the UK’s AZ-Oxford jab over safety concerns relating to blood clots.
With these countries preferring to use the Pfizer-BioNTech jab, demand for the company’s vaccine has increased again. This is reflected in higher stock prices.
Pfizer Warns EU Not To Block UK Drug
This week, however, Pfizer has warned the EU not to block shipments of the AZ-Oxford jab from entering the EU. This is over fears that the UK could retaliate by blocking shipments of key ingredients to the EU which Pfizer use in the manufacturing process of its jab.
Pfizer is reportedly heavily reliant on supplies of lipids from the UK. If these exports were retained, Pfizer’s production line would be heavily impaired.
Cancer Jab Prospects
There have been some other big news this week for Pfizer with the company’s co-founder Ozlem Tureci telling reporters that within years, the technology used to create the COVID vaccine could be used to create similar jabs for cancer patients.
Such a move would be an extraordinary breakthrough in the fight against cancer. It is certainly something that investors will be keeping a close eye on moving forward.
Pfizer Breaks Back Above 35.50
The sell-off in Pfizer from last year’s highs saw the price nearly reaching the 32.72 support before buyers stepped in, causing a reversal higher.
Price has now broken back above the 35.53 level and, while above here, the rally has room to extend further towards the 37.36 level next.
This is a big shelf of resistance and a failure to break higher there will leave the market vulnerable to a reversal lower once again.







 Article by