
Article By RoboForex.com
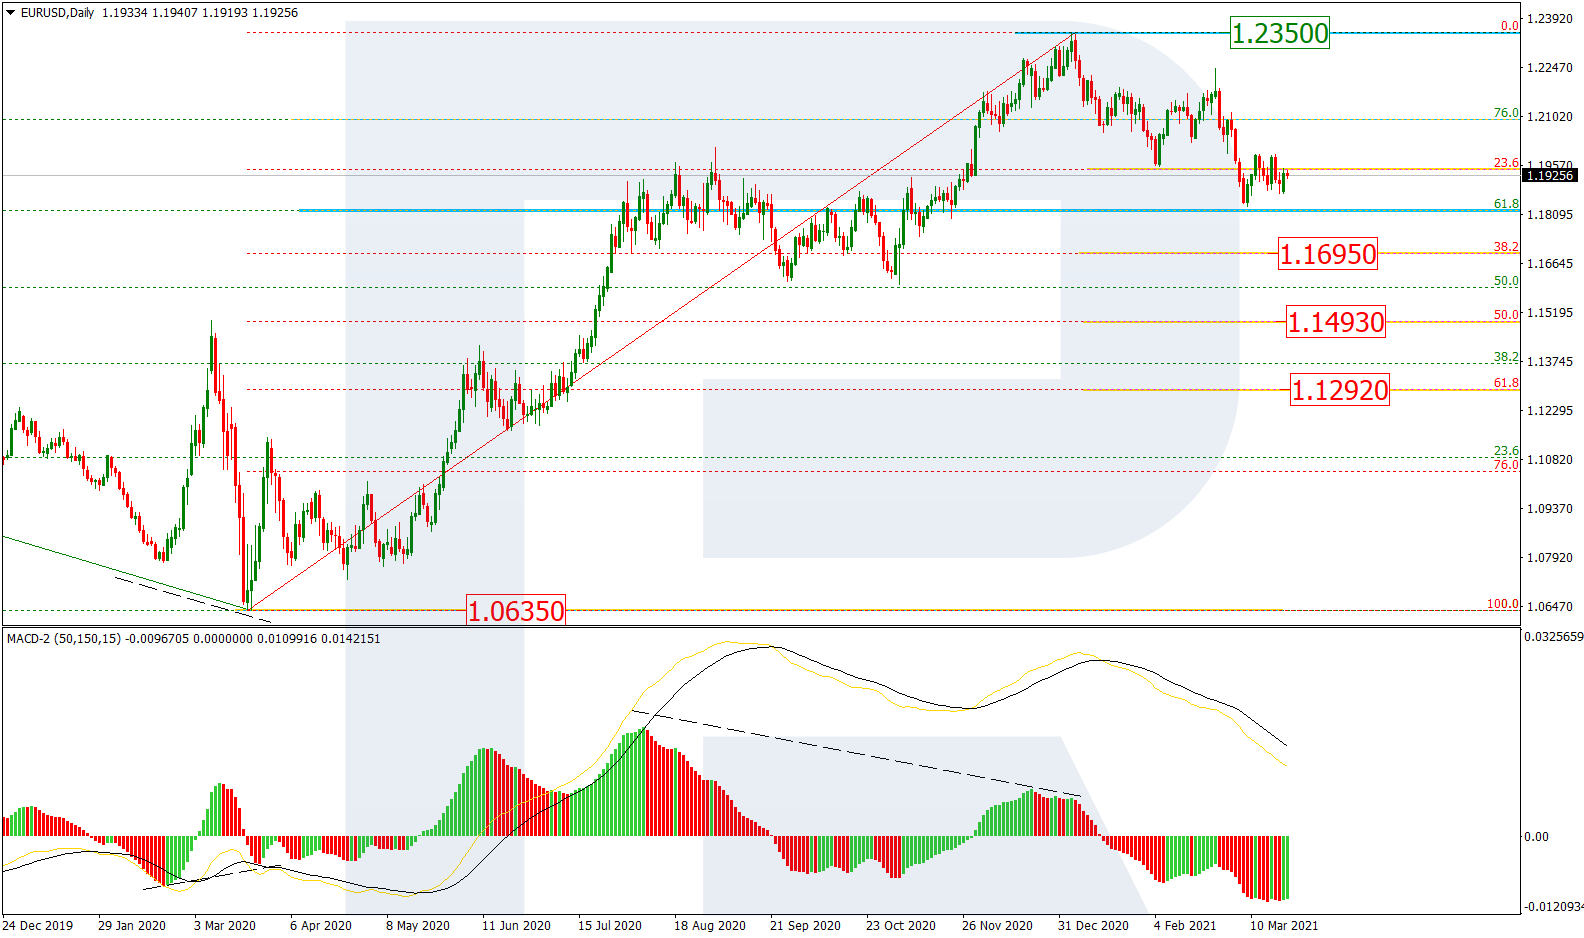
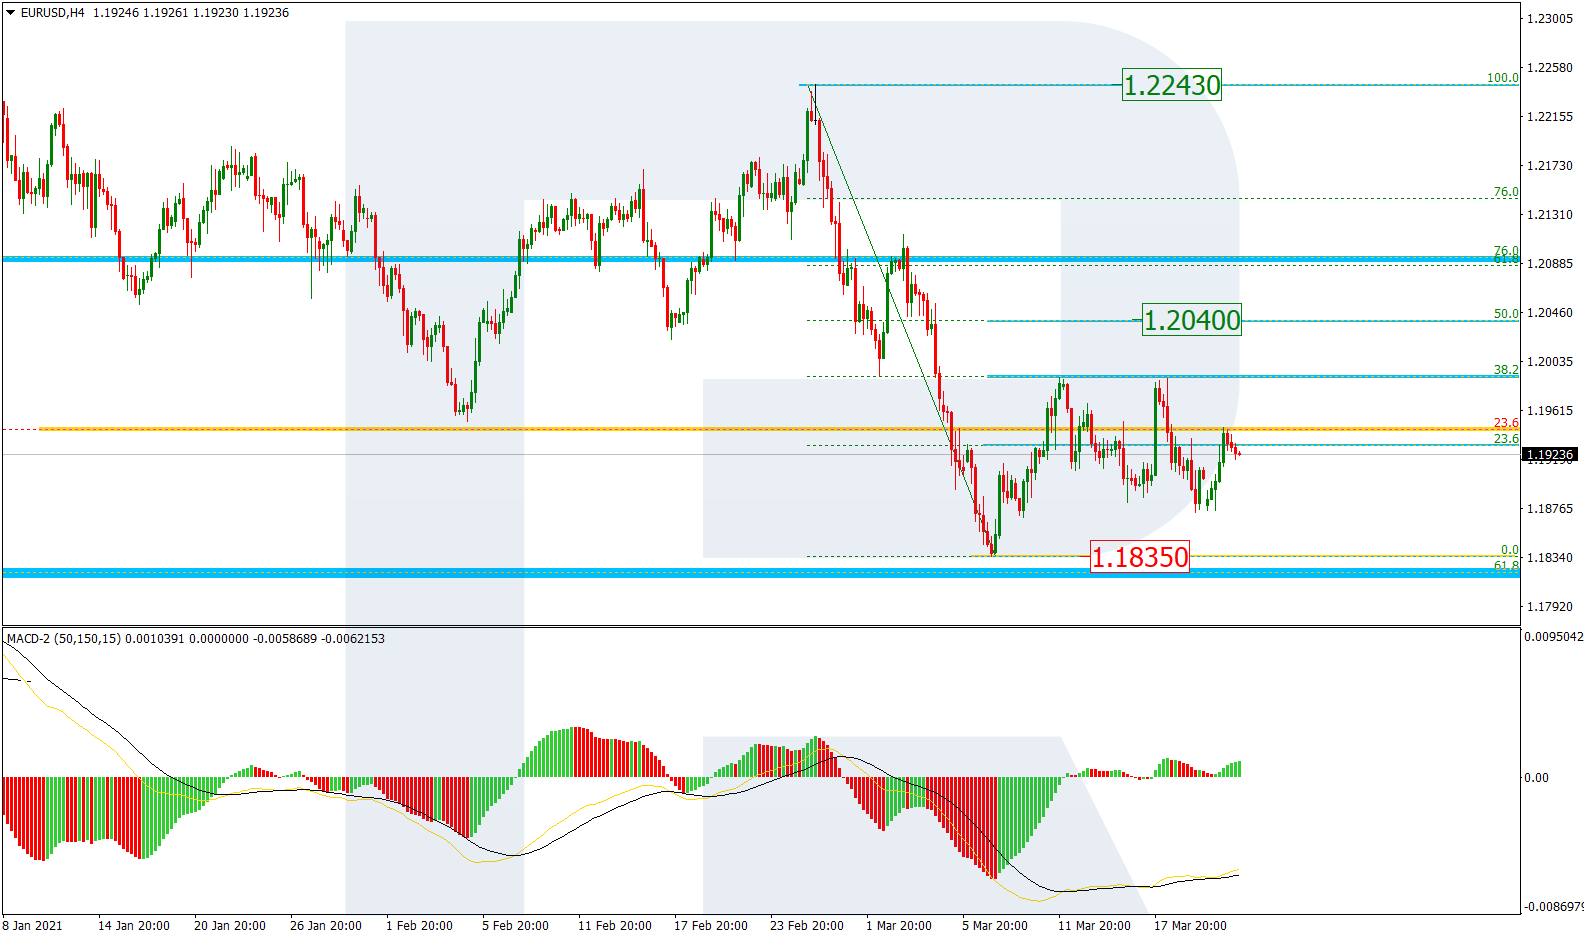
EURUSD, “Euro vs US Dollar”
As we can see in the daily chart, the asset continues the “bearish” phase after a divergence on MACD. After falling and reaching 23.6% fibo, the pair has started consolidating but may soon resume falling towards 38.2%, 50.0%, and 61.8% fibo at 1.1695, 1.1493, and 1.1292 respectively. The key resistance remains at the high at 1.2350.

The H4 chart shows a more detailed structure of the current short-term correction after the previous descending impulse, which has already tested 38.2% fibo twice and may yet continue towards 50.0% fibo at 1.2040. After finishing the correction, the asset may resume falling to reach and break the low at 1.1835. Later, the asset may continue its decline towards the mid-term targets. The key resistance is the fractal high at 1.2243.
Free Reports:
 Get our Weekly Commitment of Traders Reports - See where the biggest traders (Hedge Funds and Commercial Hedgers) are positioned in the futures markets on a weekly basis.
 Sign Up for Our Stock Market Newsletter – Get updated on News, Charts & Rankings of Public Companies when you join our Stocks Newsletter
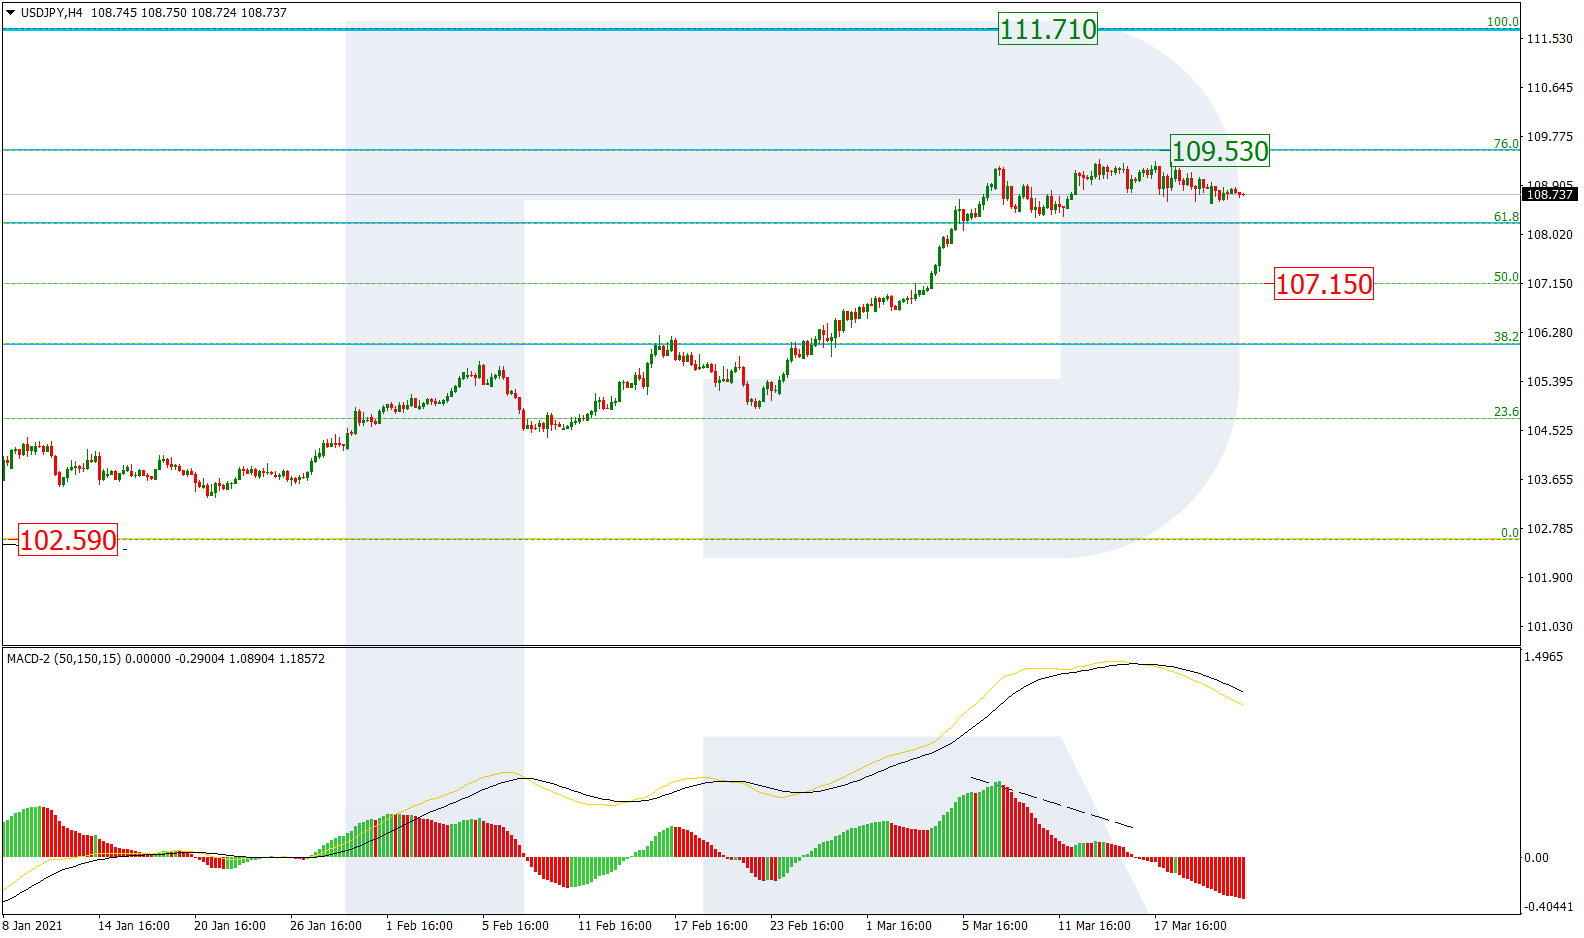
USDJPY, “US Dollar vs. Japanese Yen”
The H4 chart shows a slow descending correction after a divergence on MACD. At the same time, one should note that after breaking 61.8% fibo, the previous uptrend has failed to reach 76.0% fibo at 109.53. The long-term upside target is the fractal high at 111.71. The key correctional target right now is the support at 50.0% fibo at 107.15.
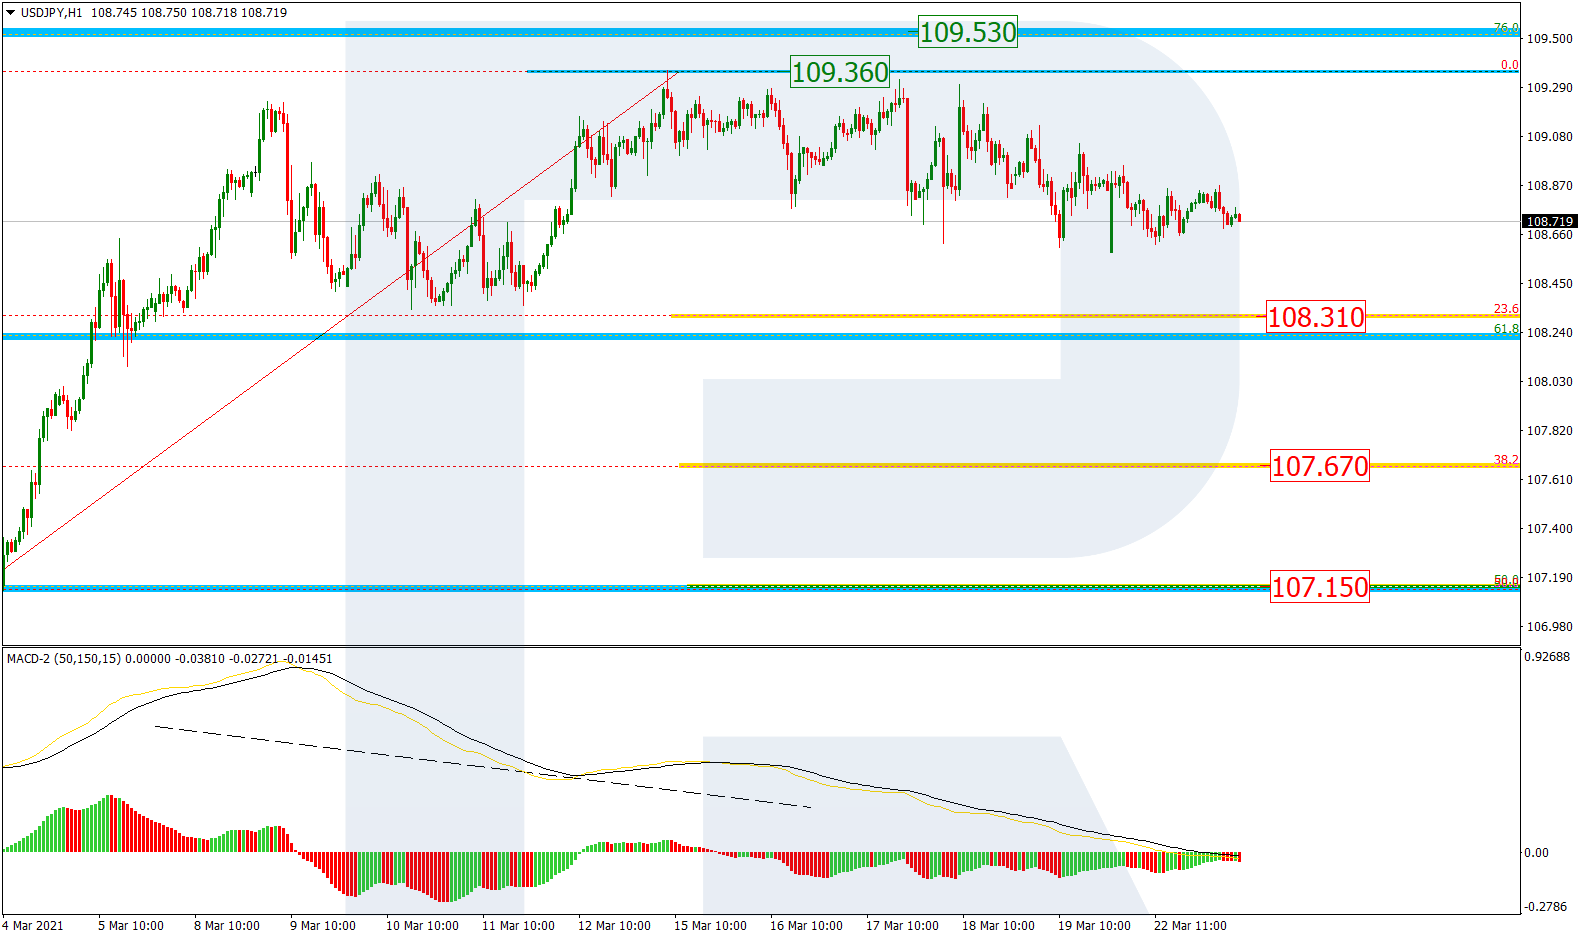
In the H1 chart, USDJPY is correcting to the downside and may reach 23.6, 38.2%, and 50.0% fibo at 108.31, 107.67, and 107.15 respectively. A breakout of the current high at 109.36 may complete the correction.
Article By RoboForex.com
Attention!
Forecasts presented in this section only reflect the author’s private opinion and should not be considered as guidance for trading. RoboForex LP bears no responsibility for trading results based on trading recommendations described in these analytical reviews.

- Inflationary pressure is easing in Canada. In New Zealand, on the contrary, inflation is rising Jul 21, 2026
- GBP/USD Falls After Cabinet Changes Jul 21, 2026
- Geopolitical and macroeconomic conditions continue to pressure market sentiment Jul 20, 2026
- USD/JPY Poised to Continue Gains as Expensive Oil and Lack of Support Weigh on Yen Jul 20, 2026
- COT Metals Charts: Weekly Speculator Bets led by Copper & Steel Jul 18, 2026
- COT Bonds Charts: Weekly Speculator Bets led by 2-Year, SOFR 3M & 5-Year Bonds Jul 18, 2026
- COT Energy Charts: Weekly Speculator Bets led by Brent Oil & Heating Oil Jul 18, 2026
- COT Soft Commodities Charts: Weekly Speculator Bets led by Wheat, Corn & Soybean Meal Jul 18, 2026
- The Bank of Canada kept its interest rate unchanged. Platinum prices reached a three‑week high Jul 16, 2026
- Stock indices rose after the release of US inflation data. China’s GDP slowed sharply Jul 15, 2026