Accelerating inflation in the US and rising Delta strain cases continue to weigh on financial markets

by JustForex

On Friday, the US stock indices finished trading in the red zone amid concerns about accelerating inflation. Investors believe that the Fed is unable to control inflation, so even though many major corporations have reported high net profits and revenues due to the economic recovery, the fixation of the previously open positions is still observed in the market. Last week, the Dow Jones decreased by 0.52%, the S&P 500 decreased by 0.97%, and the Nasdaq lost 1.87%. This week is not as eventful as the previous week, but it will be decisive and show whether the market is willing to continue the uptrend by turning a blind eye to high inflation. This week, the decline in stock indices could trigger a wave of sell-offs and the start of a big correction in the US stock market.

The European stock market closed with a slight decline on Friday. At the same time, the decline for the whole week was the worst over the last month. In the past week, the FTSE 100 has fallen by almost 2%, German DAX – by more than 1%, French CAC 40 has lost 1.3%. Despite the rising number of coronavirus cases in the UK per day, the country is lifting almost all remaining restrictions today as ministers believe in a vaccination program. However, British Prime Minister Boris Johnson will go into self-imposed isolation after coming into contact with a man who was infected with COVID-19.

Oil prices are falling amid OPEC+ decision to increase production. Since August, OPEC+ countries will begin to increase oil production by 400,000 barrels per day until the complete winding down of the cuts, which were provided in May 2020. Thus, demand will begin to catch up with supply, so the price increase to $100 per barrel is canceled.

Despite the drop in gold prices on Thursday and Friday, it closed the week at +0.2%. But at the opening of trading on Monday, gold started falling sharply. The reason for the decline is the growth of the Treasury bonds yield (inverse correlation with gold) on the background of the good report on the US retail sales for June.

Asia-Pacific stock indices are now strongly correlated with US indices, so there is also a decrease. Investors’ concerns are also associated with the growth of Delta strain cases in the region.

Main market quotes:

S&P 500 (F) 4,327.16 -32.87 (-0.75%)

Dow Jones 34,687.85 -299.17 (-0.86%)

DAX 15,540.31 -89.35 (-0.57%)

FTSE 100 7,008.09 -3.93 (-0.06%)

USD Index 92.71 +0.09 (+0.10%)

There is no news feed for today.

by JustForex


This article reflects a personal opinion and should not be interpreted as an investment advice, and/or offer, and/or a persistent request for carrying out financial transactions, and/or a guarantee, and/or a forecast of future events.

EUR/USD Slowly Falling

By Dmitriy Gurkovskiy, Chief Analyst at RoboForex

Early in another July week, the major currency pair is falling amid market players’ sympathies towards the American currency. EUR/USD is trading at 1.1810.

The “greenback” got some significant support from the latest report on the retail sales in the USA, which showed 0.6% m/m in June after being -1.7% m/m the month before and against the expected reading of -0.4% m/m. The Core Retail Sales report showed 1.3% m/m against market expectations of 0.4% m/m. Despite the fact that Americans are currently spending more money on services, the demand for goods remains quite high.

The preliminary report on the Consumer Sentiment from the University of Michigan disappointed but was barely noticed by investors. Nevertheless, the indicator dropped to 80.0 points in July after being 85.5 points in the previous months, although it was expected to reach 86.5 points.

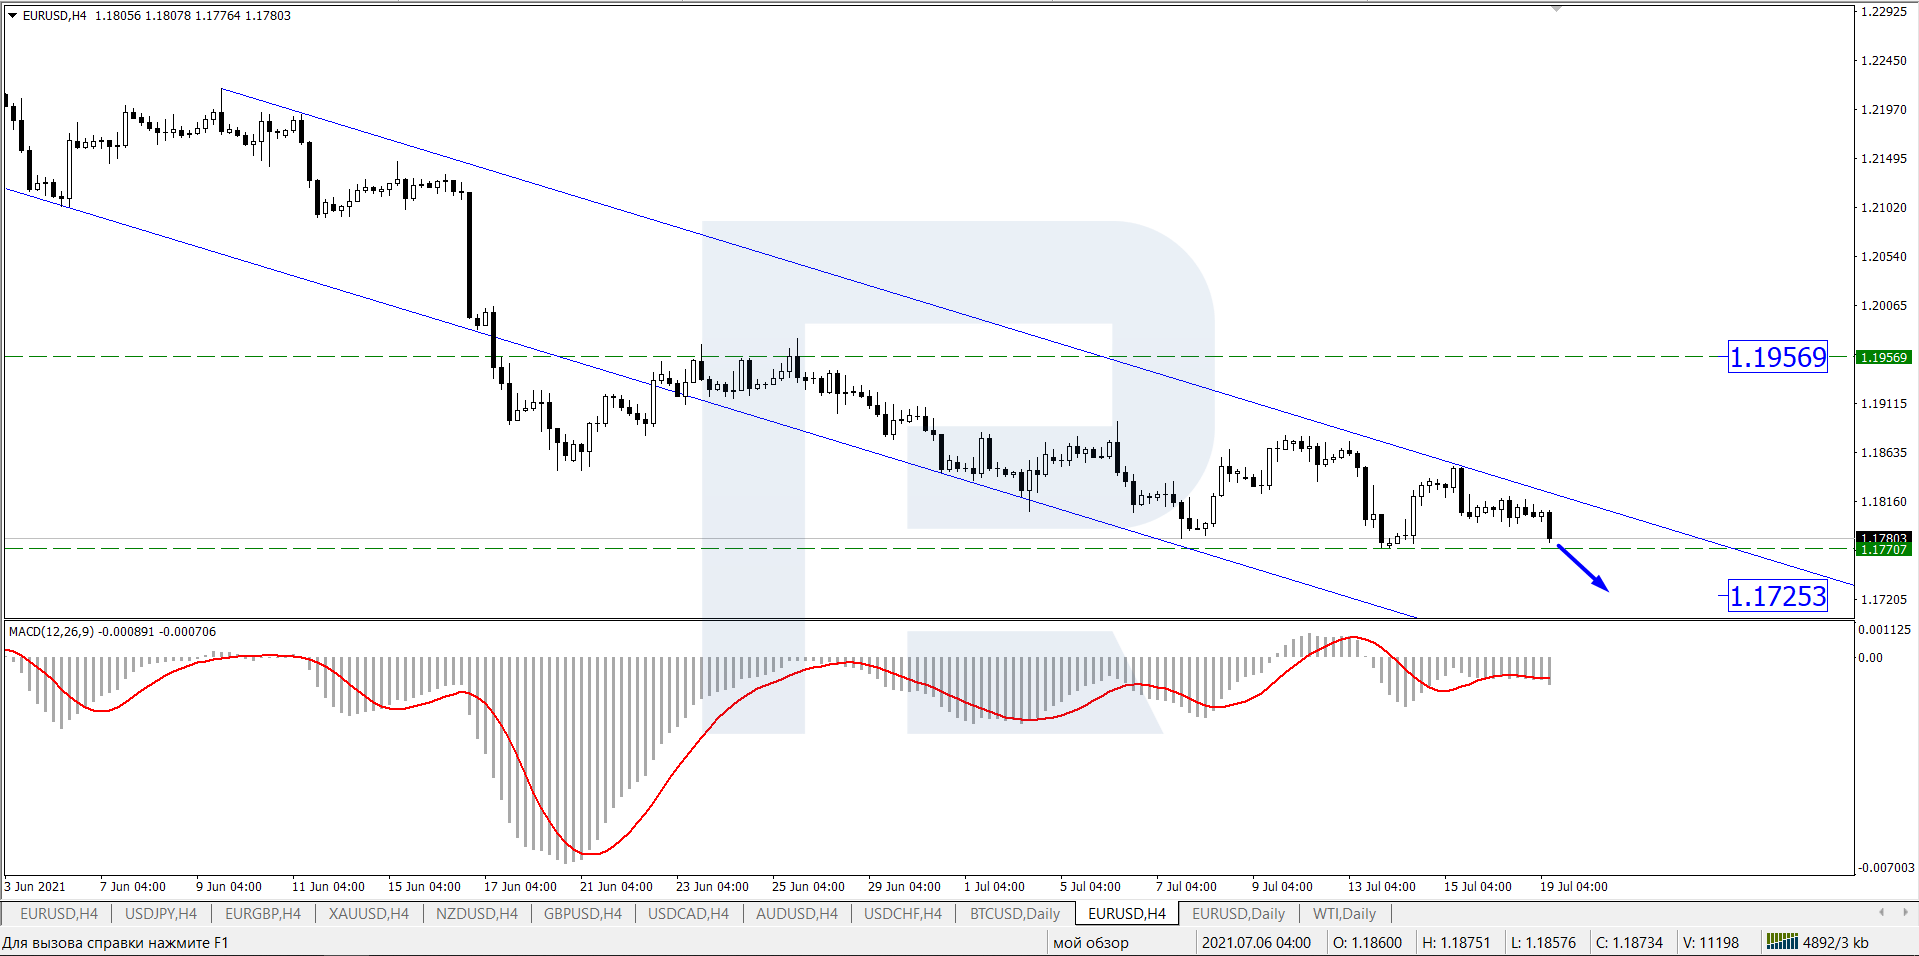
In the H4 chart, EUR/USD is forming another descending wave with the target at 1.1725. After testing this level, the instrument may continue falling. From the technical point of view, this scenario is confirmed by MACD Oscillator: its signal line is moving below 0, thus indicating that the descending wave continues.

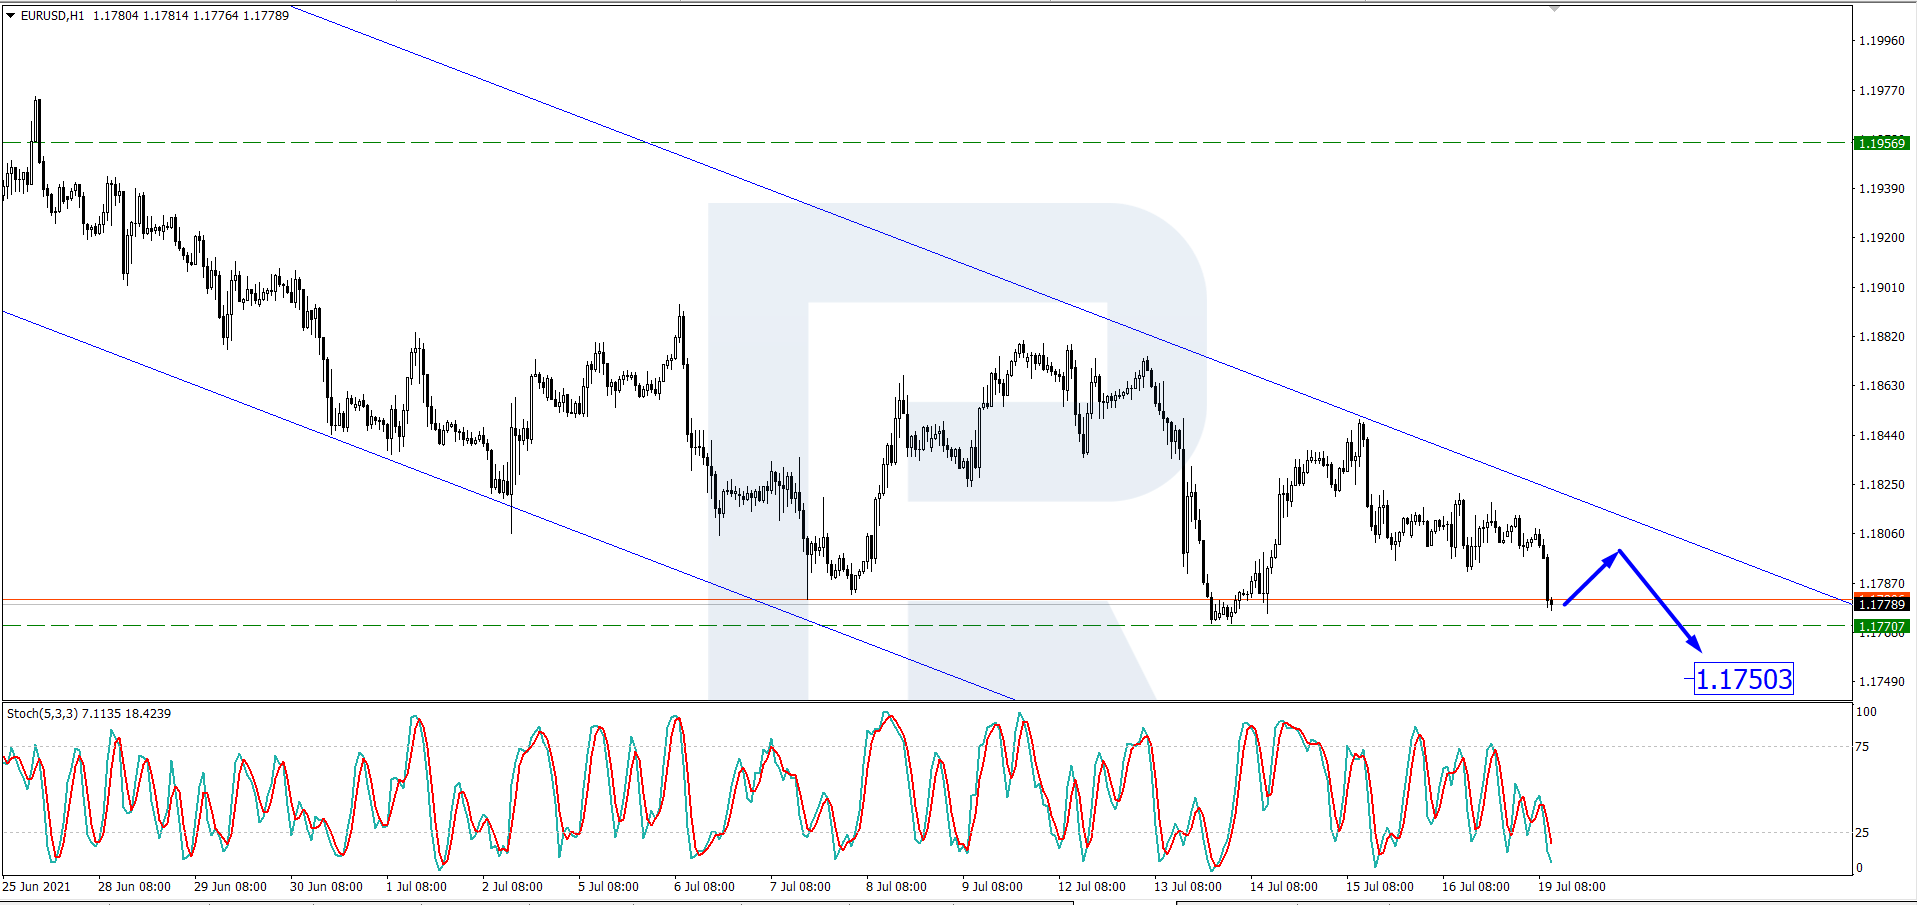
As we can see in the H1 chart, the asset is also trading downwards and may soon reach 1.1750. Later, the market may form a new correction and then resume trading downwards with the target at 1.1725. From the technical point of view, this scenario is confirmed by the Stochastic Oscillator: its signal line is steadily moving downwards below 25.

Disclaimer

Any forecasts contained herein are based on the author’s particular opinion. This analysis may not be treated as trading advice. RoboForex bears no responsibility for trading results based on trading recommendations and reviews contained herein.

Key events this week: ECB to offer new forward guidance

By Han Tan Market Analyst, ForexTime

This new trading week is already kicking off on an eventful note, with OPEC+ members sealing an agreement to continue gradually raising output. This helps pump out more oil into the recovering global economy that’s in great need of more barrels.

Such an equation helps ease the upward pressure on oil prices, with Brent oil now testing its 50-day simple moving average as the key support level.

As long as global demand for oil remains robust, that should help put a sturdy floor below oil prices, limiting its declines. Even with today’s drop, Brent futures have still gained well over 41% so far this year.

Now that the supply-demand uncertainty in oil markets has been alleviated, investors would be hoping for more clarity in the outlook for other asset classes with some rather telling events in store this week:

Monday, July 19

  • UK “Freedom Day”

Tuesday, July 20

  • Eurozone current account balance
  • RBA minutes
  • Germany PPI
  • Netflix earnings

Wednesday, July 21

  • EIA crude oil inventory report
  • Japan external trade

Thursday, July 22

  • ECB rate decision
  • Eurozone consumer confidence
  • US initial jobless claims, existing home sales
  • Twitter, Snap Q2 earnings

Friday, July 23

  • PMIs for Eurozone, UK, US
  • UK consumer confidence, retail sales


ECB modifications: All talk, no action on 22 July

For the upcoming ECB policy meeting on 22 July, the central bank was initially expected to hold a run-of-the-mill meeting, where it keeps its policy settings untouched. And to be sure, that is still the base case, with interest rates still set to be left at minus 0.5% while the ECB’s asset purchases continue.

However, a week ago, ECB President Christine Lagarde informed markets to expect “some interesting variations and changes” to policymaker’s forward guidance this week.

It remains to be seen how “interesting” the ECB’s new choice of words would be this Thursday. For now, markets are expecting mere adjustment to its statement pertaining to its newfound inflation target, with no actual policy tweaks slated for this meeting.

That should explain the relatively subdued performance of EURUSD, not straying far from the 1.18 mark in recent sessions. Still, a decidedly dovish surprise out of the ECB this week, at a time when several of their G10 peers are already turning hawkish, could prompt more weakness in the euro.

Language that points to an extension of support measures for the Eurozone economy could set EURUSD well on its way to forming a death cross (when the 50-day SMA crosses below its 200-SMA).

Such a technical event could then herald further declines for the world’s most popular currency pair.

New record high for FXTM Social Media index?

Tech counters such as Netflix, Twitter and Snap are among the familiar names in the US earnings due this week. However, for the purposes of the Social Media index, the latter two stocks take on a lot more significance. After all, Twitter and Snap make up 50% of the Social Media index, with the other half of this evenly-weighted index comprising Facebook and Google stocks.

Twitter and Snap are due to release their respective Q2 earnings after markets close on Thursday, 22 July. Markets believe that the official figures would once again exceed forecasts, thanks to:

  • solid double-digit growth in its active user base
  • favourable comparisons from Q2 2020
  • the increased spend on online advertising due to a rapidly reopening US economy

Markets are also pricing in the prospects that Twitter and Snap’s stocks would move by more than 10% either way, the day when trading resumes post-earnings (Friday, 23 July). Should those moves materialize to the upside, that could spell a fresh peak for the Social Media index.

From a technical perspective, such a feat is possible, considering that the declines at the tail end of this past week have cleared some of the froth in this index. Its 14-day relative strength index has pulled away from the 70 line while prices have also dipped away from its upper Bollinger band.

Depending on how Twitter and Snap’s actual Q2 results come off, it could add to this Social Media index’s 42% year-to-date gains, as long as the broader market conditions remain conducive as well.


Disclaimer: The content in this article comprises personal opinions and should not be construed as containing personal and/or other investment advice and/or an offer of and/or solicitation for any transactions in financial instruments and/or a guarantee and/or prediction of future performance. ForexTime (FXTM), its affiliates, agents, directors, officers or employees do not guarantee the accuracy, validity, timeliness or completeness, of any information or data made available and assume no liability as to any loss arising from any investment based on the same.


Forex-Time-LogoArticle by ForexTime

ForexTime Ltd (FXTM) is an award winning international online forex broker regulated by CySEC 185/12 www.forextime.com

Post-Covid Stimulus Payouts & The US Fed Push Global Investors Deeper Into US Value Bubble – Part II

By TheTechnicalTraders 

– In this second part of our research into how capital is being deployed across the globe and why traders/investors continue to pour capital into the US equities markets, we’ll explore how the US major indexes have reacted to the continued investments by the US and foreign investors compared to foreign market trends.

Using methods like this to determine where capital is being allocated and why traders/investors decide to move capital into and out of various global indexes, suggests one of the most important aspects of swing trading is to stay keenly aware of how capital is moving and deploying across the globe.

In October of 2019, we attempted to highlight how capital is shifting and how trends are setting up in currencies, global major indexes, and other global sectors.

October 17, 2019: CURRENCIES SHOW A SHIFT TO SAFETY AND MATURITY – WHAT DOES IT MEAN?

While reviewing our past research posts, we found this one particularly interesting because it was posted only 4 months before the COVID-19 peak and indicated our long-term predictive modeling system suggested a volatility surge may take place in late 2019 or early 2020.

October 29, 2019: LONG-TERM PREDICTIVE SOFTWARE SUGGESTS VOLATILITY MAY SURGE

Even though our predictive modeling system can’t attempt to predict unknown outside global events, like COVID or wars, it can make some really uncanny and accurate predictions related to price activity and volatility in the markets that come true.

Global Custom Smart Cash Index Continues To Flatten

This first chart shows our Custom Global Smart Cash Index Monthly Chart. The point we want you to focus on with this chart is the sideways and weaker price action over the past 6+ months as well as the +84.25% rally from the COVID lows.

This chart reflects a fairly even and global response by traders after the March 2020 COVID lows to expect a global reflation rally bringing global indexes back up to the pre-COVID-19 peaks. In this case, that rally phase completed by September/October 2020. After the November 2020 US elections, a second rally phase was initiated that pushed the Custom Global Smart Cash Index to recent highs (near $210). These current highs represent a new high price valuation level, even higher than the 2018 peak levels, which suggests that large amounts of capital shifted back into the global markets after the November 2020 election.

Sign up for my free trading newsletter so you don’t miss the next opportunity!

Currently, though, this chart shows a broad sideways weakening price trend that may suggest an early stage peak has setup – similar to the peak in 2018. As capital seems to be fleeing the global market indexes and sectors, it is likely to move away from risks related to this inflated secondary rally phase and into assets that provide better safety and security.

Custom US Stock Market Index Chart Shows A +34.42% Greater Rally Than Global Index

This second Custom US Stock Market Index chart shows an incredible rally phase after November 2020 that includes an additional +34.42% extended rally to the current $1266.42 highs. Comparatively, the Custom US Stock market index, which includes the NASDAQ, Russell 2000, SPY, Real Estate, and Retail Sales, highlights the incredible strength and resilience of the US economy and consumer over the past 12+ months. While the Global Custom Index has stalled over the past 6+ months, the US Custom Index has rallied an additional 13.5% higher.

At this stage of the rally, though, we need to see the Custom US Stock Market Index find support above the May 2021 lows, near 1164.38, and attempt to setup a new momentum base for any further upside price trending. The fact that the Global Custom Index is weakening while we’ve seen a fairly broad breakdown in commodities and the Russell 2000 recently suggests this extended rally may be pausing.

Normally, price moves in a rotational manner setting up new peaks and troughs as it trends. Recently though, the continued stimulus and global central bank actions have prompted a type of rally that we’ve not seen in many years – a hyper speculative rally based on expectations of very strong economic and recovery trends. As this phase of the post-COVID rally phase completes, the next phase may be much more difficult for traders to navigate going forward.

Post-COVID Recovery Cycles Will Change How Capital Seeks Opportunities In The Future

Recently, I shared a new research article related to the “Transitory Inflation” expectations that have been stated by Jerome Powell, and others, and how traders need to prepare for fairly broad rotations in the recovery data over the next 12 to 24+ months.

I strongly believe the global markets are going to contract into a sideways, slightly downward trend before the end of 2021 in alignment with the post-COVID cycle phases. Over the next 8+ months, my analysis of these phases suggests we will start to see weaker economic data, weaker consumer engagement, and eventually, the potential for another round of moderately negative economic data as the Month-over-Month and Year-over-Year data transitions into lower/weaker representation of the cycle phase (see the chart above).

Given the amount of capital deployed throughout the globe and within the US equities markets, this may prompt a series of fairly large price rotations over the next 18 to 24 months (or longer) and may not settle until after 2024. What the global central banks do, or don’t do, over the next 24+ months could compound these cycle phases and trends.

More than ever, right now, traders need to move away from risk functions and start using common sense. There will still be endless opportunities for profits from these extended price rotations, but the volatility and leverage factors will increase risk levels for traders that are not prepared or don’t have solid strategies. Don’t let yourself get caught in these next cycle phases unprepared.

Want to know how our BAN strategy is identifying and ranking various sectors and ETFs for the best possible opportunities for future profits? Please take a minute to learn about my BAN Trader Pro newsletter service and how it can help you identify and trade better sector setups.  My team and I have built this strategy to help us identify the strongest and best trade setups in any market sector.  Every day, we deliver these setups to our subscribers along with the BAN Trader Pro system trades.  You owe it to yourself to see how simple it is to trade 30% to 40% of the time to generate incredible results.

As something entirely new, check out my new initiative URLYstart to learn more about the youth entrepreneurship program I am developing. This is an online program of gamified entrepreneurship designed to introduce and inspire kids to start their own business. Click-by-click, each student will be guided from their initial idea, through the startup process all the way to their first sale and beyond. Along the way, our students will learn life lessons such as communication, perseverance, goal setting, teamwork, and more. My team and I are passionate about this project and want to reach as many kids as possible!

Have a great day!

Chris Vermeulen
Chief Market Strategist

TheTechnicalTraders.com

Week In Review: Earnings Kick Off, China Growth Slows, Powell Stays Dovish

By Lukman Otunuga Research Analyst, ForexTime

It was a week packed with key economic data from major economies, updated company earnings, and speeches from numerous central bank officials.

European and US stocks climbed to fresh record highs on Monday as investors eagerly awaited the start of earnings season. In the United Kingdom, Prime Minister Boris Johnson confirmed that “Freedom Day” would take place on Monday 19th of July. There was little action in the FX space with the dollar struggling for direction ahead of the CPI data while gold wobbled above $1800.

The main event risk for Tuesday revolved around the start of US earnings with JPMorgan and Goldman Sachs under the spotlight. Results from both banking giants exceeded expectations thanks to better-than-expected loan losses. Attention was also directed towards the latest US CPI report. Consumer prices rose by the most in 13 years in June while annual inflation saw its biggest jump since 2008. Dollar bulls were inspired by the bumper CPI print with the DXY ending Tuesday’s session on a strong note.

Our trade of the week was the S&P 500 which flirted around record highs. We questioned whether the index would move to earnings season’s tune. 

Mid-week the focus shifted to Jerome Powell’s semi-annual testimony in front of Congress. Investors who were hoping for Powell to dish out a hawkish surprise were left empty handed following the dovish tone seen in his prepared remarks for the House Financial Service Committee. Powell soothed market fears of early easing of monetary support by sticking with the mantra that inflation is transitory.

Back in the United Kingdom, CPI jumped to its highest level since 2018. According to the Office for National Statistics (ONS), consumer prices rose by 2.5% in June, up from 2.1% in May. Sterling appreciated as the inflation figures were seen pressuring the Bank of England to hike interest rates down the line.

Overall market sentiment turned shaky on Thursday after China reported second-quarter GDP growth that fell short of market expectations. The world’s second largest economy grew by 7.9% in the second quarter of 2021 compared with the same period a year ago. This was significantly slower than the 18.3% year-on-year increase registered in the first quarter. Fears over the rapid spread of the Delta variant added to the caution, fanning fears over the global economic recovery. 

We shared a technical outlook near the end of the week with G10 currencies under the spotlight. It will be interesting to see whether the GBPUSD extends losses in the week ahead and how the EURUSD behaves around the 1.1800 – 1.1770 regions.

Sentiment remained choppy on Friday as investors digested the abundance of risk event, key economic data and speeches from policymakers this week. In the commodities arena, Gold failed to conquer the 200-day Simple Moving Average this week and is descending back towards the $1800 psychological level. Bears are likely to eye $1792 and $1760 if $1800 proves to be unreliable support.


Disclaimer: The content in this article comprises personal opinions and should not be construed as containing personal and/or other investment advice and/or an offer of and/or solicitation for any transactions in financial instruments and/or a guarantee and/or prediction of future performance. ForexTime (FXTM), its affiliates, agents, directors, officers or employees do not guarantee the accuracy, validity, timeliness or completeness, of any information or data made available and assume no liability as to any loss arising from any investment based on the same.


Forex-Time-LogoArticle by ForexTime

ForexTime Ltd (FXTM) is an award winning international online forex broker regulated by CySEC 185/12 www.forextime.com

COT Currency Charts: US Dollar, Kiwi, Japanese Yen, Pound Sterling, Loonie, Peso, Bitcoin Futures

By CountingPips.com COT Home | Data Tables | Data Downloads | Newsletter

Here are the latest charts and statistics for the Commitment of Traders (COT) data published by the Commodities Futures Trading Commission (CFTC).

The latest COT data is updated through Tuesday July 13 2021 and shows a quick view of how large traders (for-profit speculators and commercial entities) were positioned in the futures markets. All currency positions are in direct relation to the US dollar where, for example, a bet for the euro is a bet that the euro will rise versus the dollar while a bet against the euro will be a bet that the euro will decline versus the dollar.


US Dollar Index Futures:
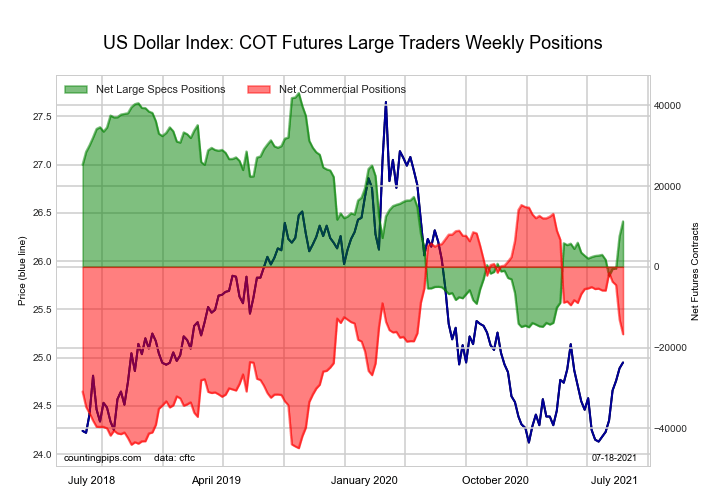
Federal Funds 30-Day Bonds Futures COT ChartThe US Dollar Index large speculator standing this week recorded a net position of 11,257 contracts in the data reported through Tuesday. This was a weekly lift of 3,688 contracts from the previous week which had a total of 7,569 net contracts.

This week’s current strength score (the trader positioning range over the past three years, measured from 0 to 100) shows the speculators are currently Bearish with a score of 45.2 percent. The commercials are Bearish with a score of 46.9 percent and the small traders (not shown in chart) are Bullish-Extreme with a score of 89.6 percent.

US DOLLAR INDEX StatisticsSPECULATORSCOMMERCIALSSMALL TRADERS
– Percent of Open Interest Longs:72.62.919.9
– Percent of Open Interest Shorts:42.946.95.6
– Net Position:11,257-16,6875,430
– Gross Longs:27,5021,0817,539
– Gross Shorts:16,24517,7682,109
– Long to Short Ratio:1.7 to 10.1 to 13.6 to 1
NET POSITION TREND:
– COT Index Score (3 Year Range Pct):45.246.989.6
– COT Index Reading (3 Year Range):BearishBearishBullish-Extreme
NET POSITION MOVEMENT INDEX:
– 6-Week Change in Strength Index:14.3-18.033.0


Euro Currency Futures:

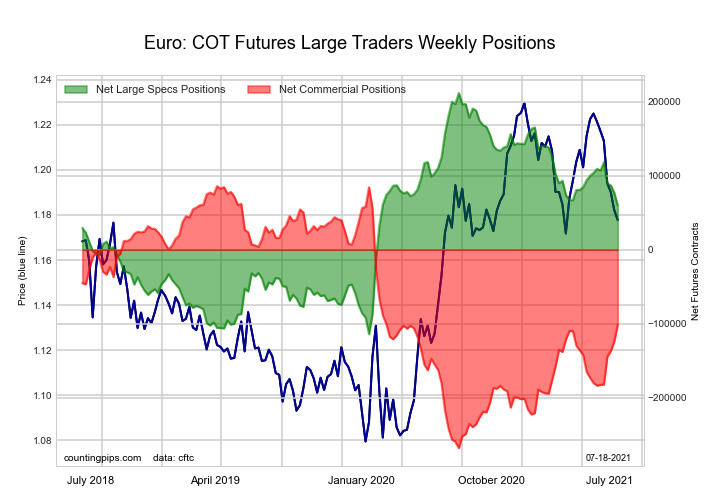
2-Year Treasury Bonds Futures COT ChartThe Euro Currency large speculator standing this week recorded a net position of 59,713 contracts in the data reported through Tuesday. This was a weekly decline of -17,477 contracts from the previous week which had a total of 77,190 net contracts.

This week’s current strength score (the trader positioning range over the past three years, measured from 0 to 100) shows the speculators are currently Bullish with a score of 53.3 percent. The commercials are Bearish with a score of 47.1 percent and the small traders (not shown in chart) are Bearish with a score of 49.2 percent.

EURO Currency StatisticsSPECULATORSCOMMERCIALSSMALL TRADERS
– Percent of Open Interest Longs:30.954.913.3
– Percent of Open Interest Shorts:22.269.67.3
– Net Position:59,713-101,37141,658
– Gross Longs:212,851378,32991,837
– Gross Shorts:153,138479,70050,179
– Long to Short Ratio:1.4 to 10.8 to 11.8 to 1
NET POSITION TREND:
– COT Index Score (3 Year Range Pct):53.347.149.2
– COT Index Reading (3 Year Range):BullishBearishBearish
NET POSITION MOVEMENT INDEX:
– 6-Week Change in Strength Index:-15.223.2-48.4


British Pound Sterling Futures:

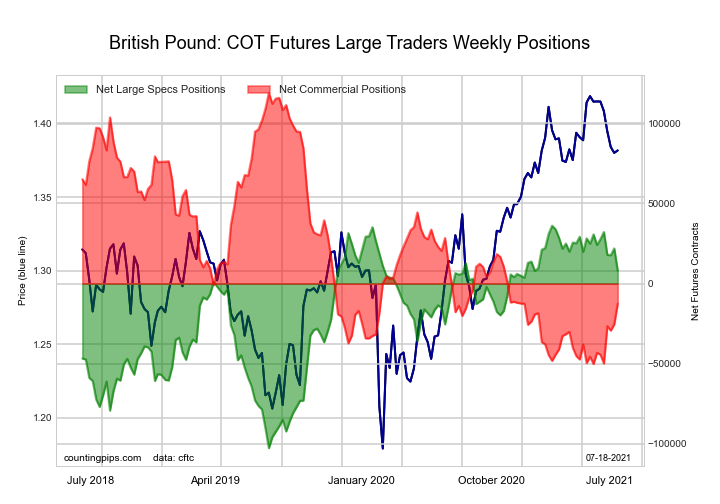
5-Year Treasury Bonds Futures COT ChartThe British Pound Sterling large speculator standing this week recorded a net position of 7,969 contracts in the data reported through Tuesday. This was a weekly decline of -13,934 contracts from the previous week which had a total of 21,903 net contracts.

This week’s current strength score (the trader positioning range over the past three years, measured from 0 to 100) shows the speculators are currently Bullish with a score of 79.7 percent. The commercials are Bearish with a score of 22.3 percent and the small traders (not shown in chart) are Bullish with a score of 65.2 percent.

BRITISH POUND StatisticsSPECULATORSCOMMERCIALSSMALL TRADERS
– Percent of Open Interest Longs:25.954.917.9
– Percent of Open Interest Shorts:21.362.215.3
– Net Position:7,969-12,5554,586
– Gross Longs:44,68694,67230,912
– Gross Shorts:36,717107,22726,326
– Long to Short Ratio:1.2 to 10.9 to 11.2 to 1
NET POSITION TREND:
– COT Index Score (3 Year Range Pct):79.722.365.2
– COT Index Reading (3 Year Range):BullishBearishBullish
NET POSITION MOVEMENT INDEX:
– 6-Week Change in Strength Index:-11.618.1-30.0


Japanese Yen Futures:

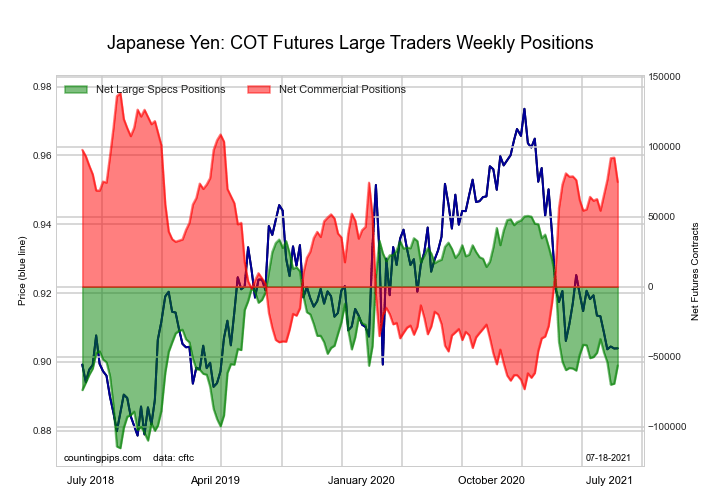
10-Year Treasury Notes Bonds Futures COT ChartThe Japanese Yen large speculator standing this week recorded a net position of -56,250 contracts in the data reported through Tuesday. This was a weekly boost of 12,886 contracts from the previous week which had a total of -69,136 net contracts.

This week’s current strength score (the trader positioning range over the past three years, measured from 0 to 100) shows the speculators are currently Bearish with a score of 35.6 percent. The commercials are Bullish with a score of 70.0 percent and the small traders (not shown in chart) are Bearish with a score of 20.9 percent.

JAPANESE YEN StatisticsSPECULATORSCOMMERCIALSSMALL TRADERS
– Percent of Open Interest Longs:19.971.58.1
– Percent of Open Interest Shorts:47.534.817.2
– Net Position:-56,25074,736-18,486
– Gross Longs:40,440145,71616,520
– Gross Shorts:96,69070,98035,006
– Long to Short Ratio:0.4 to 12.1 to 10.5 to 1
NET POSITION TREND:
– COT Index Score (3 Year Range Pct):35.670.020.9
– COT Index Reading (3 Year Range):BearishBullishBearish
NET POSITION MOVEMENT INDEX:
– 6-Week Change in Strength Index:-5.55.8-5.8


Swiss Franc Futures:

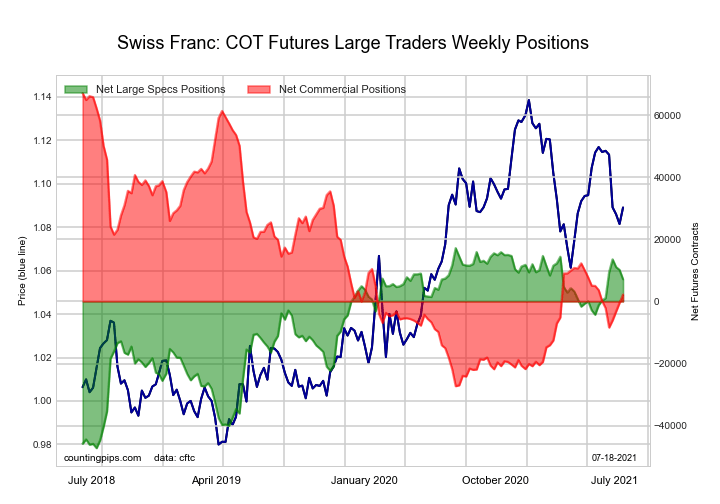
Ultra 10-Year Treasury Notes Bonds Futures COT ChartThe Swiss Franc large speculator standing this week recorded a net position of 7,137 contracts in the data reported through Tuesday. This was a weekly reduction of -3,025 contracts from the previous week which had a total of 10,162 net contracts.

This week’s current strength score (the trader positioning range over the past three years, measured from 0 to 100) shows the speculators are currently Bullish-Extreme with a score of 84.4 percent. The commercials are Bearish with a score of 31.3 percent and the small traders (not shown in chart) are Bearish with a score of 35.8 percent.

SWISS FRANC StatisticsSPECULATORSCOMMERCIALSSMALL TRADERS
– Percent of Open Interest Longs:39.540.919.3
– Percent of Open Interest Shorts:23.936.139.8
– Net Position:7,1372,225-9,362
– Gross Longs:18,07418,7078,825
– Gross Shorts:10,93716,48218,187
– Long to Short Ratio:1.7 to 11.1 to 10.5 to 1
NET POSITION TREND:
– COT Index Score (3 Year Range Pct):84.431.335.8
– COT Index Reading (3 Year Range):Bullish-ExtremeBearishBearish
NET POSITION MOVEMENT INDEX:
– 6-Week Change in Strength Index:10.62.2-26.1


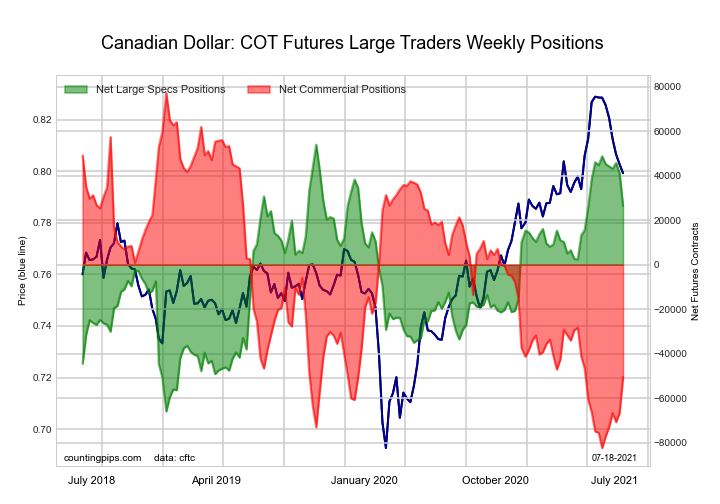
Canadian Dollar Futures:

US Year Treasury Notes Long Bonds Futures COT ChartThe Canadian Dollar large speculator standing this week recorded a net position of 26,376 contracts in the data reported through Tuesday. This was a weekly reduction of -14,802 contracts from the previous week which had a total of 41,178 net contracts.

This week’s current strength score (the trader positioning range over the past three years, measured from 0 to 100) shows the speculators are currently Bullish with a score of 77.0 percent. The commercials are Bearish with a score of 20.1 percent and the small traders (not shown in chart) are Bullish-Extreme with a score of 83.1 percent.

CANADIAN DOLLAR StatisticsSPECULATORSCOMMERCIALSSMALL TRADERS
– Percent of Open Interest Longs:31.846.121.3
– Percent of Open Interest Shorts:18.571.59.2
– Net Position:26,376-50,45024,074
– Gross Longs:63,10791,66442,347
– Gross Shorts:36,731142,11418,273
– Long to Short Ratio:1.7 to 10.6 to 12.3 to 1
NET POSITION TREND:
– COT Index Score (3 Year Range Pct):77.020.183.1
– COT Index Reading (3 Year Range):BullishBearishBullish-Extreme
NET POSITION MOVEMENT INDEX:
– 6-Week Change in Strength Index:-18.720.1-14.5


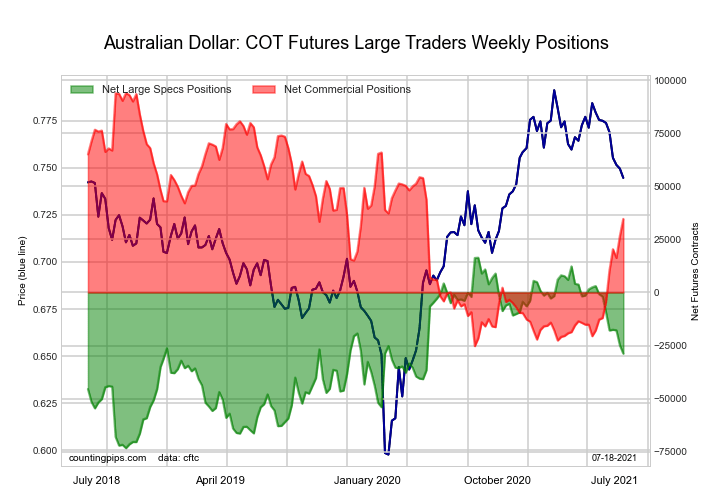
Australian Dollar Futures:

Ultra US Year Treasury Notes Long Bonds Futures COT ChartThe Australian Dollar large speculator standing this week recorded a net position of -28,788 contracts in the data reported through Tuesday. This was a weekly lowering of -3,918 contracts from the previous week which had a total of -24,870 net contracts.

This week’s current strength score (the trader positioning range over the past three years, measured from 0 to 100) shows the speculators are currently Bearish with a score of 49.6 percent. The commercials are Bullish with a score of 50.2 percent and the small traders (not shown in chart) are Bearish with a score of 44.3 percent.

AUSTRALIAN DOLLAR StatisticsSPECULATORSCOMMERCIALSSMALL TRADERS
– Percent of Open Interest Longs:36.449.213.5
– Percent of Open Interest Shorts:54.827.017.2
– Net Position:-28,78834,603-5,815
– Gross Longs:56,72176,75821,022
– Gross Shorts:85,50942,15526,837
– Long to Short Ratio:0.7 to 11.8 to 10.8 to 1
NET POSITION TREND:
– COT Index Score (3 Year Range Pct):49.650.244.3
– COT Index Reading (3 Year Range):BearishBullishBearish
NET POSITION MOVEMENT INDEX:
– 6-Week Change in Strength Index:-30.039.1-43.4


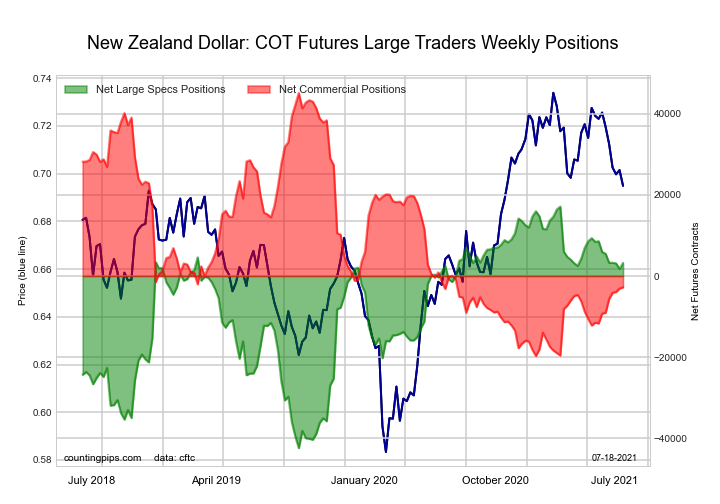
New Zealand Dollar Futures:

Eurodollar Bonds Futures COT ChartThe New Zealand Dollar large speculator standing this week recorded a net position of 3,230 contracts in the data reported through Tuesday. This was a weekly advance of 1,469 contracts from the previous week which had a total of 1,761 net contracts.

This week’s current strength score (the trader positioning range over the past three years, measured from 0 to 100) shows the speculators are currently Bullish with a score of 76.7 percent. The commercials are Bearish with a score of 26.1 percent and the small traders (not shown in chart) are Bearish with a score of 48.6 percent.

NEW ZEALAND DOLLAR StatisticsSPECULATORSCOMMERCIALSSMALL TRADERS
– Percent of Open Interest Longs:48.640.09.2
– Percent of Open Interest Shorts:41.046.610.2
– Net Position:3,230-2,794-436
– Gross Longs:20,62717,0043,899
– Gross Shorts:17,39719,7984,335
– Long to Short Ratio:1.2 to 10.9 to 10.9 to 1
NET POSITION TREND:
– COT Index Score (3 Year Range Pct):76.726.148.6
– COT Index Reading (3 Year Range):BullishBearishBearish
NET POSITION MOVEMENT INDEX:
– 6-Week Change in Strength Index:-4.510.0-42.0


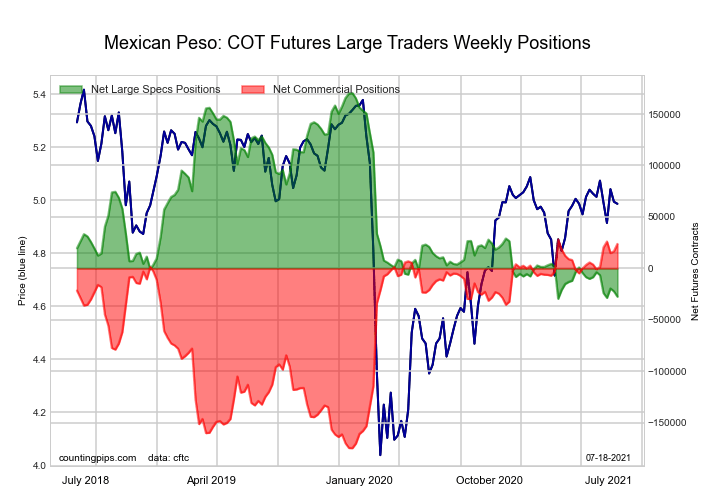
Mexican Peso Futures:

Ultra 10-Year Treasury Notes Bonds Futures COT ChartThe Mexican Peso large speculator standing this week recorded a net position of -27,432 contracts in the data reported through Tuesday. This was a weekly decline of -5,099 contracts from the previous week which had a total of -22,333 net contracts.

This week’s current strength score (the trader positioning range over the past three years, measured from 0 to 100) shows the speculators are currently Bearish-Extreme with a score of 1.0 percent. The commercials are Bullish-Extreme with a score of 97.9 percent and the small traders (not shown in chart) are Bullish with a score of 58.7 percent.

MEXICAN PESO StatisticsSPECULATORSCOMMERCIALSSMALL TRADERS
– Percent of Open Interest Longs:46.648.14.6
– Percent of Open Interest Shorts:65.032.22.1
– Net Position:-27,43223,7393,693
– Gross Longs:69,61171,9086,900
– Gross Shorts:97,04348,1693,207
– Long to Short Ratio:0.7 to 11.5 to 12.2 to 1
NET POSITION TREND:
– COT Index Score (3 Year Range Pct):1.097.958.7
– COT Index Reading (3 Year Range):Bearish-ExtremeBullish-ExtremeBullish
NET POSITION MOVEMENT INDEX:
– 6-Week Change in Strength Index:-11.912.1-3.2


Brazilian Real Futures:

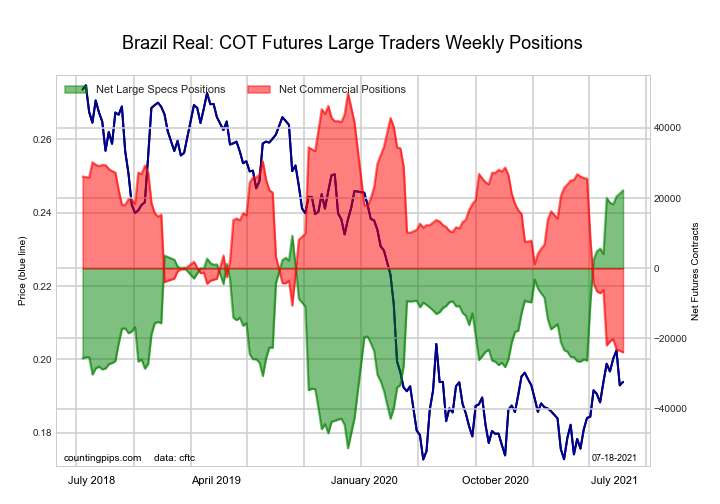
US Year Treasury Notes Long Bonds Futures COT ChartThe Brazilian Real large speculator standing this week recorded a net position of 22,220 contracts in the data reported through Tuesday. This was a weekly lift of 915 contracts from the previous week which had a total of 21,305 net contracts.

This week’s current strength score (the trader positioning range over the past three years, measured from 0 to 100) shows the speculators are currently Bullish-Extreme with a score of 100.0 percent. The commercials are Bearish-Extreme with a score of 0.0 percent and the small traders (not shown in chart) are Bullish-Extreme with a score of 87.8 percent.

BRAZIL REAL StatisticsSPECULATORSCOMMERCIALSSMALL TRADERS
– Percent of Open Interest Longs:72.118.69.0
– Percent of Open Interest Shorts:14.880.34.5
– Net Position:22,220-23,9541,734
– Gross Longs:27,9687,1953,490
– Gross Shorts:5,74831,1491,756
– Long to Short Ratio:4.9 to 10.2 to 12.0 to 1
NET POSITION TREND:
– COT Index Score (3 Year Range Pct):100.00.087.8
– COT Index Reading (3 Year Range):Bullish-ExtremeBearish-ExtremeBullish-Extreme
NET POSITION MOVEMENT INDEX:
– 6-Week Change in Strength Index:24.7-24.0-4.6


Russian Ruble Futures:

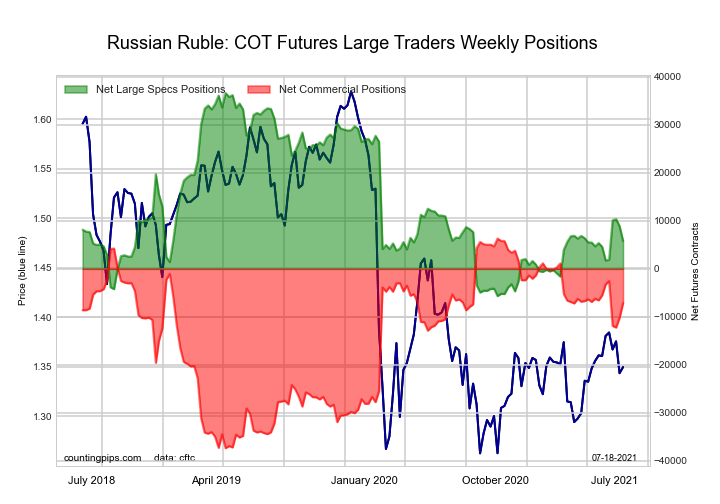
Ultra US Year Treasury Notes Long Bonds Futures COT ChartThe Russian Ruble large speculator standing this week recorded a net position of 5,791 contracts in the data reported through Tuesday. This was a weekly decline of -3,106 contracts from the previous week which had a total of 8,897 net contracts.

This week’s current strength score (the trader positioning range over the past three years, measured from 0 to 100) shows the speculators are currently Bearish with a score of 27.1 percent. The commercials are Bullish with a score of 69.2 percent and the small traders (not shown in chart) are Bullish-Extreme with a score of 82.8 percent.

RUSSIAN RUBLE StatisticsSPECULATORSCOMMERCIALSSMALL TRADERS
– Percent of Open Interest Longs:34.959.75.3
– Percent of Open Interest Shorts:23.074.32.6
– Net Position:5,791-7,1201,329
– Gross Longs:17,03629,1532,580
– Gross Shorts:11,24536,2731,251
– Long to Short Ratio:1.5 to 10.8 to 12.1 to 1
NET POSITION TREND:
– COT Index Score (3 Year Range Pct):27.169.282.8
– COT Index Reading (3 Year Range):BearishBullishBullish-Extreme
NET POSITION MOVEMENT INDEX:
– 6-Week Change in Strength Index:2.9-3.713.3


Bitcoin Futures:

Eurodollar Bonds Futures COT ChartThe Bitcoin large speculator standing this week recorded a net position of -1,167 contracts in the data reported through Tuesday. This was a weekly advance of 104 contracts from the previous week which had a total of -1,271 net contracts.

This week’s current strength score (the trader positioning range over the past three years, measured from 0 to 100) shows the speculators are currently Bullish with a score of 71.1 percent. The commercials are Bullish-Extreme with a score of 81.3 percent and the small traders (not shown in chart) are Bearish-Extreme with a score of 13.5 percent.

BITCOIN StatisticsSPECULATORSCOMMERCIALSSMALL TRADERS
– Percent of Open Interest Longs:62.87.621.6
– Percent of Open Interest Shorts:79.21.511.4
– Net Position:-1,167441726
– Gross Longs:4,4765451,542
– Gross Shorts:5,643104816
– Long to Short Ratio:0.8 to 15.2 to 11.9 to 1
NET POSITION TREND:
– COT Index Score (3 Year Range Pct):71.181.313.5
– COT Index Reading (3 Year Range):BullishBullish-ExtremeBearish-Extreme
NET POSITION MOVEMENT INDEX:
– 6-Week Change in Strength Index:7.813.6-13.0


Article By CountingPips.comReceive our weekly COT Reports by Email

*COT Report: The COT data, released weekly to the public each Friday, is updated through the most recent Tuesday (data is 3 days old) and shows a quick view of how large speculators or non-commercials (for-profit traders) were positioned in the futures markets.

The CFTC categorizes trader positions according to commercial hedgers (traders who use futures contracts for hedging as part of the business), non-commercials (large traders who speculate to realize trading profits) and nonreportable traders (usually small traders/speculators).

Find CFTC criteria here: (http://www.cftc.gov/MarketReports/CommitmentsofTraders/ExplanatoryNotes/index.htm).


COT Bonds Charts: Fed Funds, 10-Year, 2-Year, 5-Year, Eurodollars, Ultra Bond Futures

By CountingPips.com COT Home | Data Tables | Data Downloads | Newsletter

Here are the latest charts and statistics for the Commitment of Traders (COT) data published by the Commodities Futures Trading Commission (CFTC).

The latest COT data is updated through Tuesday July 13 2021 and shows a quick view of how large traders (for-profit speculators and commercial entities) were positioned in the futures markets.


3-Month Eurodollars Futures:

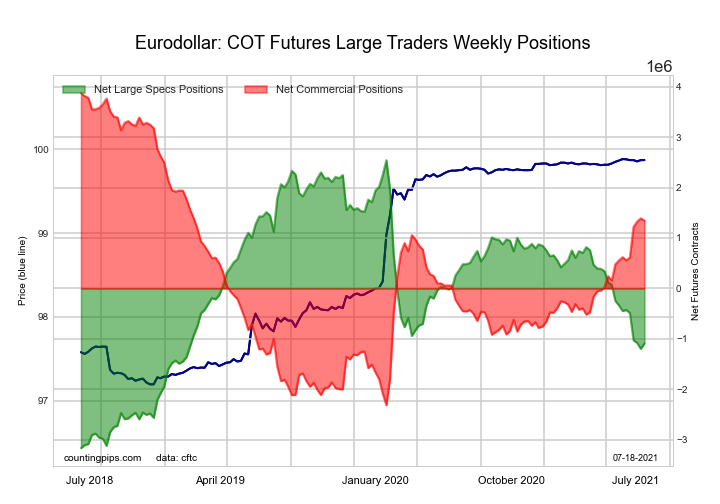
Eurodollar Bonds Futures COT ChartThe 3-Month Eurodollars large speculator standing this week equaled a net position of -1,092,200 contracts in the data reported through Tuesday. This was a weekly boost of 105,198 contracts from the previous week which had a total of -1,197,398 net contracts.

This week’s current strength score (the trader positioning range over the past three years, measured from 0 to 100) shows the speculators are currently Bearish with a score of 36.4 percent. The commercials are Bullish with a score of 59.1 percent and the small traders (not shown in chart) are Bullish with a score of 69.9 percent.

3-Month Eurodollars StatisticsSPECULATORSCOMMERCIALSSMALL TRADERS
– Percent of Open Interest Longs:13.861.24.7
– Percent of Open Interest Shorts:22.550.46.8
– Net Position:-1,092,2001,345,510-253,310
– Gross Longs:1,715,8867,628,830591,739
– Gross Shorts:2,808,0866,283,320845,049
– Long to Short Ratio:0.6 to 11.2 to 10.7 to 1
NET POSITION TREND:
– COT Index Score (3 Year Range Pct):36.459.169.9
– COT Index Reading (3 Year Range):BearishBullishBullish
NET POSITION MOVEMENT INDEX:
– 6-Week Change in Strength Index:-11.311.7-10.2


30-Day Federal Funds Futures:

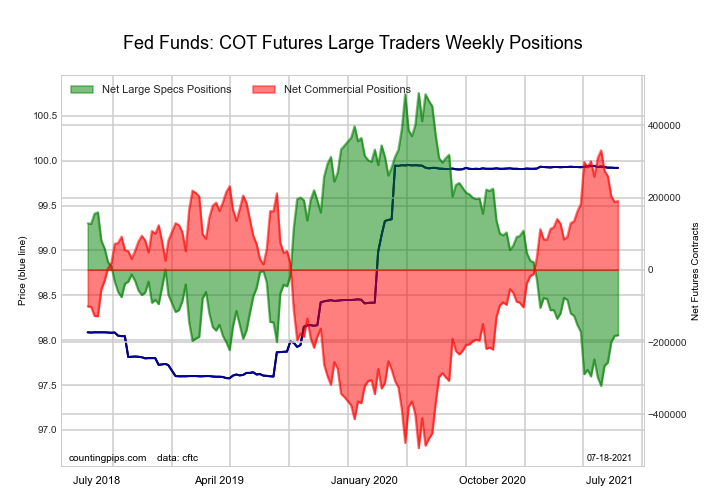
Federal Funds 30-Day Bonds Futures COT ChartThe 30-Day Federal Funds large speculator standing this week equaled a net position of -180,992 contracts in the data reported through Tuesday. This was a weekly rise of 1,479 contracts from the previous week which had a total of -182,471 net contracts.

This week’s current strength score (the trader positioning range over the past three years, measured from 0 to 100) shows the speculators are currently Bearish-Extreme with a score of 17.3 percent. The commercials are Bullish-Extreme with a score of 83.0 percent and the small traders (not shown in chart) are Bullish with a score of 53.8 percent.

30-Day Federal Funds StatisticsSPECULATORSCOMMERCIALSSMALL TRADERS
– Percent of Open Interest Longs:3.874.32.3
– Percent of Open Interest Shorts:20.656.63.2
– Net Position:-180,992190,473-9,481
– Gross Longs:40,886800,41424,897
– Gross Shorts:221,878609,94134,378
– Long to Short Ratio:0.2 to 11.3 to 10.7 to 1
NET POSITION TREND:
– COT Index Score (3 Year Range Pct):17.383.053.8
– COT Index Reading (3 Year Range):Bearish-ExtremeBullish-ExtremeBullish
NET POSITION MOVEMENT INDEX:
– 6-Week Change in Strength Index:14.3-14.44.9


2-Year Treasury Note Futures:

2-Year Treasury Bonds Futures COT ChartThe 2-Year Treasury Note large speculator standing this week equaled a net position of -131,440 contracts in the data reported through Tuesday. This was a weekly advance of 66,922 contracts from the previous week which had a total of -198,362 net contracts.

This week’s current strength score (the trader positioning range over the past three years, measured from 0 to 100) shows the speculators are currently Bullish with a score of 74.3 percent. The commercials are Bearish with a score of 42.2 percent and the small traders (not shown in chart) are Bearish with a score of 36.2 percent.

2-Year Treasury Note StatisticsSPECULATORSCOMMERCIALSSMALL TRADERS
– Percent of Open Interest Longs:18.571.87.0
– Percent of Open Interest Shorts:25.065.46.8
– Net Position:-131,440128,9082,532
– Gross Longs:370,8531,440,250139,891
– Gross Shorts:502,2931,311,342137,359
– Long to Short Ratio:0.7 to 11.1 to 11.0 to 1
NET POSITION TREND:
– COT Index Score (3 Year Range Pct):74.342.236.2
– COT Index Reading (3 Year Range):BullishBearishBearish
NET POSITION MOVEMENT INDEX:
– 6-Week Change in Strength Index:-12.616.3-19.2


5-Year Treasury Note Futures:

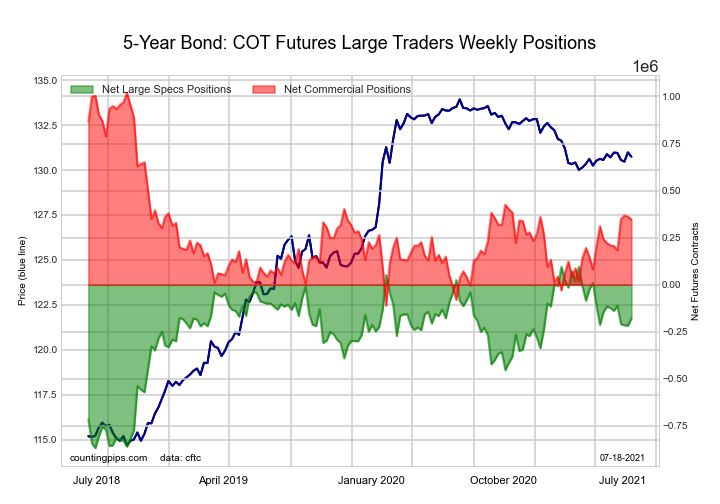
5-Year Treasury Bonds Futures COT ChartThe 5-Year Treasury Note large speculator standing this week equaled a net position of -178,076 contracts in the data reported through Tuesday. This was a weekly gain of 39,227 contracts from the previous week which had a total of -217,303 net contracts.

This week’s current strength score (the trader positioning range over the past three years, measured from 0 to 100) shows the speculators are currently Bullish with a score of 71.6 percent. The commercials are Bearish with a score of 40.5 percent and the small traders (not shown in chart) are Bearish-Extreme with a score of 0.0 percent.

5-Year Treasury Note StatisticsSPECULATORSCOMMERCIALSSMALL TRADERS
– Percent of Open Interest Longs:10.779.78.2
– Percent of Open Interest Shorts:15.969.613.0
– Net Position:-178,076346,911-168,835
– Gross Longs:370,5982,749,007281,311
– Gross Shorts:548,6742,402,096450,146
– Long to Short Ratio:0.7 to 11.1 to 10.6 to 1
NET POSITION TREND:
– COT Index Score (3 Year Range Pct):71.640.50.0
– COT Index Reading (3 Year Range):BullishBearishBearish-Extreme
NET POSITION MOVEMENT INDEX:
– 6-Week Change in Strength Index:-5.812.2-34.4


10-Year Treasury Note Futures:

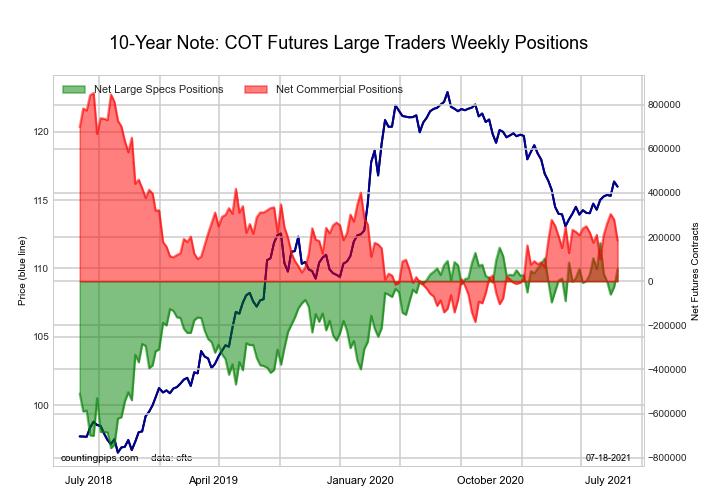
10-Year Treasury Notes Bonds Futures COT ChartThe 10-Year Treasury Note large speculator standing this week equaled a net position of 55,987 contracts in the data reported through Tuesday. This was a weekly rise of 81,580 contracts from the previous week which had a total of -25,593 net contracts.

This week’s current strength score (the trader positioning range over the past three years, measured from 0 to 100) shows the speculators are currently Bullish-Extreme with a score of 87.4 percent. The commercials are Bearish with a score of 35.5 percent and the small traders (not shown in chart) are Bearish-Extreme with a score of 10.5 percent.

10-Year Treasury Note StatisticsSPECULATORSCOMMERCIALSSMALL TRADERS
– Percent of Open Interest Longs:22.667.77.9
– Percent of Open Interest Shorts:21.263.313.7
– Net Position:55,987184,216-240,203
– Gross Longs:937,8022,814,625329,488
– Gross Shorts:881,8152,630,409569,691
– Long to Short Ratio:1.1 to 11.1 to 10.6 to 1
NET POSITION TREND:
– COT Index Score (3 Year Range Pct):87.435.510.5
– COT Index Reading (3 Year Range):Bullish-ExtremeBearishBearish-Extreme
NET POSITION MOVEMENT INDEX:
– 6-Week Change in Strength Index:0.1-2.56.7


Ultra 10-Year Notes Futures:

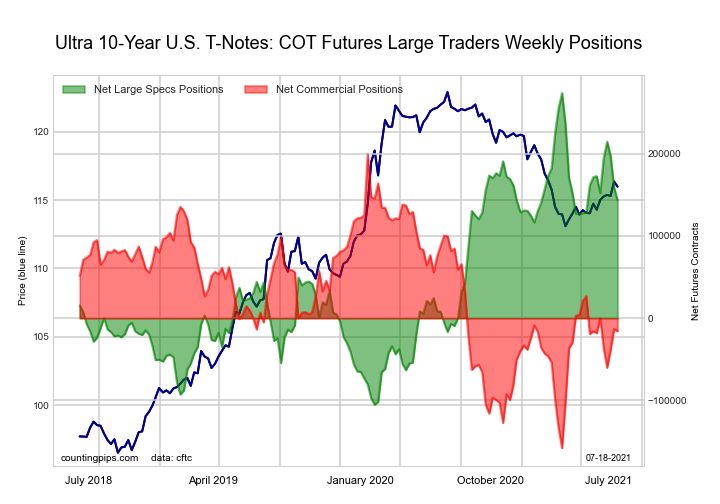
Ultra 10-Year Treasury Notes Bonds Futures COT ChartThe Ultra 10-Year Notes large speculator standing this week equaled a net position of 143,096 contracts in the data reported through Tuesday. This was a weekly decline of -15,817 contracts from the previous week which had a total of 158,913 net contracts.

This week’s current strength score (the trader positioning range over the past three years, measured from 0 to 100) shows the speculators are currently Bullish with a score of 65.5 percent. The commercials are Bearish with a score of 39.9 percent and the small traders (not shown in chart) are Bearish with a score of 23.6 percent.

Ultra 10-Year Notes StatisticsSPECULATORSCOMMERCIALSSMALL TRADERS
– Percent of Open Interest Longs:16.674.68.6
– Percent of Open Interest Shorts:7.375.616.9
– Net Position:143,096-15,671-127,425
– Gross Longs:255,5011,147,004131,996
– Gross Shorts:112,4051,162,675259,421
– Long to Short Ratio:2.3 to 11.0 to 10.5 to 1
NET POSITION TREND:
– COT Index Score (3 Year Range Pct):65.539.923.6
– COT Index Reading (3 Year Range):BullishBearishBearish
NET POSITION MOVEMENT INDEX:
– 6-Week Change in Strength Index:-7.80.720.3


US Treasury Bonds Futures:

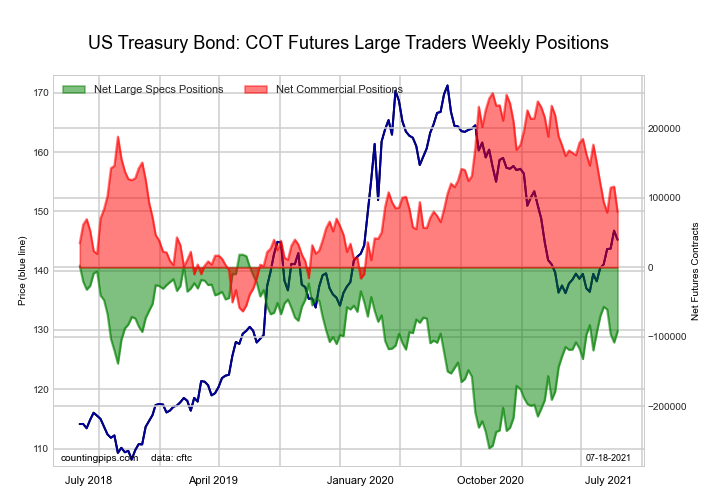
US Year Treasury Notes Long Bonds Futures COT ChartThe US Treasury Bonds large speculator standing this week equaled a net position of -91,910 contracts in the data reported through Tuesday. This was a weekly gain of 16,001 contracts from the previous week which had a total of -107,911 net contracts.

This week’s current strength score (the trader positioning range over the past three years, measured from 0 to 100) shows the speculators are currently Bullish with a score of 60.4 percent. The commercials are Bearish with a score of 45.5 percent and the small traders (not shown in chart) are Bullish with a score of 62.4 percent.

US Treasury Bonds StatisticsSPECULATORSCOMMERCIALSSMALL TRADERS
– Percent of Open Interest Longs:9.672.715.3
– Percent of Open Interest Shorts:17.266.014.3
– Net Position:-91,91079,59512,315
– Gross Longs:114,687872,231183,919
– Gross Shorts:206,597792,636171,604
– Long to Short Ratio:0.6 to 11.1 to 11.1 to 1
NET POSITION TREND:
– COT Index Score (3 Year Range Pct):60.445.562.4
– COT Index Reading (3 Year Range):BullishBearishBullish
NET POSITION MOVEMENT INDEX:
– 6-Week Change in Strength Index:0.7-22.454.3


Ultra US Treasury Bonds Futures:

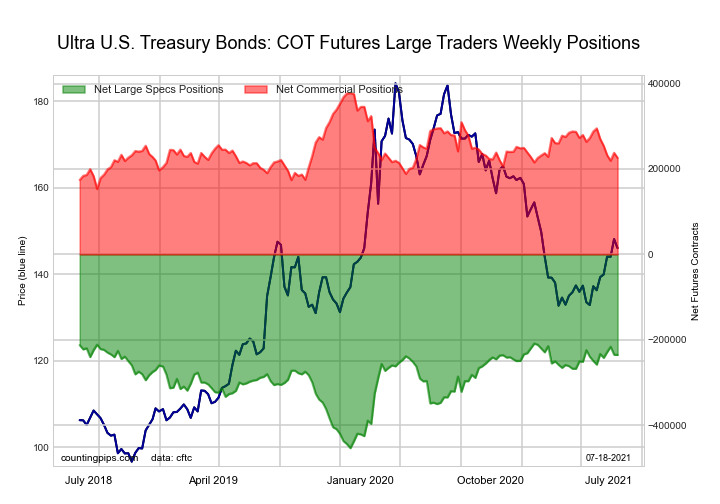
Ultra US Year Treasury Notes Long Bonds Futures COT ChartThe Ultra US Treasury Bonds large speculator standing this week equaled a net position of -235,633 contracts in the data reported through Tuesday. This was a weekly decline of -566 contracts from the previous week which had a total of -235,067 net contracts.

This week’s current strength score (the trader positioning range over the past three years, measured from 0 to 100) shows the speculators are currently Bullish-Extreme with a score of 89.1 percent. The commercials are Bearish with a score of 32.4 percent and the small traders (not shown in chart) are Bearish with a score of 35.1 percent.

Ultra US Treasury Bonds StatisticsSPECULATORSCOMMERCIALSSMALL TRADERS
– Percent of Open Interest Longs:9.378.312.1
– Percent of Open Interest Shorts:28.859.611.3
– Net Position:-235,633226,1159,518
– Gross Longs:112,383946,864146,304
– Gross Shorts:348,016720,749136,786
– Long to Short Ratio:0.3 to 11.3 to 11.1 to 1
NET POSITION TREND:
– COT Index Score (3 Year Range Pct):89.132.435.1
– COT Index Reading (3 Year Range):Bullish-ExtremeBearishBearish
NET POSITION MOVEMENT INDEX:
– 6-Week Change in Strength Index:9.2-30.833.4


Article By CountingPips.comReceive our weekly COT Reports by Email

*COT Report: The COT data, released weekly to the public each Friday, is updated through the most recent Tuesday (data is 3 days old) and shows a quick view of how large speculators or non-commercials (for-profit traders) were positioned in the futures markets.

The CFTC categorizes trader positions according to commercial hedgers (traders who use futures contracts for hedging as part of the business), non-commercials (large traders who speculate to realize trading profits) and nonreportable traders (usually small traders/speculators).

Find CFTC criteria here: (http://www.cftc.gov/MarketReports/CommitmentsofTraders/ExplanatoryNotes/index.htm).
COT Metals Charts: Comex Gold, Comex Silver, Copper, Platinum & Palladium Futures

By CountingPips.com COT Home | Data Tables | Data Downloads | Newsletter

Here are the latest charts and statistics for the Commitment of Traders (COT) data published by the Commodities Futures Trading Commission (CFTC).

The latest COT data is updated through Tuesday July 13 2021 and shows a quick view of how large traders (for-profit speculators and commercial entities) were positioned in the futures markets.


Gold Comex Futures:

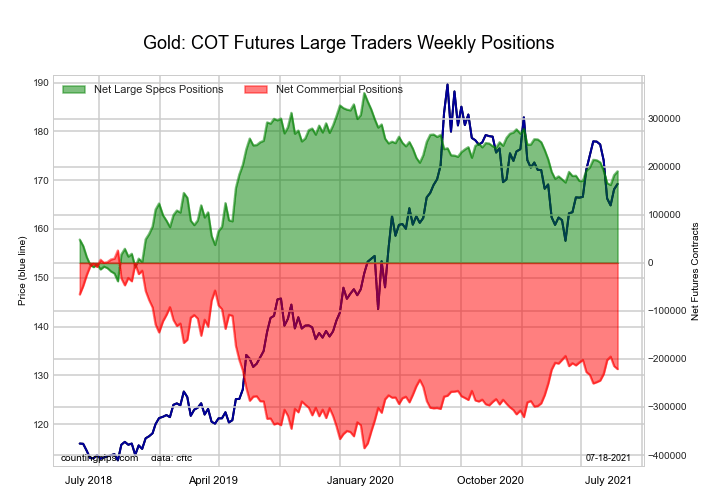
Federal Funds 30-Day Bonds Futures COT ChartThe Gold Comex Futures large speculator standing this week came in at a net position of 190,836 contracts in the data reported through Tuesday. This was a weekly advance of 8,015 contracts from the previous week which had a total of 182,821 net contracts.

This week’s current strength score (the trader positioning range over the past three years, measured from 0 to 100) shows the speculators are currently Bullish with a score of 58.4 percent. The commercials are Bearish with a score of 40.0 percent and the small traders (not shown in chart) are Bullish with a score of 56.8 percent.

Gold Futures StatisticsSPECULATORSCOMMERCIALSSMALL TRADERS
– Percent of Open Interest Longs:55.622.710.1
– Percent of Open Interest Shorts:17.167.34.0
– Net Position:190,836-221,02830,192
– Gross Longs:275,543112,43950,079
– Gross Shorts:84,707333,46719,887
– Long to Short Ratio:3.3 to 10.3 to 12.5 to 1
NET POSITION TREND:
– COT Index Score (3 Year Range Pct):58.440.056.8
– COT Index Reading (3 Year Range):BullishBearishBullish
NET POSITION MOVEMENT INDEX:
– 6-Week Change in Strength Index:-5.86.6-10.5


Silver Comex Futures:

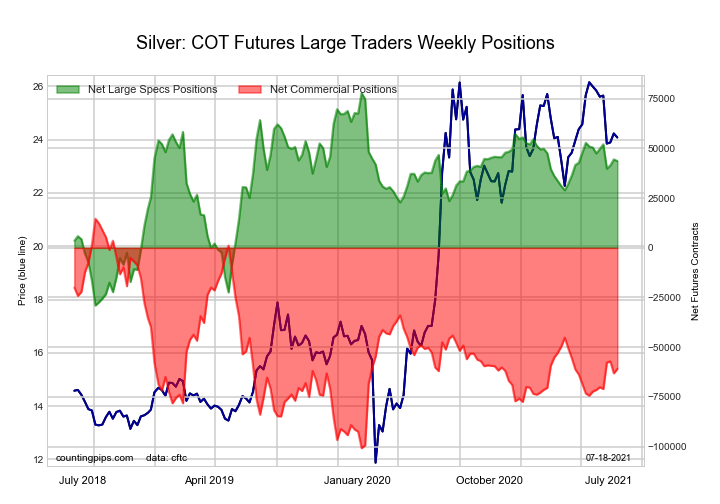
2-Year Treasury Bonds Futures COT ChartThe Silver Comex Futures large speculator standing this week came in at a net position of 43,689 contracts in the data reported through Tuesday. This was a weekly reduction of -799 contracts from the previous week which had a total of 44,488 net contracts.

This week’s current strength score (the trader positioning range over the past three years, measured from 0 to 100) shows the speculators are currently Bullish with a score of 68.0 percent. The commercials are Bearish with a score of 34.6 percent and the small traders (not shown in chart) are Bearish with a score of 40.8 percent.

Silver Futures StatisticsSPECULATORSCOMMERCIALSSMALL TRADERS
– Percent of Open Interest Longs:48.028.017.8
– Percent of Open Interest Shorts:19.867.46.7
– Net Position:43,689-60,86817,179
– Gross Longs:74,24743,32627,595
– Gross Shorts:30,558104,19410,416
– Long to Short Ratio:2.4 to 10.4 to 12.6 to 1
NET POSITION TREND:
– COT Index Score (3 Year Range Pct):68.034.640.8
– COT Index Reading (3 Year Range):BullishBearishBearish
NET POSITION MOVEMENT INDEX:
– 6-Week Change in Strength Index:-3.69.2-41.0


Copper Grade #1 Futures:

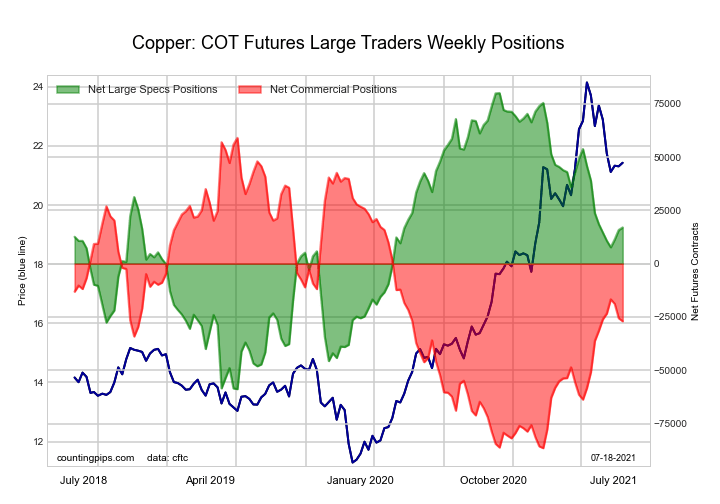
5-Year Treasury Bonds Futures COT ChartThe Copper Grade #1 Futures large speculator standing this week came in at a net position of 16,979 contracts in the data reported through Tuesday. This was a weekly boost of 1,206 contracts from the previous week which had a total of 15,773 net contracts.

This week’s current strength score (the trader positioning range over the past three years, measured from 0 to 100) shows the speculators are currently Bullish with a score of 54.6 percent. The commercials are Bearish with a score of 40.9 percent and the small traders (not shown in chart) are Bullish-Extreme with a score of 83.2 percent.

Copper Futures StatisticsSPECULATORSCOMMERCIALSSMALL TRADERS
– Percent of Open Interest Longs:41.538.010.3
– Percent of Open Interest Shorts:33.051.55.3
– Net Position:16,979-26,98810,009
– Gross Longs:82,97175,89520,675
– Gross Shorts:65,992102,88310,666
– Long to Short Ratio:1.3 to 10.7 to 11.9 to 1
NET POSITION TREND:
– COT Index Score (3 Year Range Pct):54.640.983.2
– COT Index Reading (3 Year Range):BullishBearishBullish-Extreme
NET POSITION MOVEMENT INDEX:
– 6-Week Change in Strength Index:-1.13.1-16.8


Platinum Futures:

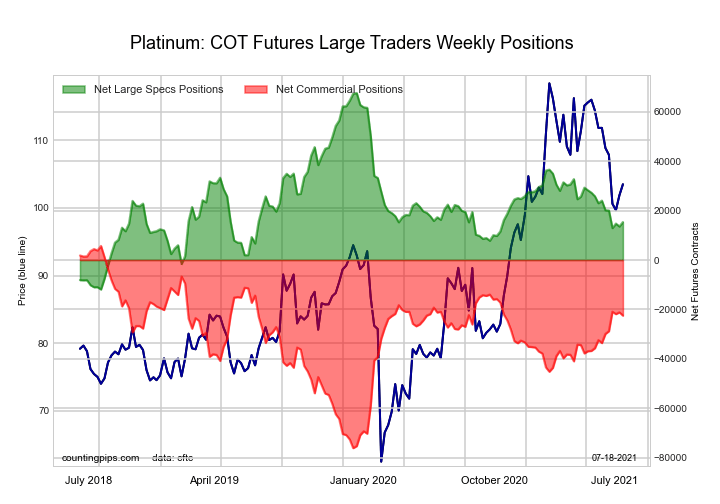
10-Year Treasury Notes Bonds Futures COT ChartThe Platinum Futures large speculator standing this week came in at a net position of 15,361 contracts in the data reported through Tuesday. This was a weekly lift of 1,785 contracts from the previous week which had a total of 13,576 net contracts.

This week’s current strength score (the trader positioning range over the past three years, measured from 0 to 100) shows the speculators are currently Bearish with a score of 34.3 percent. The commercials are Bullish with a score of 65.6 percent and the small traders (not shown in chart) are Bullish with a score of 61.5 percent.

Platinum Futures StatisticsSPECULATORSCOMMERCIALSSMALL TRADERS
– Percent of Open Interest Longs:51.628.416.9
– Percent of Open Interest Shorts:24.368.54.2
– Net Position:15,361-22,4927,131
– Gross Longs:28,99415,9579,487
– Gross Shorts:13,63338,4492,356
– Long to Short Ratio:2.1 to 10.4 to 14.0 to 1
NET POSITION TREND:
– COT Index Score (3 Year Range Pct):34.365.661.5
– COT Index Reading (3 Year Range):BearishBullishBullish
NET POSITION MOVEMENT INDEX:
– 6-Week Change in Strength Index:-10.913.6-34.1


Palladium Futures:

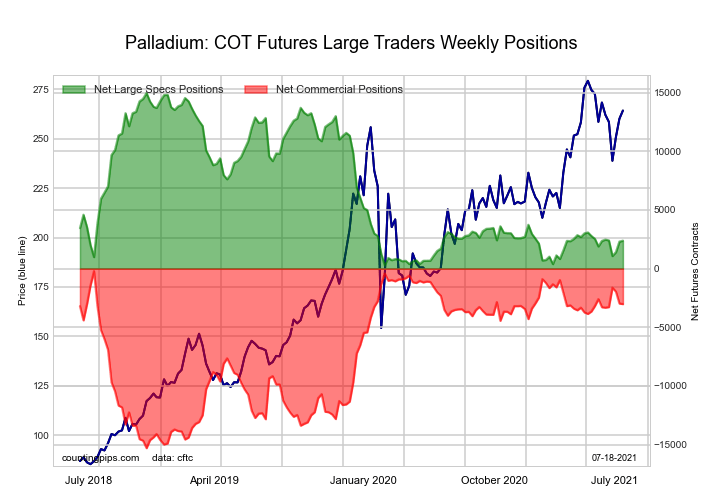
Ultra 10-Year Treasury Notes Bonds Futures COT ChartThe Palladium Futures large speculator standing this week came in at a net position of 2,381 contracts in the data reported through Tuesday. This was a weekly advance of 78 contracts from the previous week which had a total of 2,303 net contracts.

This week’s current strength score (the trader positioning range over the past three years, measured from 0 to 100) shows the speculators are currently Bearish-Extreme with a score of 14.2 percent. The commercials are Bullish-Extreme with a score of 81.4 percent and the small traders (not shown in chart) are Bullish-Extreme with a score of 82.7 percent.

Palladium Futures StatisticsSPECULATORSCOMMERCIALSSMALL TRADERS
– Percent of Open Interest Longs:54.230.013.7
– Percent of Open Interest Shorts:31.458.97.6
– Net Position:2,381-3,024643
– Gross Longs:5,6693,1391,436
– Gross Shorts:3,2886,163793
– Long to Short Ratio:1.7 to 10.5 to 11.8 to 1
NET POSITION TREND:
– COT Index Score (3 Year Range Pct):14.281.482.7
– COT Index Reading (3 Year Range):Bearish-ExtremeBullish-ExtremeBullish-Extreme
NET POSITION MOVEMENT INDEX:
– 6-Week Change in Strength Index:0.11.8-16.6


Article By CountingPips.comReceive our weekly COT Reports by Email

*COT Report: The COT data, released weekly to the public each Friday, is updated through the most recent Tuesday (data is 3 days old) and shows a quick view of how large speculators or non-commercials (for-profit traders) were positioned in the futures markets.

The CFTC categorizes trader positions according to commercial hedgers (traders who use futures contracts for hedging as part of the business), non-commercials (large traders who speculate to realize trading profits) and nonreportable traders (usually small traders/speculators).

Find CFTC criteria here: (http://www.cftc.gov/MarketReports/CommitmentsofTraders/ExplanatoryNotes/index.htm).
COT Stock Market Charts: VIX Volatility, Dow-Mini, Nasdaq, SP500-Mini, Emerging Markets

By CountingPips.com COT Home | Data Tables | Data Downloads | Newsletter

Here are the latest charts and statistics for the Commitment of Traders (COT) data published by the Commodities Futures Trading Commission (CFTC).

The latest COT data is updated through Tuesday July 13 2021 and shows a quick view of how large traders (for-profit speculators and commercial entities) were positioned in the futures markets.


VIX Volatility Futures:

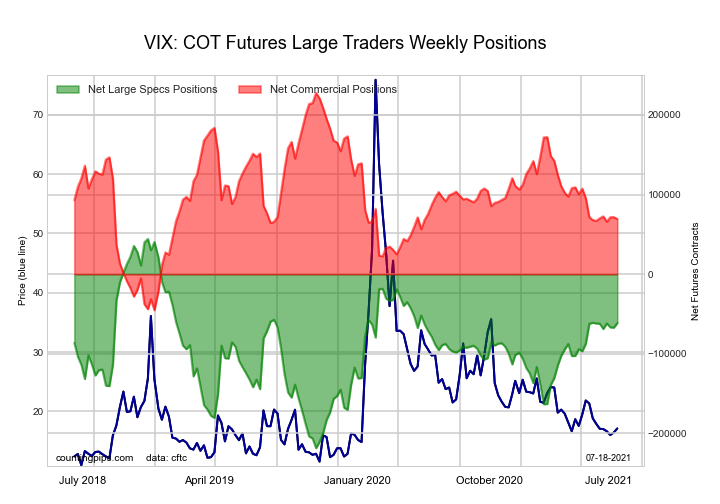
Federal Funds 30-Day Bonds Futures COT ChartThe VIX Volatility large speculator standing this week was a net position of -61,349 contracts in the data reported through Tuesday. This was a weekly boost of 5,749 contracts from the previous week which had a total of -67,098 net contracts.

This week’s current strength score (the trader positioning range over the past three years, measured from 0 to 100) shows the speculators are currently Bullish with a score of 59.8 percent. The commercials are Bearish with a score of 41.9 percent and the small traders (not shown in chart) are Bearish with a score of 26.6 percent.

VIX Volatility Futures StatisticsSPECULATORSCOMMERCIALSSMALL TRADERS
– Percent of Open Interest Longs:21.551.76.5
– Percent of Open Interest Shorts:40.530.29.0
– Net Position:-61,34969,199-7,850
– Gross Longs:69,112166,50621,021
– Gross Shorts:130,46197,30728,871
– Long to Short Ratio:0.5 to 11.7 to 10.7 to 1
NET POSITION TREND:
– COT Index Score (3 Year Range Pct):59.841.926.6
– COT Index Reading (3 Year Range):BullishBearishBearish
NET POSITION MOVEMENT INDEX:
– 6-Week Change in Strength Index:0.20.8-10.0


S&P500 Mini Futures:

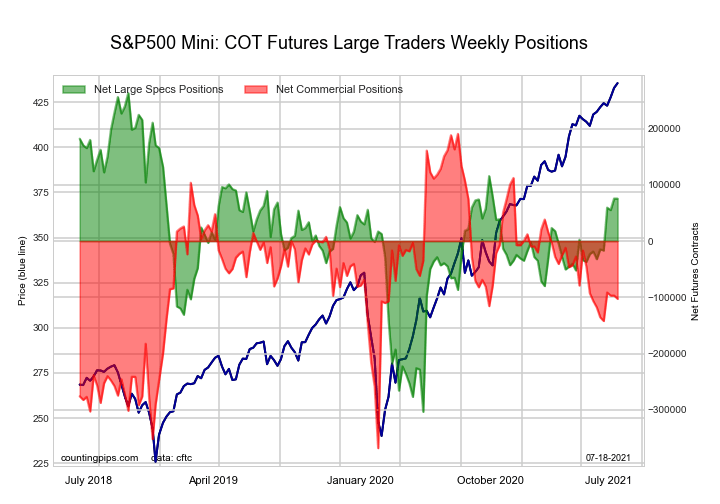
2-Year Treasury Bonds Futures COT ChartThe S&P500 Mini large speculator standing this week was a net position of 75,439 contracts in the data reported through Tuesday. This was a weekly reduction of -118 contracts from the previous week which had a total of 75,557 net contracts.

This week’s current strength score (the trader positioning range over the past three years, measured from 0 to 100) shows the speculators are currently Bullish with a score of 66.9 percent. The commercials are Bearish with a score of 47.5 percent and the small traders (not shown in chart) are Bearish with a score of 32.1 percent.

S&P500 Mini Futures StatisticsSPECULATORSCOMMERCIALSSMALL TRADERS
– Percent of Open Interest Longs:15.571.510.4
– Percent of Open Interest Shorts:12.675.49.4
– Net Position:75,439-102,54827,109
– Gross Longs:408,0651,882,685275,000
– Gross Shorts:332,6261,985,233247,891
– Long to Short Ratio:1.2 to 10.9 to 11.1 to 1
NET POSITION TREND:
– COT Index Score (3 Year Range Pct):66.947.532.1
– COT Index Reading (3 Year Range):BullishBearishBearish
NET POSITION MOVEMENT INDEX:
– 6-Week Change in Strength Index:19.02.7-25.7


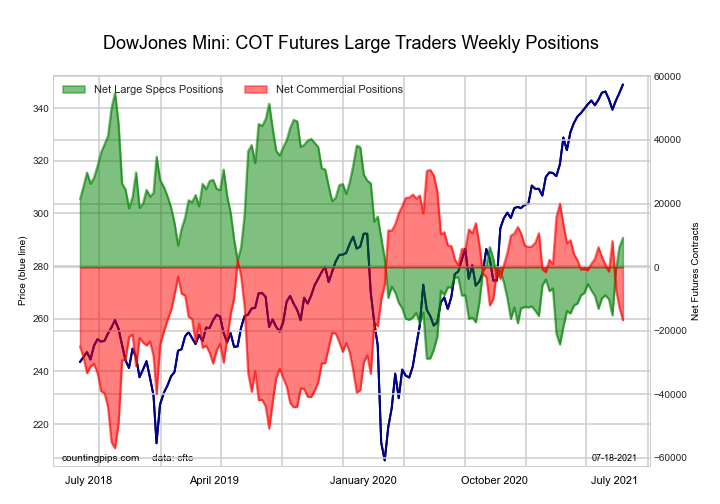
Dow Jones Mini Futures:

5-Year Treasury Bonds Futures COT ChartThe Dow Jones Mini large speculator standing this week was a net position of 9,211 contracts in the data reported through Tuesday. This was a weekly advance of 2,862 contracts from the previous week which had a total of 6,349 net contracts.

This week’s current strength score (the trader positioning range over the past three years, measured from 0 to 100) shows the speculators are currently Bearish with a score of 45.5 percent. The commercials are Bearish with a score of 46.0 percent and the small traders (not shown in chart) are Bullish with a score of 78.4 percent.

Dow Jones Mini Futures StatisticsSPECULATORSCOMMERCIALSSMALL TRADERS
– Percent of Open Interest Longs:41.839.916.7
– Percent of Open Interest Shorts:33.654.810.0
– Net Position:9,211-16,6867,475
– Gross Longs:46,67844,51318,638
– Gross Shorts:37,46761,19911,163
– Long to Short Ratio:1.2 to 10.7 to 11.7 to 1
NET POSITION TREND:
– COT Index Score (3 Year Range Pct):45.546.078.4
– COT Index Reading (3 Year Range):BearishBearishBullish
NET POSITION MOVEMENT INDEX:
– 6-Week Change in Strength Index:22.7-22.74.7


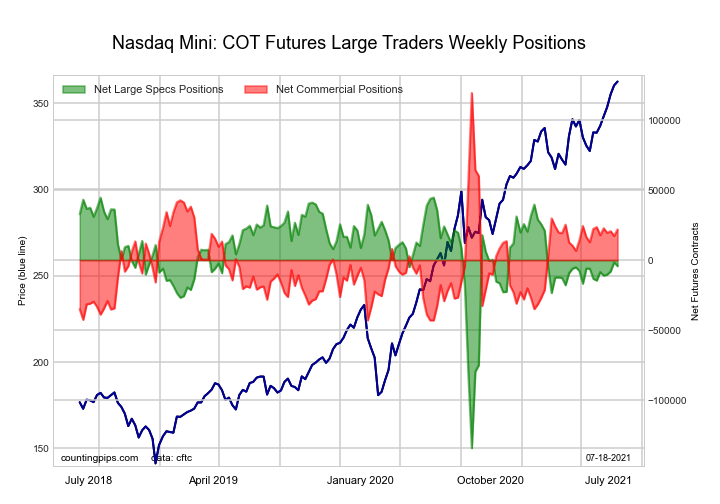
Nasdaq Mini Futures:

10-Year Treasury Notes Bonds Futures COT ChartThe Nasdaq Mini large speculator standing this week was a net position of -4,256 contracts in the data reported through Tuesday. This was a weekly decrease of -2,685 contracts from the previous week which had a total of -1,571 net contracts.

This week’s current strength score (the trader positioning range over the past three years, measured from 0 to 100) shows the speculators are currently Bullish with a score of 72.7 percent. The commercials are Bearish with a score of 40.0 percent and the small traders (not shown in chart) are Bearish-Extreme with a score of 4.3 percent.

Nasdaq Mini Futures StatisticsSPECULATORSCOMMERCIALSSMALL TRADERS
– Percent of Open Interest Longs:29.355.713.6
– Percent of Open Interest Shorts:31.146.221.2
– Net Position:-4,25621,933-17,677
– Gross Longs:67,964129,28631,534
– Gross Shorts:72,220107,35349,211
– Long to Short Ratio:0.9 to 11.2 to 10.6 to 1
NET POSITION TREND:
– COT Index Score (3 Year Range Pct):72.740.04.3
– COT Index Reading (3 Year Range):BullishBearishBearish-Extreme
NET POSITION MOVEMENT INDEX:
– 6-Week Change in Strength Index:5.7-1.0-19.4


Russell 2000 Mini Futures:

Ultra 10-Year Treasury Notes Bonds Futures COT ChartThe Russell 2000 Mini large speculator standing this week was a net position of -43,092 contracts in the data reported through Tuesday. This was a weekly reduction of -1,185 contracts from the previous week which had a total of -41,907 net contracts.

This week’s current strength score (the trader positioning range over the past three years, measured from 0 to 100) shows the speculators are currently Bearish with a score of 31.0 percent. The commercials are Bullish with a score of 67.5 percent and the small traders (not shown in chart) are Bullish with a score of 53.6 percent.

Russell 2000 Mini Futures StatisticsSPECULATORSCOMMERCIALSSMALL TRADERS
– Percent of Open Interest Longs:12.080.16.9
– Percent of Open Interest Shorts:22.271.65.2
– Net Position:-43,09235,8267,266
– Gross Longs:50,612337,53629,122
– Gross Shorts:93,704301,71021,856
– Long to Short Ratio:0.5 to 11.1 to 11.3 to 1
NET POSITION TREND:
– COT Index Score (3 Year Range Pct):31.067.553.6
– COT Index Reading (3 Year Range):BearishBullishBullish
NET POSITION MOVEMENT INDEX:
– 6-Week Change in Strength Index:-5.24.04.4


Nikkei Stock Average (USD) Futures:

US Year Treasury Notes Long Bonds Futures COT ChartThe Nikkei Stock Average (USD) large speculator standing this week was a net position of -6,291 contracts in the data reported through Tuesday. This was a weekly decrease of -2,038 contracts from the previous week which had a total of -4,253 net contracts.

This week’s current strength score (the trader positioning range over the past three years, measured from 0 to 100) shows the speculators are currently Bearish with a score of 32.8 percent. The commercials are Bullish with a score of 78.4 percent and the small traders (not shown in chart) are Bearish-Extreme with a score of 8.1 percent.

Nikkei Stock Average Futures StatisticsSPECULATORSCOMMERCIALSSMALL TRADERS
– Percent of Open Interest Longs:16.659.423.9
– Percent of Open Interest Shorts:56.512.031.4
– Net Position:-6,2917,480-1,189
– Gross Longs:2,6219,3773,772
– Gross Shorts:8,9121,8974,961
– Long to Short Ratio:0.3 to 14.9 to 10.8 to 1
NET POSITION TREND:
– COT Index Score (3 Year Range Pct):32.878.48.1
– COT Index Reading (3 Year Range):BearishBullishBearish-Extreme
NET POSITION MOVEMENT INDEX:
– 6-Week Change in Strength Index:-7.216.5-31.8


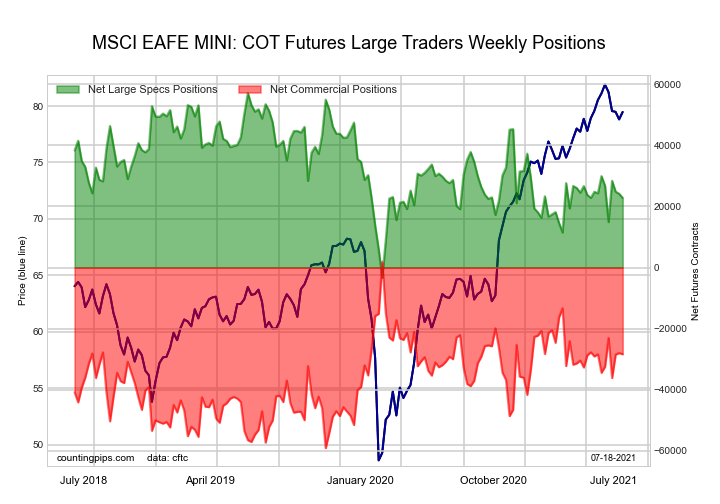
MSCI EAFE Mini Futures:

Ultra US Year Treasury Notes Long Bonds Futures COT ChartThe MSCI EAFE Mini large speculator standing this week was a net position of 22,826 contracts in the data reported through Tuesday. This was a weekly decrease of -1,350 contracts from the previous week which had a total of 24,176 net contracts.

This week’s current strength score (the trader positioning range over the past three years, measured from 0 to 100) shows the speculators are currently Bearish with a score of 43.3 percent. The commercials are Bullish with a score of 50.4 percent and the small traders (not shown in chart) are Bullish with a score of 66.6 percent.

MSCI EAFE Mini Futures StatisticsSPECULATORSCOMMERCIALSSMALL TRADERS
– Percent of Open Interest Longs:8.988.12.6
– Percent of Open Interest Shorts:3.594.81.3
– Net Position:22,826-28,4105,584
– Gross Longs:37,951376,71211,289
– Gross Shorts:15,125405,1225,705
– Long to Short Ratio:2.5 to 10.9 to 12.0 to 1
NET POSITION TREND:
– COT Index Score (3 Year Range Pct):43.350.466.6
– COT Index Reading (3 Year Range):BearishBullishBullish
NET POSITION MOVEMENT INDEX:
– 6-Week Change in Strength Index:-11.89.99.7


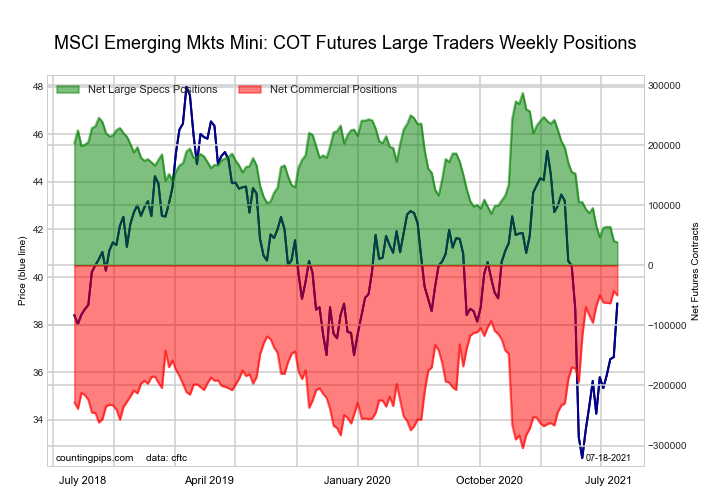
MSCI Emerging Mkts Mini Futures:

Eurodollar Bonds Futures COT ChartThe MSCI Emerging Mkts Mini large speculator standing this week was a net position of 38,211 contracts in the data reported through Tuesday. This was a weekly decline of -2,219 contracts from the previous week which had a total of 40,430 net contracts.

This week’s current strength score (the trader positioning range over the past three years, measured from 0 to 100) shows the speculators are currently Bearish-Extreme with a score of 0.0 percent. The commercials are Bullish-Extreme with a score of 97.2 percent and the small traders (not shown in chart) are Bearish with a score of 40.4 percent.

MSCI Emerging Mkts Mini Futures StatisticsSPECULATORSCOMMERCIALSSMALL TRADERS
– Percent of Open Interest Longs:14.382.22.4
– Percent of Open Interest Shorts:11.086.51.3
– Net Position:38,211-49,88611,675
– Gross Longs:165,150950,68527,250
– Gross Shorts:126,9391,000,57115,575
– Long to Short Ratio:1.3 to 11.0 to 11.7 to 1
NET POSITION TREND:
– COT Index Score (3 Year Range Pct):0.097.240.4
– COT Index Reading (3 Year Range):Bearish-ExtremeBullish-ExtremeBearish
NET POSITION MOVEMENT INDEX:
– 6-Week Change in Strength Index:-11.06.87.3


Article By CountingPips.comReceive our weekly COT Reports by Email

*COT Report: The COT data, released weekly to the public each Friday, is updated through the most recent Tuesday (data is 3 days old) and shows a quick view of how large speculators or non-commercials (for-profit traders) were positioned in the futures markets.

The CFTC categorizes trader positions according to commercial hedgers (traders who use futures contracts for hedging as part of the business), non-commercials (large traders who speculate to realize trading profits) and nonreportable traders (usually small traders/speculators).

Find CFTC criteria here: (http://www.cftc.gov/MarketReports/CommitmentsofTraders/ExplanatoryNotes/index.htm).

COT Energy Charts: WTI Crude Oil, Natural Gas, Bloomberg Index, Heating Oil & Brent Oil Futures

By CountingPips.com COT Home | Data Tables | Data Downloads | Newsletter

Here are the latest charts and statistics for the Commitment of Traders (COT) data published by the Commodities Futures Trading Commission (CFTC).
The latest COT data is updated through Tuesday July 13 2021 and shows a quick view of how large traders (for-profit speculators and commercial entities) were positioned in the futures markets.


WTI Crude Oil Futures :

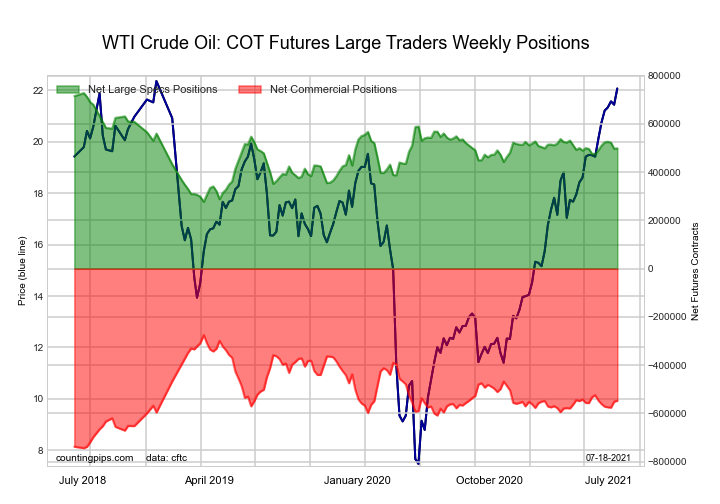
WTI Crude Oil Futures COT ChartThe WTI Crude Oil Futures large speculator standing this week resulted in a net position of 499,096 contracts in the data reported through Tuesday. This was a weekly increase of 1,745 contracts from the previous week which had a total of 497,351 net contracts.

This week’s current strength score (the trader positioning range over the past three years, measured from 0 to 100) shows the speculators are currently Bullish with a score of 66.0 percent. The commercials are Bearish with a score of 27.8 percent and the small traders (not shown in chart) are Bullish-Extreme with a score of 83.3 percent.

WTI Crude Oil Futures StatisticsSPECULATORSCOMMERCIALSSMALL TRADERS
– Percent of Open Interest Longs:26.434.04.5
– Percent of Open Interest Shorts:5.756.72.5
– Net Position:499,096-547,55548,459
– Gross Longs:636,318819,975108,781
– Gross Shorts:137,2221,367,53060,322
– Long to Short Ratio:4.6 to 10.6 to 11.8 to 1
NET POSITION TREND:
– COT Index Score (3 Year Range Pct):66.027.883.3
– COT Index Reading (3 Year Range):BullishBearishBullish-Extreme
NET POSITION MOVEMENT INDEX:
– 6-Week Change in Strength Index:2.3-0.3-9.6


Brent Crude Oil Futures :

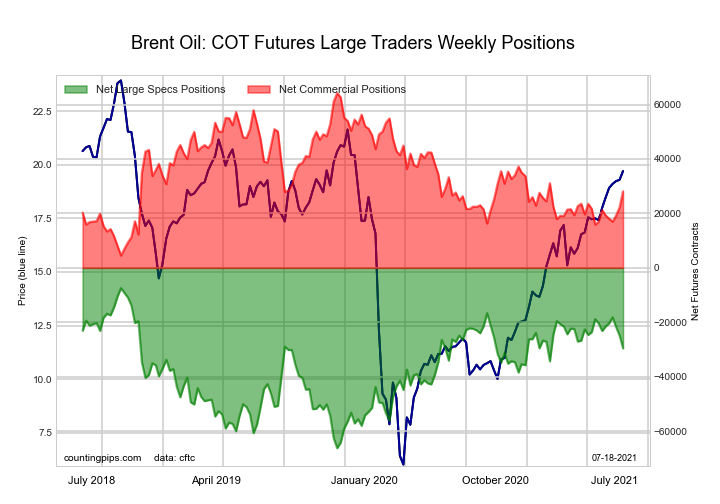
Brent Last Day Crude Oil Futures COT ChartThe Brent Crude Oil Futures large speculator standing this week resulted in a net position of -29,547 contracts in the data reported through Tuesday. This was a weekly reduction of -4,701 contracts from the previous week which had a total of -24,846 net contracts.

This week’s current strength score (the trader positioning range over the past three years, measured from 0 to 100) shows the speculators are currently Bullish with a score of 62.4 percent. The commercials are Bearish with a score of 39.5 percent and the small traders (not shown in chart) are Bearish with a score of 47.9 percent.

Brent Crude Oil Futures StatisticsSPECULATORSCOMMERCIALSSMALL TRADERS
– Percent of Open Interest Longs:17.754.84.6
– Percent of Open Interest Shorts:32.940.33.9
– Net Position:-29,54728,1251,422
– Gross Longs:34,315106,2238,921
– Gross Shorts:63,86278,0987,499
– Long to Short Ratio:0.5 to 11.4 to 11.2 to 1
NET POSITION TREND:
– COT Index Score (3 Year Range Pct):62.439.547.9
– COT Index Reading (3 Year Range):BullishBearishBearish
NET POSITION MOVEMENT INDEX:
– 6-Week Change in Strength Index:-10.811.6-4.7


Natural Gas Futures :

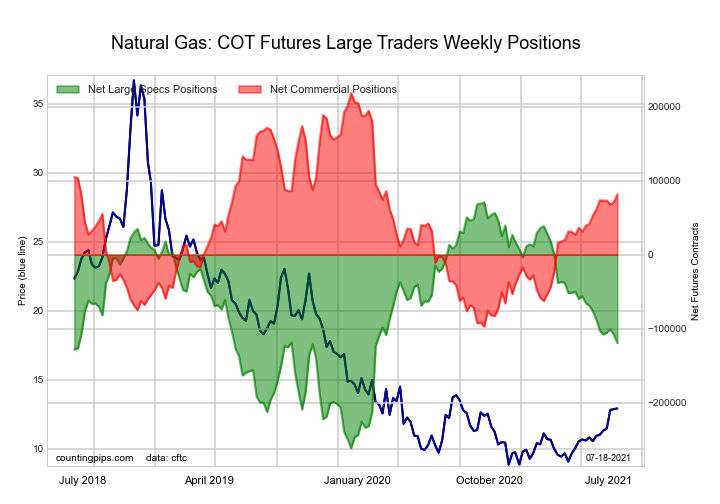
Natural Gas Futures COT ChartThe Natural Gas Futures large speculator standing this week resulted in a net position of -119,404 contracts in the data reported through Tuesday. This was a weekly reduction of -11,350 contracts from the previous week which had a total of -108,054 net contracts.

This week’s current strength score (the trader positioning range over the past three years, measured from 0 to 100) shows the speculators are currently Bearish with a score of 42.7 percent. The commercials are Bullish with a score of 56.6 percent and the small traders (not shown in chart) are Bullish with a score of 67.6 percent.

Natural Gas Futures StatisticsSPECULATORSCOMMERCIALSSMALL TRADERS
– Percent of Open Interest Longs:24.440.54.3
– Percent of Open Interest Shorts:32.634.91.7
– Net Position:-119,40481,78037,624
– Gross Longs:355,814590,81562,749
– Gross Shorts:475,218509,03525,125
– Long to Short Ratio:0.7 to 11.2 to 12.5 to 1
NET POSITION TREND:
– COT Index Score (3 Year Range Pct):42.756.667.6
– COT Index Reading (3 Year Range):BearishBullishBullish
NET POSITION MOVEMENT INDEX:
– 6-Week Change in Strength Index:-9.66.437.5


Gasoline Blendstock Futures :

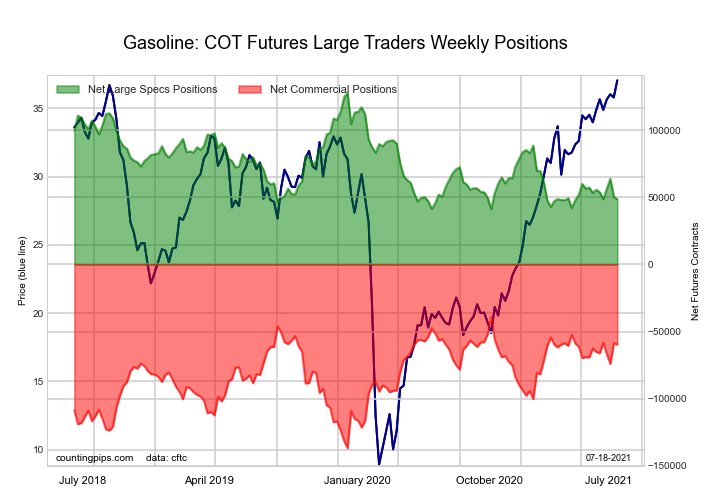
RBOB Gasoline Energy Futures COT ChartThe Gasoline Blendstock Futures large speculator standing this week resulted in a net position of 48,570 contracts in the data reported through Tuesday. This was a weekly decrease of -1,847 contracts from the previous week which had a total of 50,417 net contracts.

This week’s current strength score (the trader positioning range over the past three years, measured from 0 to 100) shows the speculators are currently Bearish-Extreme with a score of 8.6 percent. The commercials are Bullish with a score of 79.2 percent and the small traders (not shown in chart) are Bullish with a score of 77.2 percent.

Nasdaq Mini Futures StatisticsSPECULATORSCOMMERCIALSSMALL TRADERS
– Percent of Open Interest Longs:25.646.46.7
– Percent of Open Interest Shorts:12.362.73.7
– Net Position:48,570-59,55010,980
– Gross Longs:93,548169,71624,492
– Gross Shorts:44,978229,26613,512
– Long to Short Ratio:2.1 to 10.7 to 11.8 to 1
NET POSITION TREND:
– COT Index Score (3 Year Range Pct):8.679.277.2
– COT Index Reading (3 Year Range):Bearish-ExtremeBullishBullish
NET POSITION MOVEMENT INDEX:
– 6-Week Change in Strength Index:-8.25.88.7


#2 Heating Oil NY-Harbor Futures :

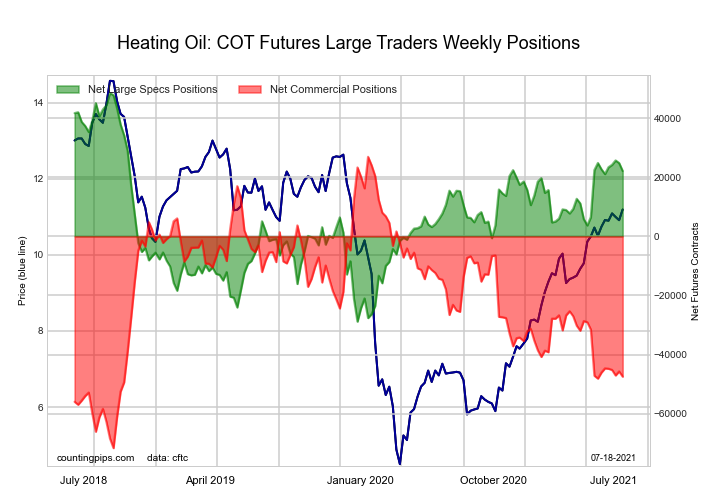
NY Harbor Heating Oil Energy Futures COT ChartThe #2 Heating Oil NY-Harbor Futures large speculator standing this week resulted in a net position of 22,140 contracts in the data reported through Tuesday. This was a weekly lowering of -2,681 contracts from the previous week which had a total of 24,821 net contracts.

This week’s current strength score (the trader positioning range over the past three years, measured from 0 to 100) shows the speculators are currently Bullish with a score of 65.9 percent. The commercials are Bearish with a score of 24.5 percent and the small traders (not shown in chart) are Bullish-Extreme with a score of 99.9 percent.

Heating Oil Futures StatisticsSPECULATORSCOMMERCIALSSMALL TRADERS
– Percent of Open Interest Longs:15.750.311.4
– Percent of Open Interest Shorts:10.461.75.4
– Net Position:22,140-47,47325,333
– Gross Longs:65,362209,53647,696
– Gross Shorts:43,222257,00922,363
– Long to Short Ratio:1.5 to 10.8 to 12.1 to 1
NET POSITION TREND:
– COT Index Score (3 Year Range Pct):65.924.599.9
– COT Index Reading (3 Year Range):BullishBearishBullish-Extreme
NET POSITION MOVEMENT INDEX:
– 6-Week Change in Strength Index:-0.7-1.47.8


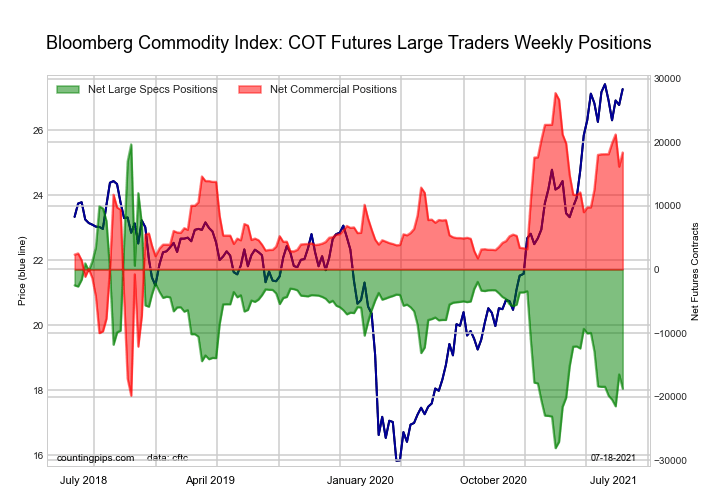
Bloomberg Commodity Index Futures :

Bloomberg Commodity Index Futures COT ChartThe Bloomberg Commodity Index Futures large speculator standing this week resulted in a net position of -18,762 contracts in the data reported through Tuesday. This was a weekly lowering of -2,249 contracts from the previous week which had a total of -16,513 net contracts.

This week’s current strength score (the trader positioning range over the past three years, measured from 0 to 100) shows the speculators are currently Bearish-Extreme with a score of 19.6 percent. The commercials are Bullish-Extreme with a score of 80.4 percent and the small traders (not shown in chart) are Bearish with a score of 40.0 percent.

Bloomberg Index Futures StatisticsSPECULATORSCOMMERCIALSSMALL TRADERS
– Percent of Open Interest Longs:45.053.41.1
– Percent of Open Interest Shorts:91.08.30.3
– Net Position:-18,76218,404358
– Gross Longs:18,36321,804469
– Gross Shorts:37,1253,400111
– Long to Short Ratio:0.5 to 16.4 to 14.2 to 1
NET POSITION TREND:
– COT Index Score (3 Year Range Pct):19.680.440.0
– COT Index Reading (3 Year Range):Bearish-ExtremeBullish-ExtremeBearish
NET POSITION MOVEMENT INDEX:
– 6-Week Change in Strength Index:-0.60.60.7


Article By CountingPips.comReceive our weekly COT Reports by Email

*COT Report: The COT data, released weekly to the public each Friday, is updated through the most recent Tuesday (data is 3 days old) and shows a quick view of how large speculators or non-commercials (for-profit traders) were positioned in the futures markets.

The CFTC categorizes trader positions according to commercial hedgers (traders who use futures contracts for hedging as part of the business), non-commercials (large traders who speculate to realize trading profits) and nonreportable traders (usually small traders/speculators).

Find CFTC criteria here: (http://www.cftc.gov/MarketReports/CommitmentsofTraders/ExplanatoryNotes/index.htm).