
By Dmitriy Gurkovskiy, Chief Analyst at RoboForex
Early in another July week, the major currency pair is falling amid market players’ sympathies towards the American currency. EUR/USD is trading at 1.1810.
The “greenback” got some significant support from the latest report on the retail sales in the USA, which showed 0.6% m/m in June after being -1.7% m/m the month before and against the expected reading of -0.4% m/m. The Core Retail Sales report showed 1.3% m/m against market expectations of 0.4% m/m. Despite the fact that Americans are currently spending more money on services, the demand for goods remains quite high.
The preliminary report on the Consumer Sentiment from the University of Michigan disappointed but was barely noticed by investors. Nevertheless, the indicator dropped to 80.0 points in July after being 85.5 points in the previous months, although it was expected to reach 86.5 points.
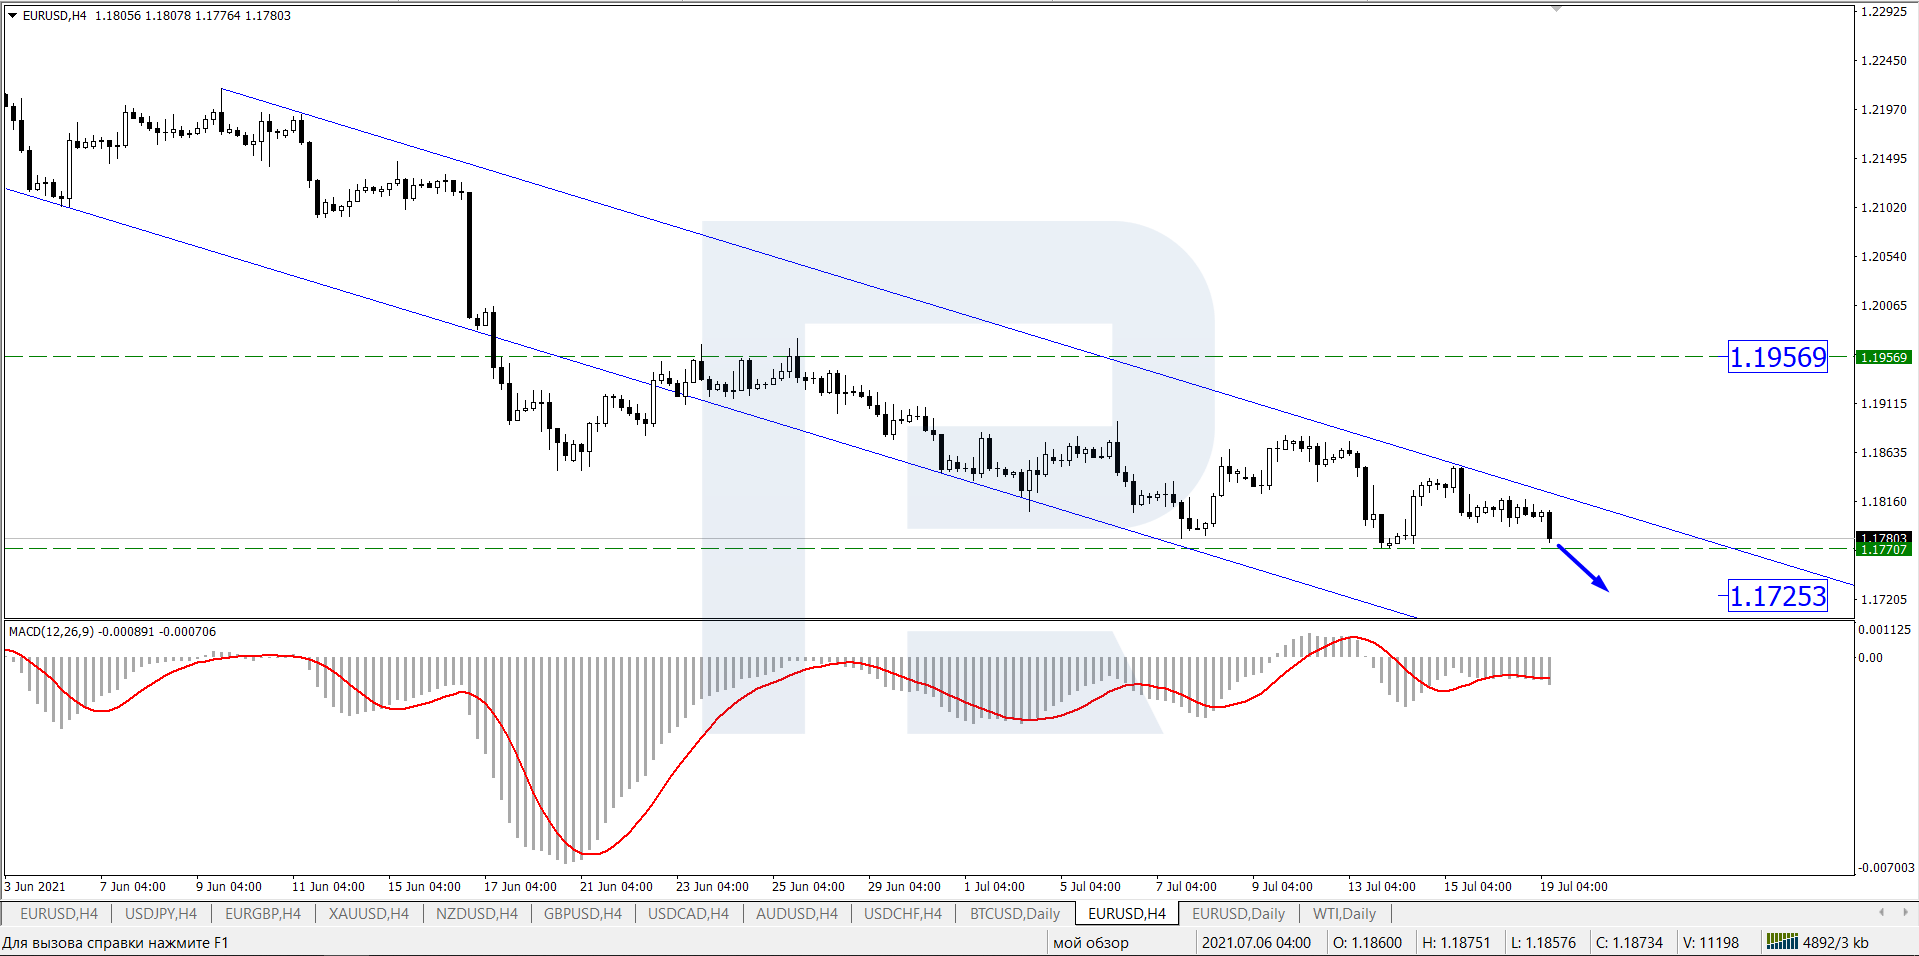
In the H4 chart, EUR/USD is forming another descending wave with the target at 1.1725. After testing this level, the instrument may continue falling. From the technical point of view, this scenario is confirmed by MACD Oscillator: its signal line is moving below 0, thus indicating that the descending wave continues.
Free Reports:
 Get our Weekly Commitment of Traders Reports - See where the biggest traders (Hedge Funds and Commercial Hedgers) are positioned in the futures markets on a weekly basis.
 Sign Up for Our Stock Market Newsletter – Get updated on News, Charts & Rankings of Public Companies when you join our Stocks Newsletter
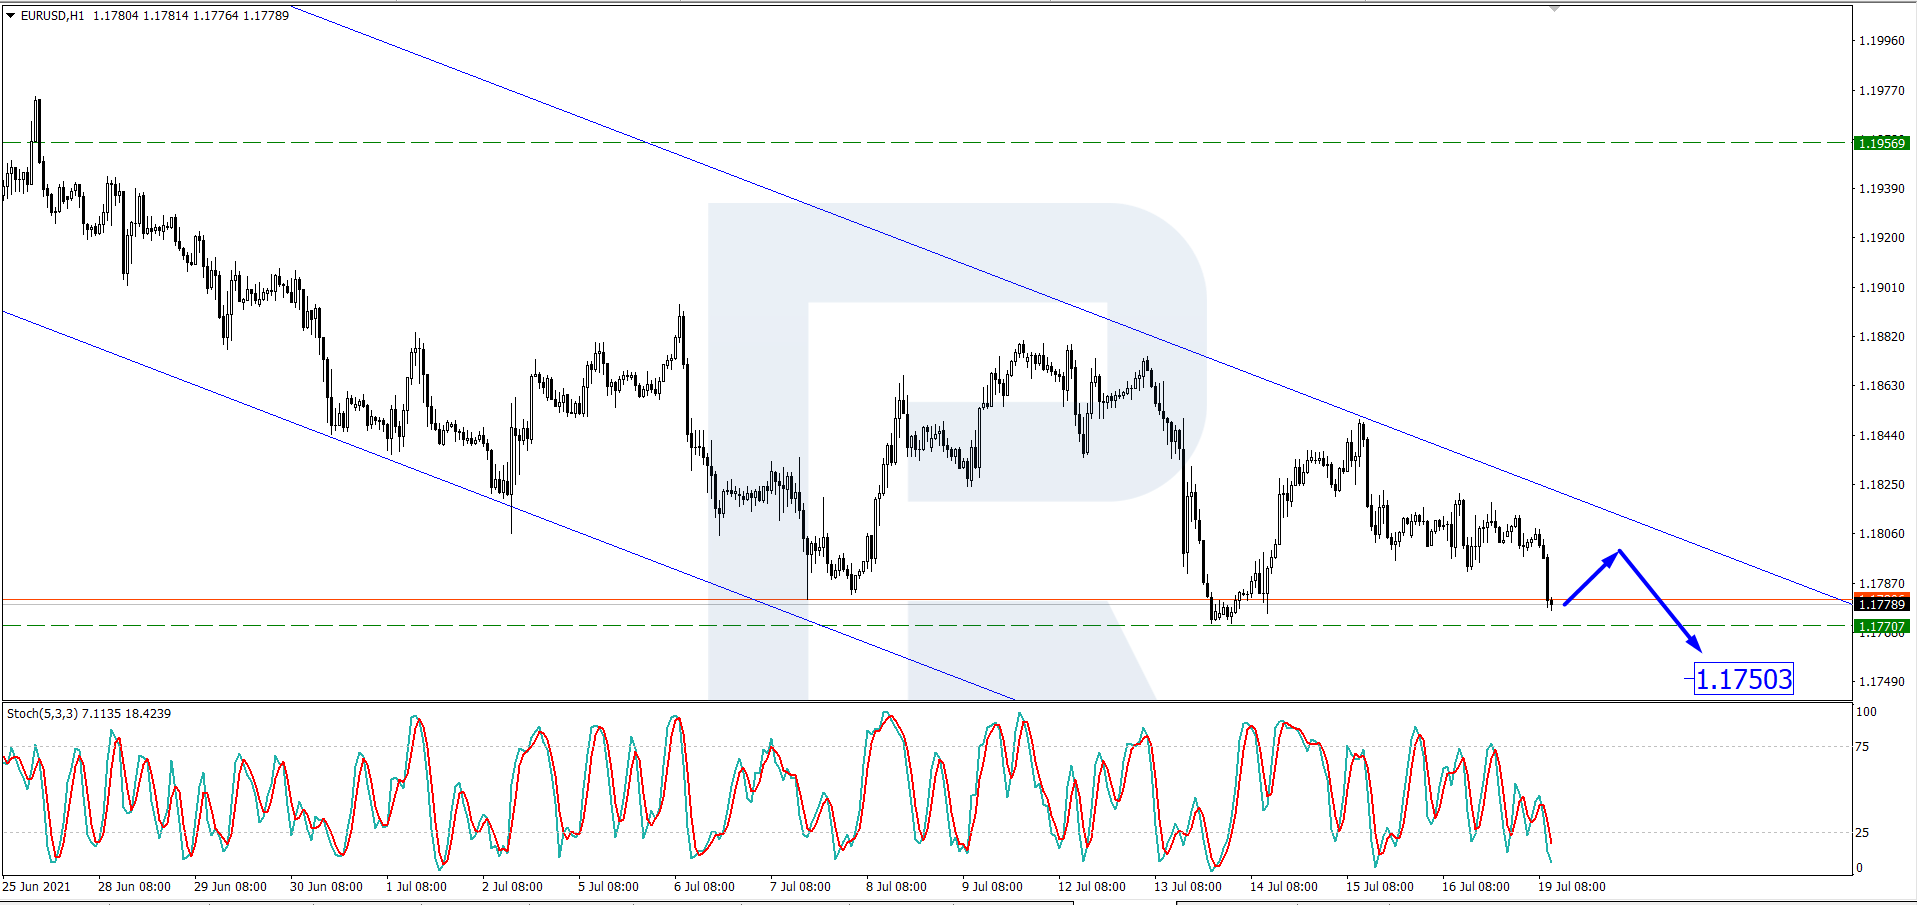
As we can see in the H1 chart, the asset is also trading downwards and may soon reach 1.1750. Later, the market may form a new correction and then resume trading downwards with the target at 1.1725. From the technical point of view, this scenario is confirmed by the Stochastic Oscillator: its signal line is steadily moving downwards below 25.
Disclaimer
Any forecasts contained herein are based on the author’s particular opinion. This analysis may not be treated as trading advice. RoboForex bears no responsibility for trading results based on trading recommendations and reviews contained herein.

- COT Metals Charts: Weekly Speculator Bets led by Copper & Steel Jul 18, 2026
- COT Bonds Charts: Weekly Speculator Bets led by 2-Year, SOFR 3M & 5-Year Bonds Jul 18, 2026
- COT Energy Charts: Weekly Speculator Bets led by Brent Oil & Heating Oil Jul 18, 2026
- COT Soft Commodities Charts: Weekly Speculator Bets led by Wheat, Corn & Soybean Meal Jul 18, 2026
- The Bank of Canada kept its interest rate unchanged. Platinum prices reached a three‑week high Jul 16, 2026
- Stock indices rose after the release of US inflation data. China’s GDP slowed sharply Jul 15, 2026
- GBP/USD Awaits Political News: What Will Happen Next Jul 15, 2026
- USD/JPY Holds at Highs: Pressure Lingers on Yen Jul 14, 2026
- Oil prices jumped 4% amid a new wave of escalation between the US and Iran Jul 13, 2026
- EUR/USD: US Inflation Will Determine Everything Jul 13, 2026
