
By CountingPips.com COT Home | Data Tables | Data Downloads | Newsletter
Here are the latest charts and statistics for the Commitment of Traders (COT) data published by the Commodities Futures Trading Commission (CFTC).
The latest COT data is updated through Tuesday July 13 2021 and shows a quick view of how large traders (for-profit speculators and commercial entities) were positioned in the futures markets.
VIX Volatility Futures:
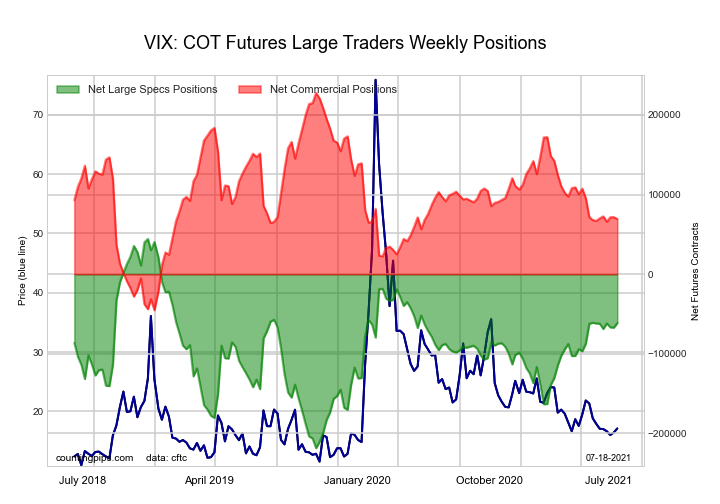 The VIX Volatility large speculator standing this week was a net position of -61,349 contracts in the data reported through Tuesday. This was a weekly boost of 5,749 contracts from the previous week which had a total of -67,098 net contracts.
This week’s current strength score (the trader positioning range over the past three years, measured from 0 to 100) shows the speculators are currently Bullish with a score of 59.8 percent. The commercials are Bearish with a score of 41.9 percent and the small traders (not shown in chart) are Bearish with a score of 26.6 percent.
| VIX Volatility Futures Statistics | SPECULATORS | COMMERCIALS | SMALL TRADERS |
| – Percent of Open Interest Longs: | 21.5 | 51.7 | 6.5 |
| – Percent of Open Interest Shorts: | 40.5 | 30.2 | 9.0 |
| – Net Position: | -61,349 | 69,199 | -7,850 |
| – Gross Longs: | 69,112 | 166,506 | 21,021 |
| – Gross Shorts: | 130,461 | 97,307 | 28,871 |
| – Long to Short Ratio: | 0.5 to 1 | 1.7 to 1 | 0.7 to 1 |
| NET POSITION TREND: | |||
| – COT Index Score (3 Year Range Pct): | 59.8 | 41.9 | 26.6 |
| – COT Index Reading (3 Year Range): | Bullish | Bearish | Bearish |
| NET POSITION MOVEMENT INDEX: | |||
| – 6-Week Change in Strength Index: | 0.2 | 0.8 | -10.0 |
Free Reports:
 Get our Weekly Commitment of Traders Reports - See where the biggest traders (Hedge Funds and Commercial Hedgers) are positioned in the futures markets on a weekly basis.
 Sign Up for Our Stock Market Newsletter – Get updated on News, Charts & Rankings of Public Companies when you join our Stocks Newsletter
S&P500 Mini Futures:
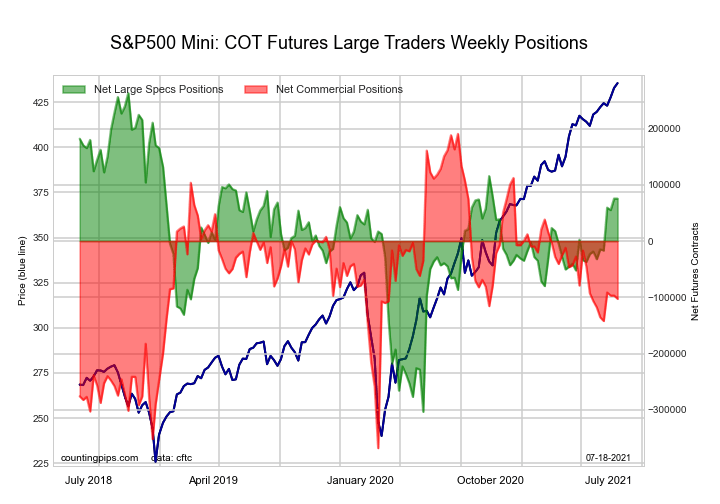 The S&P500 Mini large speculator standing this week was a net position of 75,439 contracts in the data reported through Tuesday. This was a weekly reduction of -118 contracts from the previous week which had a total of 75,557 net contracts.
This week’s current strength score (the trader positioning range over the past three years, measured from 0 to 100) shows the speculators are currently Bullish with a score of 66.9 percent. The commercials are Bearish with a score of 47.5 percent and the small traders (not shown in chart) are Bearish with a score of 32.1 percent.
| S&P500 Mini Futures Statistics | SPECULATORS | COMMERCIALS | SMALL TRADERS |
| – Percent of Open Interest Longs: | 15.5 | 71.5 | 10.4 |
| – Percent of Open Interest Shorts: | 12.6 | 75.4 | 9.4 |
| – Net Position: | 75,439 | -102,548 | 27,109 |
| – Gross Longs: | 408,065 | 1,882,685 | 275,000 |
| – Gross Shorts: | 332,626 | 1,985,233 | 247,891 |
| – Long to Short Ratio: | 1.2 to 1 | 0.9 to 1 | 1.1 to 1 |
| NET POSITION TREND: | |||
| – COT Index Score (3 Year Range Pct): | 66.9 | 47.5 | 32.1 |
| – COT Index Reading (3 Year Range): | Bullish | Bearish | Bearish |
| NET POSITION MOVEMENT INDEX: | |||
| – 6-Week Change in Strength Index: | 19.0 | 2.7 | -25.7 |
Dow Jones Mini Futures:
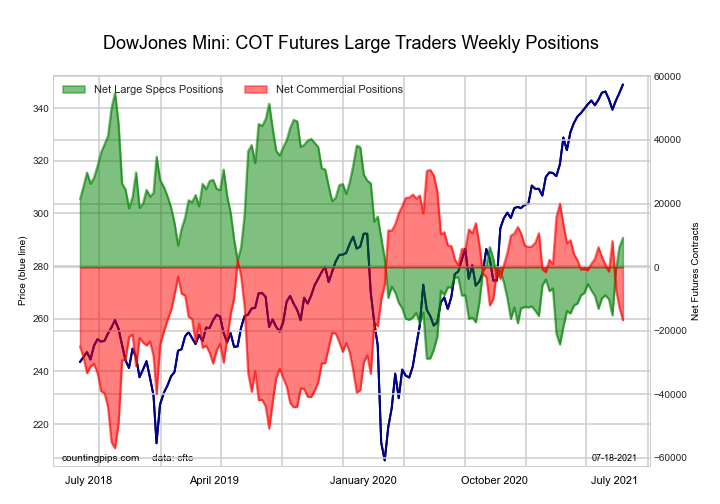 The Dow Jones Mini large speculator standing this week was a net position of 9,211 contracts in the data reported through Tuesday. This was a weekly advance of 2,862 contracts from the previous week which had a total of 6,349 net contracts.
This week’s current strength score (the trader positioning range over the past three years, measured from 0 to 100) shows the speculators are currently Bearish with a score of 45.5 percent. The commercials are Bearish with a score of 46.0 percent and the small traders (not shown in chart) are Bullish with a score of 78.4 percent.
| Dow Jones Mini Futures Statistics | SPECULATORS | COMMERCIALS | SMALL TRADERS |
| – Percent of Open Interest Longs: | 41.8 | 39.9 | 16.7 |
| – Percent of Open Interest Shorts: | 33.6 | 54.8 | 10.0 |
| – Net Position: | 9,211 | -16,686 | 7,475 |
| – Gross Longs: | 46,678 | 44,513 | 18,638 |
| – Gross Shorts: | 37,467 | 61,199 | 11,163 |
| – Long to Short Ratio: | 1.2 to 1 | 0.7 to 1 | 1.7 to 1 |
| NET POSITION TREND: | |||
| – COT Index Score (3 Year Range Pct): | 45.5 | 46.0 | 78.4 |
| – COT Index Reading (3 Year Range): | Bearish | Bearish | Bullish |
| NET POSITION MOVEMENT INDEX: | |||
| – 6-Week Change in Strength Index: | 22.7 | -22.7 | 4.7 |
Nasdaq Mini Futures:
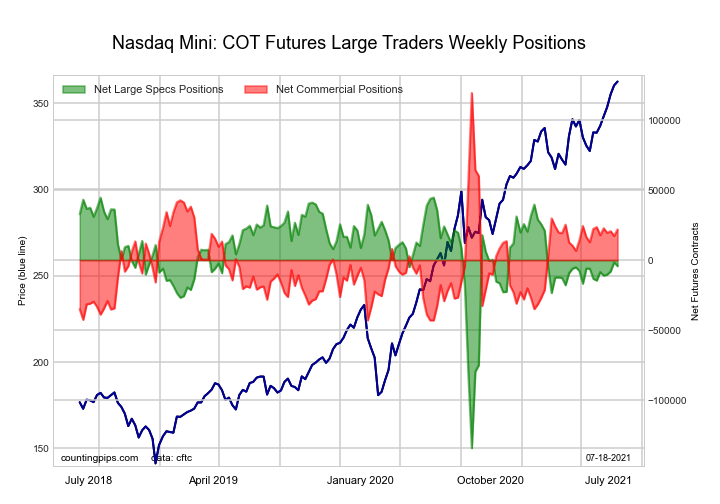 The Nasdaq Mini large speculator standing this week was a net position of -4,256 contracts in the data reported through Tuesday. This was a weekly decrease of -2,685 contracts from the previous week which had a total of -1,571 net contracts.
This week’s current strength score (the trader positioning range over the past three years, measured from 0 to 100) shows the speculators are currently Bullish with a score of 72.7 percent. The commercials are Bearish with a score of 40.0 percent and the small traders (not shown in chart) are Bearish-Extreme with a score of 4.3 percent.
| Nasdaq Mini Futures Statistics | SPECULATORS | COMMERCIALS | SMALL TRADERS |
| – Percent of Open Interest Longs: | 29.3 | 55.7 | 13.6 |
| – Percent of Open Interest Shorts: | 31.1 | 46.2 | 21.2 |
| – Net Position: | -4,256 | 21,933 | -17,677 |
| – Gross Longs: | 67,964 | 129,286 | 31,534 |
| – Gross Shorts: | 72,220 | 107,353 | 49,211 |
| – Long to Short Ratio: | 0.9 to 1 | 1.2 to 1 | 0.6 to 1 |
| NET POSITION TREND: | |||
| – COT Index Score (3 Year Range Pct): | 72.7 | 40.0 | 4.3 |
| – COT Index Reading (3 Year Range): | Bullish | Bearish | Bearish-Extreme |
| NET POSITION MOVEMENT INDEX: | |||
| – 6-Week Change in Strength Index: | 5.7 | -1.0 | -19.4 |
Russell 2000 Mini Futures:
 The Russell 2000 Mini large speculator standing this week was a net position of -43,092 contracts in the data reported through Tuesday. This was a weekly reduction of -1,185 contracts from the previous week which had a total of -41,907 net contracts.
This week’s current strength score (the trader positioning range over the past three years, measured from 0 to 100) shows the speculators are currently Bearish with a score of 31.0 percent. The commercials are Bullish with a score of 67.5 percent and the small traders (not shown in chart) are Bullish with a score of 53.6 percent.
| Russell 2000 Mini Futures Statistics | SPECULATORS | COMMERCIALS | SMALL TRADERS |
| – Percent of Open Interest Longs: | 12.0 | 80.1 | 6.9 |
| – Percent of Open Interest Shorts: | 22.2 | 71.6 | 5.2 |
| – Net Position: | -43,092 | 35,826 | 7,266 |
| – Gross Longs: | 50,612 | 337,536 | 29,122 |
| – Gross Shorts: | 93,704 | 301,710 | 21,856 |
| – Long to Short Ratio: | 0.5 to 1 | 1.1 to 1 | 1.3 to 1 |
| NET POSITION TREND: | |||
| – COT Index Score (3 Year Range Pct): | 31.0 | 67.5 | 53.6 |
| – COT Index Reading (3 Year Range): | Bearish | Bullish | Bullish |
| NET POSITION MOVEMENT INDEX: | |||
| – 6-Week Change in Strength Index: | -5.2 | 4.0 | 4.4 |
Nikkei Stock Average (USD) Futures:
 The Nikkei Stock Average (USD) large speculator standing this week was a net position of -6,291 contracts in the data reported through Tuesday. This was a weekly decrease of -2,038 contracts from the previous week which had a total of -4,253 net contracts.
This week’s current strength score (the trader positioning range over the past three years, measured from 0 to 100) shows the speculators are currently Bearish with a score of 32.8 percent. The commercials are Bullish with a score of 78.4 percent and the small traders (not shown in chart) are Bearish-Extreme with a score of 8.1 percent.
| Nikkei Stock Average Futures Statistics | SPECULATORS | COMMERCIALS | SMALL TRADERS |
| – Percent of Open Interest Longs: | 16.6 | 59.4 | 23.9 |
| – Percent of Open Interest Shorts: | 56.5 | 12.0 | 31.4 |
| – Net Position: | -6,291 | 7,480 | -1,189 |
| – Gross Longs: | 2,621 | 9,377 | 3,772 |
| – Gross Shorts: | 8,912 | 1,897 | 4,961 |
| – Long to Short Ratio: | 0.3 to 1 | 4.9 to 1 | 0.8 to 1 |
| NET POSITION TREND: | |||
| – COT Index Score (3 Year Range Pct): | 32.8 | 78.4 | 8.1 |
| – COT Index Reading (3 Year Range): | Bearish | Bullish | Bearish-Extreme |
| NET POSITION MOVEMENT INDEX: | |||
| – 6-Week Change in Strength Index: | -7.2 | 16.5 | -31.8 |
MSCI EAFE Mini Futures:
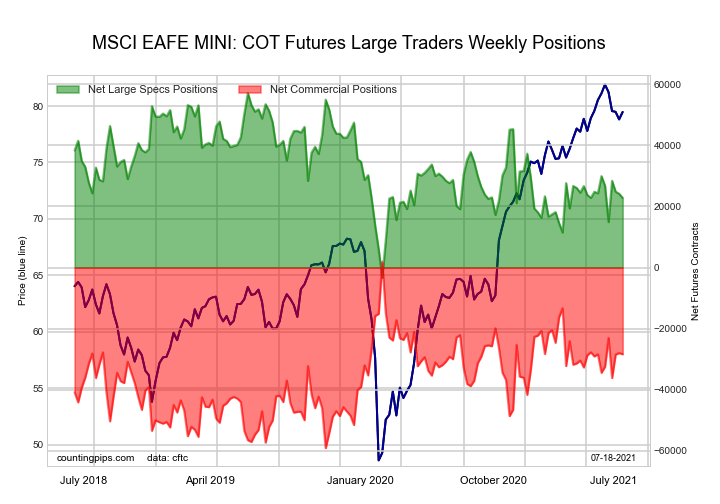 The MSCI EAFE Mini large speculator standing this week was a net position of 22,826 contracts in the data reported through Tuesday. This was a weekly decrease of -1,350 contracts from the previous week which had a total of 24,176 net contracts.
This week’s current strength score (the trader positioning range over the past three years, measured from 0 to 100) shows the speculators are currently Bearish with a score of 43.3 percent. The commercials are Bullish with a score of 50.4 percent and the small traders (not shown in chart) are Bullish with a score of 66.6 percent.
| MSCI EAFE Mini Futures Statistics | SPECULATORS | COMMERCIALS | SMALL TRADERS |
| – Percent of Open Interest Longs: | 8.9 | 88.1 | 2.6 |
| – Percent of Open Interest Shorts: | 3.5 | 94.8 | 1.3 |
| – Net Position: | 22,826 | -28,410 | 5,584 |
| – Gross Longs: | 37,951 | 376,712 | 11,289 |
| – Gross Shorts: | 15,125 | 405,122 | 5,705 |
| – Long to Short Ratio: | 2.5 to 1 | 0.9 to 1 | 2.0 to 1 |
| NET POSITION TREND: | |||
| – COT Index Score (3 Year Range Pct): | 43.3 | 50.4 | 66.6 |
| – COT Index Reading (3 Year Range): | Bearish | Bullish | Bullish |
| NET POSITION MOVEMENT INDEX: | |||
| – 6-Week Change in Strength Index: | -11.8 | 9.9 | 9.7 |
MSCI Emerging Mkts Mini Futures:
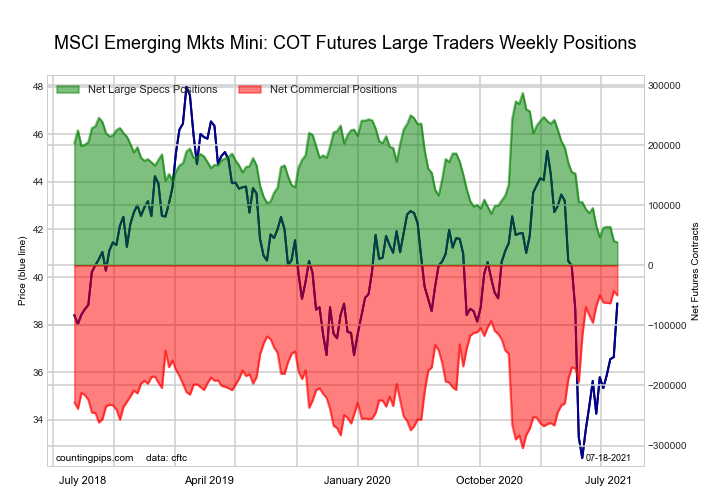 The MSCI Emerging Mkts Mini large speculator standing this week was a net position of 38,211 contracts in the data reported through Tuesday. This was a weekly decline of -2,219 contracts from the previous week which had a total of 40,430 net contracts.
This week’s current strength score (the trader positioning range over the past three years, measured from 0 to 100) shows the speculators are currently Bearish-Extreme with a score of 0.0 percent. The commercials are Bullish-Extreme with a score of 97.2 percent and the small traders (not shown in chart) are Bearish with a score of 40.4 percent.
| MSCI Emerging Mkts Mini Futures Statistics | SPECULATORS | COMMERCIALS | SMALL TRADERS |
| – Percent of Open Interest Longs: | 14.3 | 82.2 | 2.4 |
| – Percent of Open Interest Shorts: | 11.0 | 86.5 | 1.3 |
| – Net Position: | 38,211 | -49,886 | 11,675 |
| – Gross Longs: | 165,150 | 950,685 | 27,250 |
| – Gross Shorts: | 126,939 | 1,000,571 | 15,575 |
| – Long to Short Ratio: | 1.3 to 1 | 1.0 to 1 | 1.7 to 1 |
| NET POSITION TREND: | |||
| – COT Index Score (3 Year Range Pct): | 0.0 | 97.2 | 40.4 |
| – COT Index Reading (3 Year Range): | Bearish-Extreme | Bullish-Extreme | Bearish |
| NET POSITION MOVEMENT INDEX: | |||
| – 6-Week Change in Strength Index: | -11.0 | 6.8 | 7.3 |
Article By CountingPips.com – Receive our weekly COT Reports by Email
*COT Report: The COT data, released weekly to the public each Friday, is updated through the most recent Tuesday (data is 3 days old) and shows a quick view of how large speculators or non-commercials (for-profit traders) were positioned in the futures markets.
The CFTC categorizes trader positions according to commercial hedgers (traders who use futures contracts for hedging as part of the business), non-commercials (large traders who speculate to realize trading profits) and nonreportable traders (usually small traders/speculators).
Find CFTC criteria here: (http://www.cftc.gov/MarketReports/CommitmentsofTraders/ExplanatoryNotes/index.htm).

- GBP/USD at Month’s Lows: The Outlook Remains Weak Jul 29, 2026
- Crude oil falls below $80 per barrel. Australia sees inflation slowdown Jul 29, 2026
- The US Tech sector hit by sell‑off. Oil prices decline on renewed negotiations Jul 28, 2026
- Gold Declines, Focus on Fed and Falling Oil Prices Jul 28, 2026
- This week will be one of the most crowded for central‑bank meetings Jul 27, 2026
- EUR/USD Ahead of a Key Week: Holding Near Lows Jul 27, 2026
- COT Metals Charts: Weekly Speculator Changes led by Copper Jul 26, 2026
- COT Bonds Charts: Speculator Bets led by SOFR 3-Months & 5-Year Bonds Jul 26, 2026
- COT Energy Charts: Weekly Speculator Bets led by WTI Crude & Natural Gas Jul 26, 2026
- COT Soft Commodities Charts: Weekly Speculator Bets led by Corn & Soybeans Jul 26, 2026