Speculators boost RBOB Gasoline bullish bets to 20-week high

By InvestMacro | COT | Data Tables | COT Leaders | Downloads | COT Newsletter

Here are the latest charts and statistics for the Commitment of Traders (COT) data published by the Commodities Futures Trading Commission (CFTC).

The latest COT data is updated through Tuesday November 16th 2021 and shows a quick view of how large traders (for-profit speculators and commercial entities) were positioned in the futures markets.

Highlighting the COT Energy data this week is the gains in RBOB Gasoline speculative positions. Gasoline speculator bets jumped this week by the largest one-week gain (+9,145 contracts) of the past fifty-three weeks and rose for the sixth time in ten weeks. These gains have pushed the current speculative net standing (+54,214 contracts) to its highest level of the past twenty weeks, dating back to June 29th. RBOB Gasoline futures prices, like many energy markets, have been on a strong uptrend since bottoming in early 2020 and recently hit the highest level since 2014 in October.


Data Snapshot of Commodity Market Traders | Columns Legend
Nov-16-2021OIOI-IndexSpec-NetSpec-IndexCom-NetCOM-IndexSmalls-NetSmalls-Index
WTI Crude2,057,63318415,78544-470,3244154,53992
Gold612,61254259,78073-287,5392727,75948
Silver152,4041845,62568-66,1483420,52361
Copper208,0663220,33757-30,8053810,46886
Palladium11,84024-2,03871,976916248
Platinum62,2842621,01333-28,225697,21263
Natural Gas1,308,70845-144,6203598,4156246,20596
Brent199,93039-12,900987,41205,48894
Heating Oil380,8872617,02967-37,0103219,98168
Soybeans662,9721346,91742-4,92765-41,9902
Corn1,598,92638399,18681-340,67223-58,5149
Coffee286,3434866,08197-70,07553,99416
Sugar906,38521227,38983-276,1851648,79668
Wheat427,7864936,76178-27,99914-8,76260


WTI Crude Oil Futures:

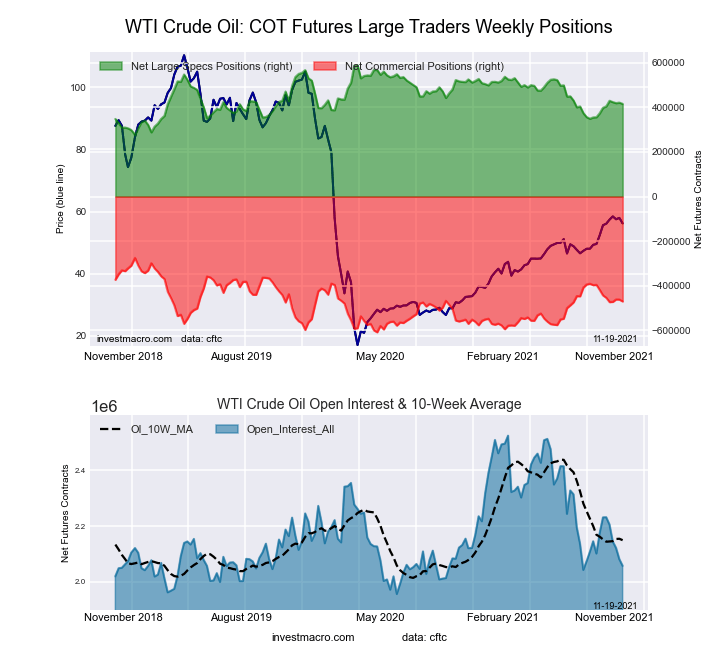
WTI Crude Oil Futures COT ChartThe WTI Crude Oil Futures large speculator standing this week resulted in a net position of 415,785 contracts in the data reported through Tuesday. This was a weekly decrease of -5,527 contracts from the previous week which had a total of 421,312 net contracts.

This week’s current strength score (the trader positioning range over the past three years, measured from 0 to 100) shows the speculators are currently Bearish with a score of 44.4 percent. The commercials are Bearish with a score of 41.5 percent and the small traders (not shown in chart) are Bullish-Extreme with a score of 91.9 percent.

WTI Crude Oil Futures StatisticsSPECULATORSCOMMERCIALSSMALL TRADERS
– Percent of Open Interest Longs:24.834.65.0
– Percent of Open Interest Shorts:4.657.42.4
– Net Position:415,785-470,32454,539
– Gross Longs:510,169711,066103,722
– Gross Shorts:94,3841,181,39049,183
– Long to Short Ratio:5.4 to 10.6 to 12.1 to 1
NET POSITION TREND:
– COT Index Score (3 Year Range Pct):44.441.591.9
– COT Index Reading (3 Year Range):BearishBearishBullish-Extreme
NET POSITION MOVEMENT INDEX:
– 6-Week Change in Strength Index:5.6-8.113.5


Brent Crude Oil Futures:

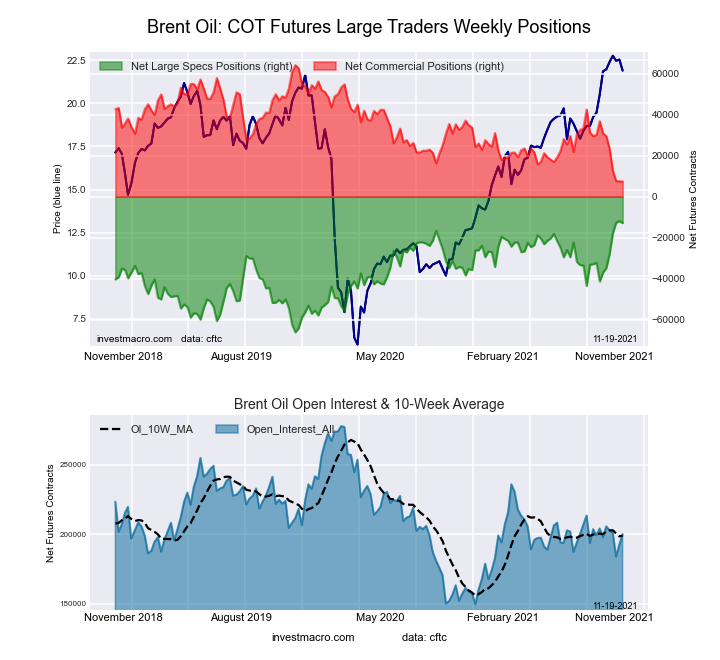
Brent Last Day Crude Oil Futures COT ChartThe Brent Crude Oil Futures large speculator standing this week resulted in a net position of -12,900 contracts in the data reported through Tuesday. This was a weekly reduction of -1,049 contracts from the previous week which had a total of -11,851 net contracts.

This week’s current strength score (the trader positioning range over the past three years, measured from 0 to 100) shows the speculators are currently Bullish-Extreme with a score of 98.1 percent. The commercials are Bearish-Extreme with a score of 0.0 percent and the small traders (not shown in chart) are Bullish-Extreme with a score of 94.1 percent.

Brent Crude Oil Futures StatisticsSPECULATORSCOMMERCIALSSMALL TRADERS
– Percent of Open Interest Longs:22.640.84.4
– Percent of Open Interest Shorts:29.137.11.7
– Net Position:-12,9007,4125,488
– Gross Longs:45,20181,6088,790
– Gross Shorts:58,10174,1963,302
– Long to Short Ratio:0.8 to 11.1 to 12.7 to 1
NET POSITION TREND:
– COT Index Score (3 Year Range Pct):98.10.094.1
– COT Index Reading (3 Year Range):Bullish-ExtremeBearish-ExtremeBullish-Extreme
NET POSITION MOVEMENT INDEX:
– 6-Week Change in Strength Index:44.4-41.4-5.9


Natural Gas Futures:

Natural Gas Futures COT ChartThe Natural Gas Futures large speculator standing this week resulted in a net position of -144,620 contracts in the data reported through Tuesday. This was a weekly fall of -2,429 contracts from the previous week which had a total of -142,191 net contracts.

This week’s current strength score (the trader positioning range over the past three years, measured from 0 to 100) shows the speculators are currently Bearish with a score of 35.2 percent. The commercials are Bullish with a score of 61.9 percent and the small traders (not shown in chart) are Bullish-Extreme with a score of 95.9 percent.

Natural Gas Futures StatisticsSPECULATORSCOMMERCIALSSMALL TRADERS
– Percent of Open Interest Longs:19.243.85.1
– Percent of Open Interest Shorts:30.336.21.6
– Net Position:-144,62098,41546,205
– Gross Longs:251,501572,76167,164
– Gross Shorts:396,121474,34620,959
– Long to Short Ratio:0.6 to 11.2 to 13.2 to 1
NET POSITION TREND:
– COT Index Score (3 Year Range Pct):35.261.995.9
– COT Index Reading (3 Year Range):BearishBullishBullish-Extreme
NET POSITION MOVEMENT INDEX:
– 6-Week Change in Strength Index:-3.30.623.1


Gasoline Blendstock Futures:

RBOB Gasoline Energy Futures COT ChartThe Gasoline Blendstock Futures large speculator standing this week resulted in a net position of 54,214 contracts in the data reported through Tuesday. This was a weekly increase of 9,145 contracts from the previous week which had a total of 45,069 net contracts.

This week’s current strength score (the trader positioning range over the past three years, measured from 0 to 100) shows the speculators are currently Bearish with a score of 25.3 percent. The commercials are Bullish with a score of 74.9 percent and the small traders (not shown in chart) are Bullish with a score of 58.8 percent.

Nasdaq Mini Futures StatisticsSPECULATORSCOMMERCIALSSMALL TRADERS
– Percent of Open Interest Longs:32.145.76.6
– Percent of Open Interest Shorts:16.064.24.2
– Net Position:54,214-62,1147,900
– Gross Longs:108,162153,83322,091
– Gross Shorts:53,948215,94714,191
– Long to Short Ratio:2.0 to 10.7 to 11.6 to 1
NET POSITION TREND:
– COT Index Score (3 Year Range Pct):25.374.958.8
– COT Index Reading (3 Year Range):BearishBullishBullish
NET POSITION MOVEMENT INDEX:
– 6-Week Change in Strength Index:3.2-3.30.7


#2 Heating Oil NY-Harbor Futures:

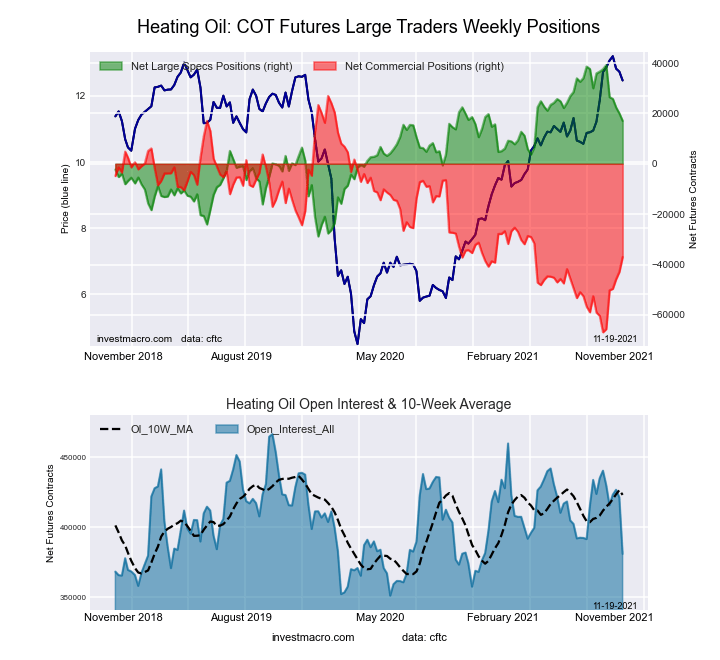
NY Harbor Heating Oil Energy Futures COT ChartThe #2 Heating Oil NY-Harbor Futures large speculator standing this week resulted in a net position of 17,029 contracts in the data reported through Tuesday. This was a weekly lowering of -2,993 contracts from the previous week which had a total of 20,022 net contracts.

This week’s current strength score (the trader positioning range over the past three years, measured from 0 to 100) shows the speculators are currently Bullish with a score of 67.5 percent. The commercials are Bearish with a score of 31.8 percent and the small traders (not shown in chart) are Bullish with a score of 67.6 percent.

Heating Oil Futures StatisticsSPECULATORSCOMMERCIALSSMALL TRADERS
– Percent of Open Interest Longs:14.052.312.3
– Percent of Open Interest Shorts:9.662.07.1
– Net Position:17,029-37,01019,981
– Gross Longs:53,501199,25246,852
– Gross Shorts:36,472236,26226,871
– Long to Short Ratio:1.5 to 10.8 to 11.7 to 1
NET POSITION TREND:
– COT Index Score (3 Year Range Pct):67.531.867.6
– COT Index Reading (3 Year Range):BullishBearishBullish
NET POSITION MOVEMENT INDEX:
– 6-Week Change in Strength Index:-30.231.8-32.4


Bloomberg Commodity Index Futures:

Bloomberg Commodity Index Futures COT ChartThe Bloomberg Commodity Index Futures large speculator standing this week resulted in a net position of -13,973 contracts in the data reported through Tuesday. This was a weekly increase of 218 contracts from the previous week which had a total of -14,191 net contracts.

This week’s current strength score (the trader positioning range over the past three years, measured from 0 to 100) shows the speculators are currently Bearish with a score of 35.2 percent. The commercials are Bullish with a score of 63.7 percent and the small traders (not shown in chart) are Bullish with a score of 56.0 percent.

Bloomberg Index Futures StatisticsSPECULATORSCOMMERCIALSSMALL TRADERS
– Percent of Open Interest Longs:55.737.91.9
– Percent of Open Interest Shorts:90.45.00.1
– Net Position:-13,97313,252721
– Gross Longs:22,47115,268772
– Gross Shorts:36,4442,01651
– Long to Short Ratio:0.6 to 17.6 to 115.1 to 1
NET POSITION TREND:
– COT Index Score (3 Year Range Pct):35.263.756.0
– COT Index Reading (3 Year Range):BearishBullishBullish
NET POSITION MOVEMENT INDEX:
– 6-Week Change in Strength Index:-3.22.612.3


Article By InvestMacroReceive our weekly COT Reports by Email

*COT Report: The COT data, released weekly to the public each Friday, is updated through the most recent Tuesday (data is 3 days old) and shows a quick view of how large speculators or non-commercials (for-profit traders) were positioned in the futures markets.

The CFTC categorizes trader positions according to commercial hedgers (traders who use futures contracts for hedging as part of the business), non-commercials (large traders who speculate to realize trading profits) and nonreportable traders (usually small traders/speculators) as well as their open interest (contracts open in the market at time of reporting).See CFTC criteria here.

Cannabis ETF MJ Basing & Volatility Patterns

By TheTechnicalTraders 

Recently, the Cannabis sector has shown signs of increased volume, volatility, and a reasonably strong potential for a price base. Volume started increasing near mid-September as the price of MJ fell below $15. This support level originated from late December 2020 after a significant rally trend from recent lows near $10 – when the Reddit retail trader event started to unfold.

I wrote about this sector and these opportunities in many articles before the incredible rally in late 2020 into 2021.

What I find interesting are two things. First, the recently proposed cannabis reform legislation may prompt a nationwide declassification of marijuana as a class-3 drug. This change could open every state, consumer, industry, and banking/financial institution to kick the doors wide to participate in the cannabis industry. Secondly, this industry is well past the initial stages of growth and attrition from many years ago. Now, established players and proven markets are competing for market share. This creates a very competitive and dynamic environment in this sector.

What I believe can happen over the next 10+ years is a simple consolidation of the industry around centralized components of the cannabis market. And a renewed focus on federal approval and tracking related to “seed to consumer” regulations. My opinion is that the industry will see weaker players acquired by stronger players while startups still try to dominate the fringe market. These startups will likely be disruptors in the industry, just like independent brewers are popping up all over the US right now.

A Technical Look At cannabis etf MJ And The Pending January 2022 Apex

Technically, I see a very large Pennant/Flag formation on this Cannabis MJ chart. The formation leads me to believe early January could prompt a base or bottom near $13.25. I see the long-term support level, originating from the bottom in March 2020, as a very critical price level. This support level will likely prompt the current price to try and hold above $12.75~$13.00 as the final waves of the Pennant/Flag trend unfold.

If my wave count is correct, the price will attempt to bottom near $12.75~$13.00 soon. After this, the Cannabis MJ price will try to rally up to $15.25 to $15.75 before the end of 2021. A final downward price wave may push the price below the $13.00 level again as volatility becomes more elevated near the Apex of the Pennant/Flag formation. The Apex takes place near the end of January 2022. Therefore, traders should consider looking for buying opportunities near or below current support (somewhere near or below $12.75 to $13.00).

The Cannabis MJ chart shows price is attempting to confirm the lower support channel. If this lower support channel fails, we would wait for a new price trend to establish a new price pattern – hopefully providing better future guidance. Currently, this extended Pennant/Flag price formation appears to be trending and confirming nicely.

My belief is MJ will start at Apex near the end of January 2022. Meaning we should expect bigger price volatility and the potential for a “blow-off” price rotation sometime after January 15, 2022. Most Apex setups result in a type of wild rotation in price that I call a “blow-off” price rotation. Ideally, traders want to ride out the “blow-off” rotation and try to catch the breakout or break-away trend when it starts.

Daily MJ Chart Shows Clear Price Trending In Support Of The Lower Price Channel

This Daily MJ Chart highlights an upward price channel recently set up after price retested the $13.00 lower support level. If you understand the five waves of a Pennant/Flag formation, you’ll quickly understand there are two immediate potential outcomes for the price right now. First, the price could fail to stay within this channel and break downward – retesting the $13 lower support channel again (or possibly trend a bit lower). Second, the price could have already confirmed the $13 lower support channel and is in the process of moving higher – targeting the $15.25 to $15.75 level.

We are seeing some basing/bottoming in On Balanced Volume and a very large increase in the Daily trading volume recently. Both of these indicate traders are accumulating shares of MJ in preparation for a price move.

With pending cannabis reform legislation and President Biden likely to support this new economic frontier, any federal decriminalization of cannabis would potentially prompt a wave of buying within this sector. Given the current Pennant/Flag formation in MJ, traders may be already looking for opportunities in the cannabis sector. MJ could rally back above $20 to $21 fairly quickly.

Be patient, though, as this Pennant/Flag formation won’t be complete until sometime after January 10th to 14th. Plan how you expect the markets to trend throughout the end of this year. Watch how MJ reacts to the final three price waves of the Pennant/Flag formation. As we approach early 2022, the cannabis sector could become a leading one if the new cannabis reform legislation gets closer to becoming law. We may see another rally, like in early 2021. We may see MJ rally well above $25 if traders start chasing a breakout trend.

Want to learn more about the cannabis sector and others?

Follow my research and learn how I use specific tools to help me understand price cycles, setups, and price target levels. Over the next 12 to 24+ months, I expect large price swings in the US stock market and other asset classes across the globe. I believe the markets are starting to transition away from the continued central bank support rally phase. Next, a revaluation phase may begin as global traders attempt to identify emerging trends. Precious Metals will likely start to act as a proper hedge as caution and concern drive traders/investors into Metals.

Kindly take a minute to visit www.TheTechnicalTraders.com to learn about my Total ETF Portfolio (TEP) technology and how it can help you identify and trade better sector setups. My team and I have built these strategies to help us identify the strongest and best trade setups in any market sector. Every day, we deliver these setups to our subscribers along with the TEP system trades. You owe it to yourself to see how simple it is to trade 30% to 40% of the time to generate incredible results.

Chris Vermeulen


When Even Bears Act Bullishly (What It May Mean)

“Some indicators are making records”

By Elliott Wave International

It’s difficult for most investors to take an independent stand from the crowd.

For example, it may be wise to “buy when there’s blood in the streets,” as Baron Rothschild famously said, but for many investors, that’s easier said than done.

Likewise, when a financial uptrend has persisted, it’s difficult for many investors to act in a contrary way to the pervasive optimism.

Consider this chart and commentary from the November Elliott Wave Financial Forecast, a monthly publication which provides coverage of major U.S. financial markets:

National Association of Active Investment Managers average stock exposure

The chart shows the exposure to equities held by members of the National Association of Active Investment Managers. Readings above 100 mean that managers are leveraged long equities [and] this week’s reading [is] 107.99%. … Some indicators are making records. The bottom graph on the chart shows the equity exposure of the most bearish fund managers. Yes, even the bears are bullish. For the past three weeks, the most bearish fund managers were still net-long stocks by 50%, 65% and 50%. It’s the first time in the history of the data … that bearish fund managers have been net-long equities 50% or more for three consecutive weeks.

Here are three headlines which speak to the persistent bullish sentiment:

  • Stocks Are Still the Place to Be, Our Exclusive Big Money Poll Finds (Barron’s, Oct. 16)
  • Invesco records fifth straight quarter of net inflows (Pensions & Investments, Oct. 26)
  • Fund managers make their biggest bets on U.S. stocks in 8 years … (Marketwatch, Nov. 16)

The takeaway is that when almost everyone acts bullishly, even the most bearish, there’s relatively few investors left to buy to keep an uptrend going.

This doesn’t mean that the financial uptrend will stop, say, tomorrow or the next day.

However, it does suggest that an investor will want to pay particularly close attention to the message of the Elliott wave model, which offers high-confidence insights into market turn junctures.

Indeed, here’s a quote from Frost & Prechter’s Wall Street classic, Elliott Wave Principle: Key to Market Behavior:

When after a while the apparent jumble gels into a clear picture, the probability that a turning point is at hand can suddenly and excitingly rise to nearly 100%. It is a thrilling experience to pinpoint a turn, and the Wave Principle is the only approach that can occasionally provide the opportunity to do so.

The ability to identify such junctures is remarkable enough, but the Wave Principle is the only method of analysis that also provides guidelines for forecasting. Many of these guidelines are specific and can occasionally yield stunningly precise results. If indeed markets are patterned, and if those patterns have a recognizable geometry, then regardless of the variations allowed, certain price and time relationships are likely to recur. In fact, experience shows that they do.

You can gain insights into the recurring price patterns of the stock market by reading the entire online version of the book — 100% free!

All that’s required for free access is a Club EWI membership. Club EWI is the world’s largest Elliott wave educational community and is free to join.

Club EWI members are granted free access to a wealth of Elliott wave resources on financial markets, investing and trading.

Just follow this link to get started: Elliott Wave Principle: Key to Market Behavior — free and unlimited access.


The Week Ahead – EUR Struggles And ECB Remains Unfazed

By Orbex

EUR

EURUSD weakens as ECB remains dovish

EURUSD

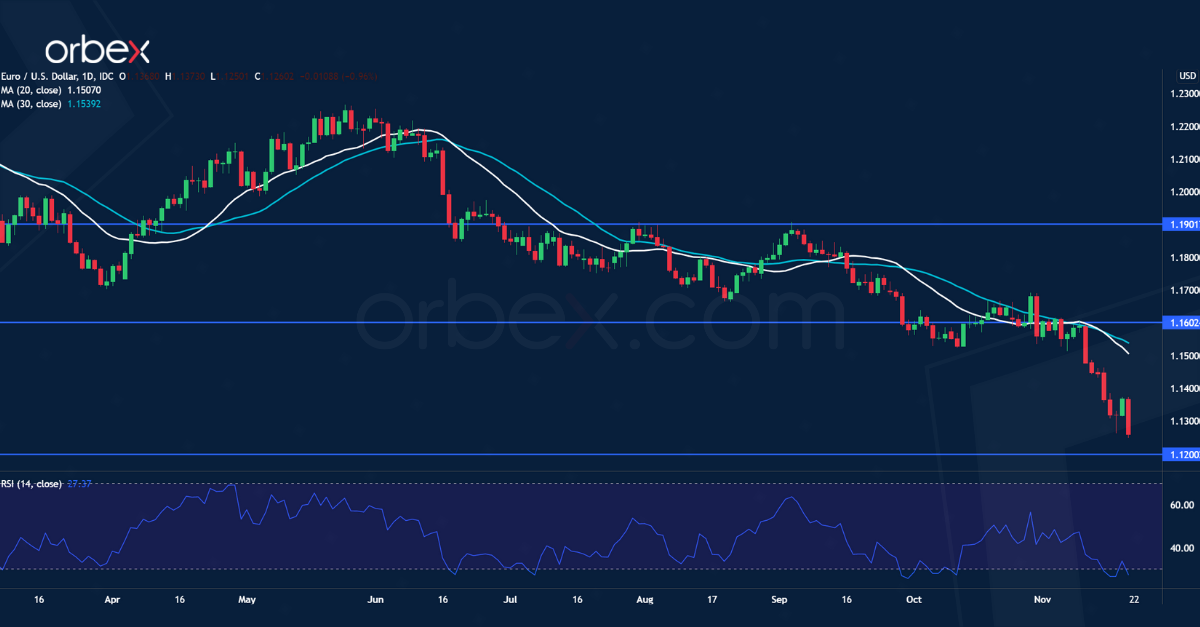
The US dollar continues to rally on growing policy divergence between the ECB and the Fed. As Europe faces a new spike in covid cases, ECB President Christine Lagarde insisted that tightening now would threaten the economic recovery.

Across the pond, a string of upbeat economic data fuelled demand for the US dollar. Amid speculations that the Federal Reserve will have to raise rates in June 2022, the ECB’s dovish position seems like a nail in the coffin for the single currency.

A break below last July’s lows around 1.1200 could extend the sell-off towards 1.0900. A bounce to the resistance at 1.1600 would be a selling opportunity.

NZDUSD recovers on rate hike hopes

NZDUSD

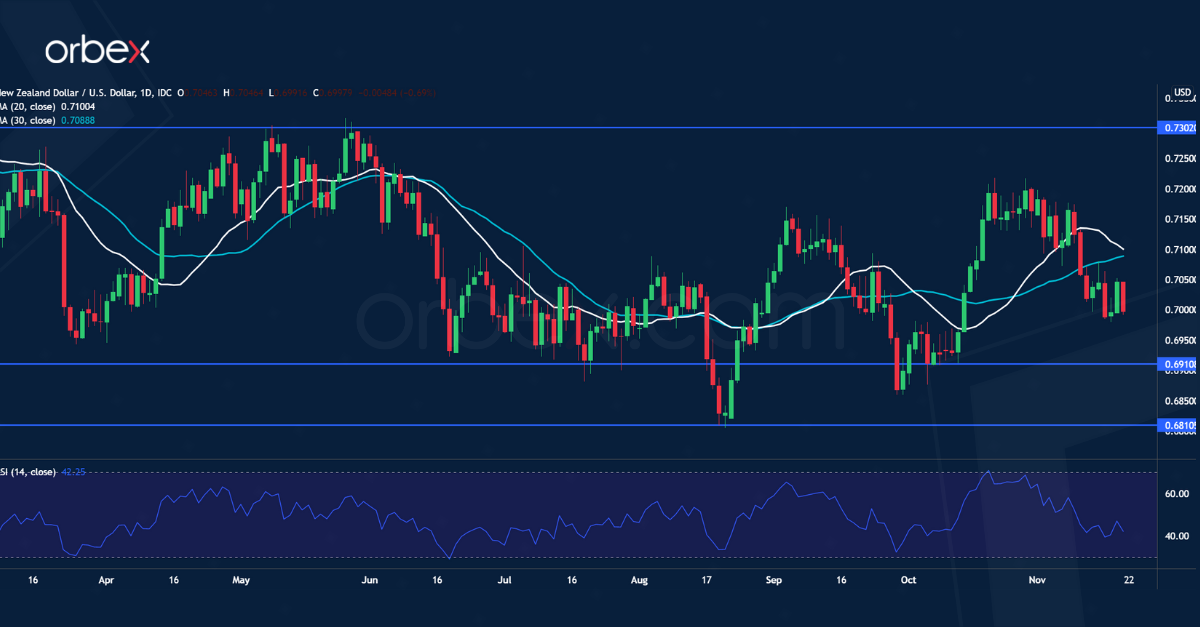
The New Zealand dollar bounces higher in anticipation of an increase in the cash rate at the RBNZ meeting this week. The central bank raised inflation expectations in the fourth quarter, further advancing the case for aggressive tightening.

In an effort to rein in consumer and property price pressures, the RBNZ has embarked on a tightening cycle with its first rate hike in seven years last month. The question this week is by how much?

Markets have priced in a 25 basis point increase. 50 basis points could be a bullish surprise. A rally above last May’s tops at 0.7300 would resume the uptrend. 0.6910 is major support.

XAUUSD climbs as US dollar stalls

XAUUSD

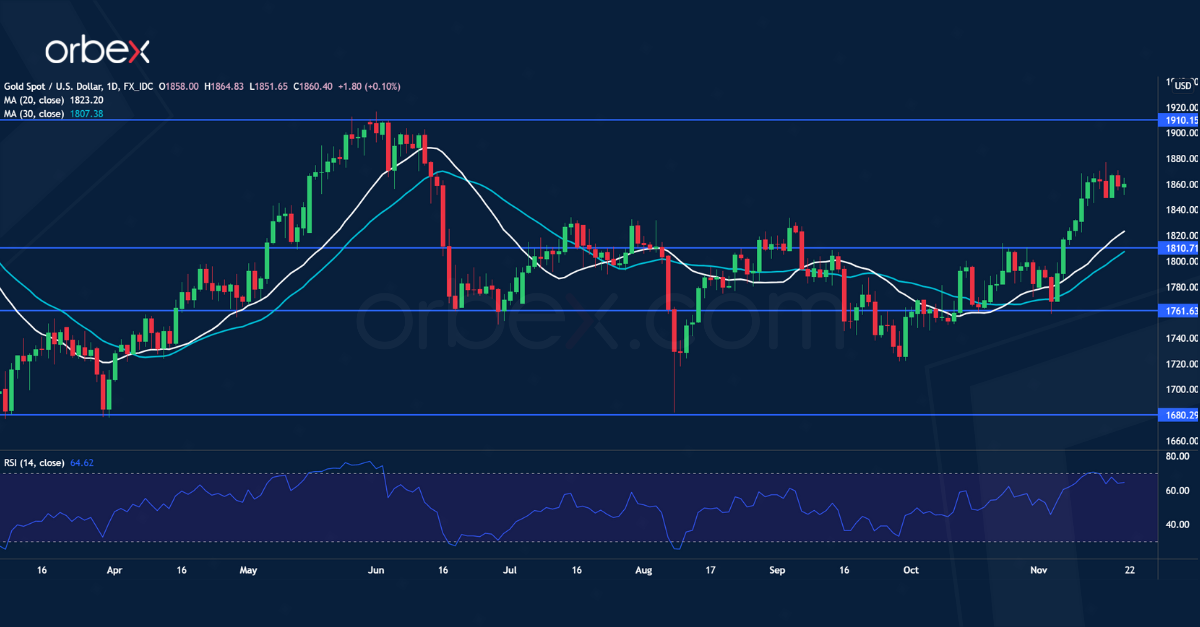
Gold remains firm as the US dollar takes a breather after its recent surge. The rally could face headwinds in the short term as traders are torn between opportunity cost and inflation fears. The prospect of higher interest rates would lessen the appeal of the non-yielding metal.

However, a surge in consumer prices in major economies has boosted demand for bullion’s inflation hedge feature. The US dollar’s next move could tip the balance. And a cheaper dollar would bolster the metal’s performance.

A break above June’s high at 1910 may end the 15-month long consolidation and resume the rally. 1810 is fresh support in case of a pullback.

US 500 consolidates ahead of Fed nomination

SPX500

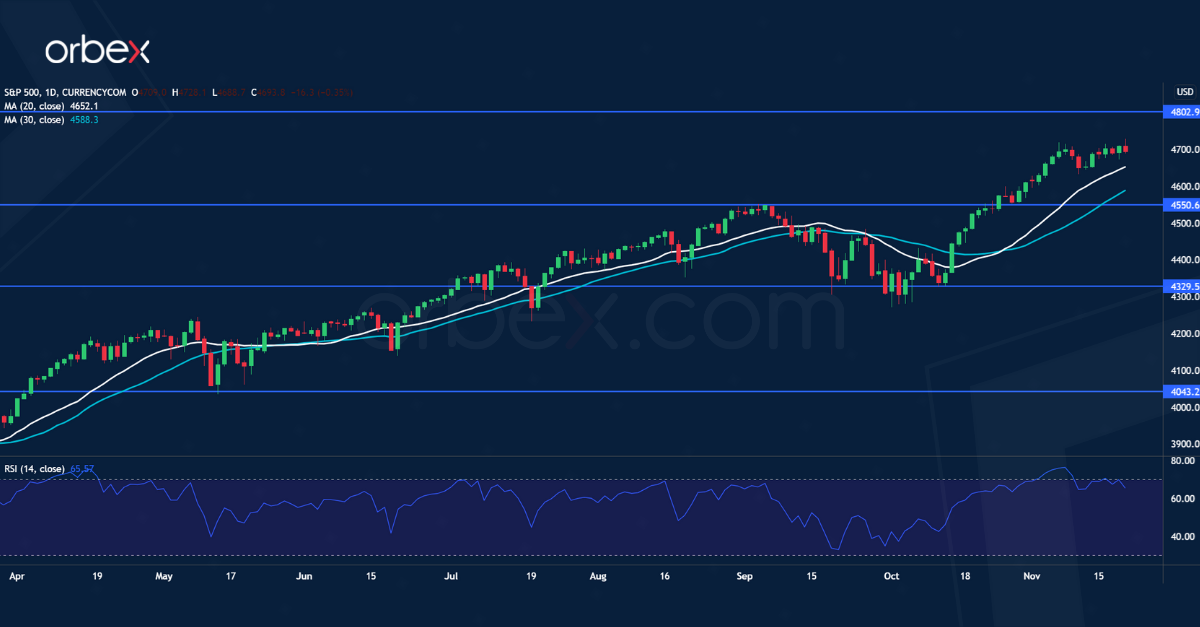
The S&P 500 treads water as investors await the Fed Chair nomination. Analysts are expecting US President Joe Biden to pick the head of the US Federal Reserve this week.

Jerome Powell’s reappointment would offer the continuity that investors cherish. His track record would comfort the market in times of intense inflationary and political pressures. The nomination of the contender Lael Brainard may stir up volatility.

Nonetheless, her more dovish stance could be supportive of an easy money environment, which would fuel the bull run in the medium term. 4800 is the next target with 4550 as the first support in case of a pullback.


Orbex-LogoArticle by Orbex

Orbex is a fully licensed broker that was established in 2011. Founded with a mission to serve its traders responsibly and provides traders with access to the world’s largest and most liquid financial markets. www.orbex.com

What Does The Release Of The SPR Mean For Oil Prices?

By Orbex

Because of supply chain issues, oil prices are one of the biggest factors causing higher inflation.

After oil futures crashed into negative last year, they have “overcorrected” and are trading above pre-pandemic levels. This has been a headache for most policymakers, but it’s particularly troublesome for the Biden Administration. In fact, higher gasoline prices can become a political issue, and with the President expanding his net disapproval rating, it’s necessary to do more.

For most of the year, the Biden Administration has been asking OPEC+ to increase production faster to tamp down energy prices.

However, the block has generally stuck to its gradual 400Kbpd per month increase program. And they have insisted that they don’t see any reason to change it.

The Strategic Petroleum Reserve

One of the ways the US could affect the price of crude in the short term is by taking a page out of the Chinese commodity playbook. That would be to sell part of their strategic reserve.

The US has around 714M barrels stored up in case of emergency. The last time the US made use of it was in 2011, during the war in Libya. As a measure of comparison, the US consumes about 20M barrels a day, while the whole world consumes 91M per day on average.

This idea was discussed at different levels. But this option took on more weight after the Senate Majority Leader Schumer called for it on the Senate floor at the start of the week. Since then, US diplomats have been working on coordinating action with other countries affected by the high price of crude.

That said, coordinated action by large oil consumers, such as China and India, could have a bigger impact on bringing down prices.

The responses and price action

Some thought that the threat of releasing the reserves would put pressure on OPEC+ to address the price issue. However, they have been undeterred.

Both their and the IEA assessment suggest that the oil market will balance out next year. A release of the SPR is a temporary measure. And it’s unlikely to move the needle in the long term.

Last night, Goldman Sachs, for example, expected that a release of the SPR wouldn’t affect the price beyond a fluctuation following the announcement. Moreover, they joined several other analysts who agreed that the market has already priced in a release from the US Strategic Petroleum Reserve.

Where things are going

In their earnings reports, both BP and TotalEnergies were budgeting crude prices to average $60/bbl through next year. So, there is a pretty strong consensus that the current crude price situation is largely transitory.

Analysts point to unusual weather during autumn that lead to increased demand for peaking power. In addition, there was an unexpected depletion of stocks going into what’s expected to be an unseasonably cold winter. However, that situation will likely be resolved in the coming months, and crude prices would then return to their normal trajectory.

The SPR might do more than just push crude prices down. Specifically, it could prevent prices from going higher. The release of the reserve is based on the notion that crude prices are being driven higher due primarily to speculation. The SPR has the potential of knocking them out of the market.

On the other hand, if the price is being driven by underlying factors, including inflation and slow growth in production, then the reserve release could have a minimal effect.


Orbex-LogoArticle by Orbex

Orbex is a fully licensed broker that was established in 2011. Founded with a mission to serve its traders responsibly and provides traders with access to the world’s largest and most liquid financial markets. www.orbex.com

USOIL Final Leg Of The Bullish Impulse Could Have Just Begun

By Orbex

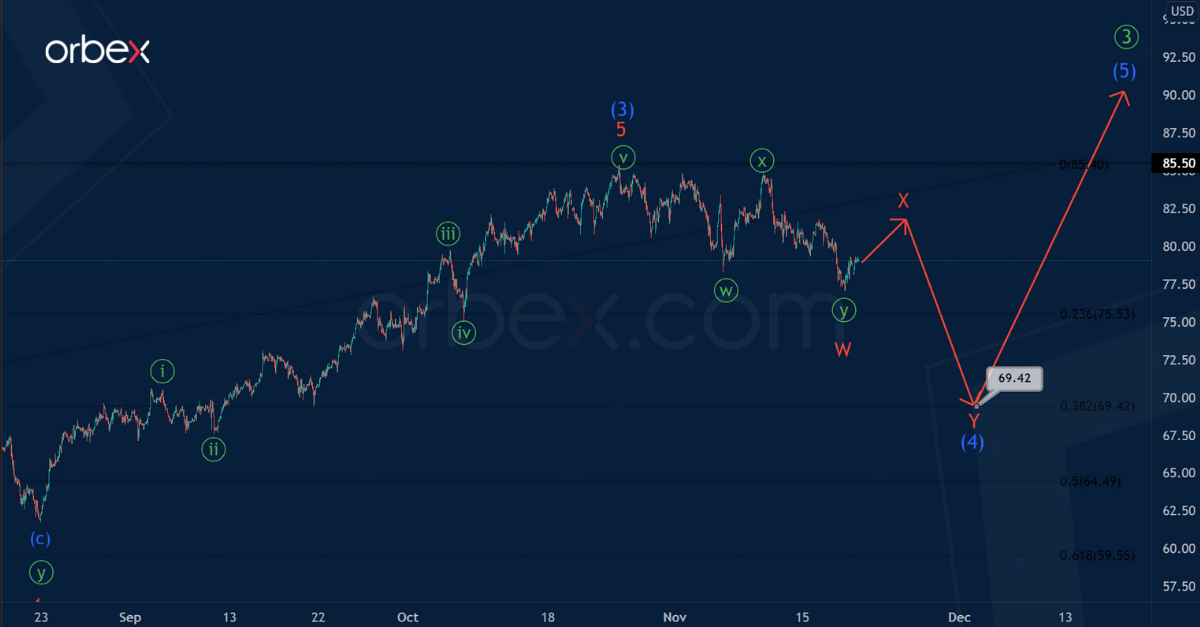
We can assume that USOIL is currently developing a global upward impulse. This includes the primary wave ③.

The current chart shows the final part of the primary third wave, where we see the complete correction wave (4) of the intermediate degree. This wave is in the form of a double zigzag W-X-Y.

After the completion of the correction (4), the market began to rise in the final intermediate wave (5). This took the form of a 5-wave impulse consisting of minor sub-waves 1-2-3-4-5, as shown in the chart.

In the short term, the price could rise to the level of 97.44 in sub-wave 5. There intermediate wave (5) will be at 100% of wave (3).

USOIL

An alternative scenario suggests that the intermediate correction wave (4), which is part of the primary third wave, is not complete yet.

We can assume that the impulse movement in the bullish intermediate wave (3) has just recently ended. And the intermediate correction (4) is still developing.

Thus, in the near future, we could see a correction decline of the market in the minor double zigzag W-X-Y as shown in the chart near 69.38. At that level, wave (4) will be at 38.2% of impulse wave (3).

After reaching the specified price mark, the market may rise above the maximum of 85.50. This level was marked by wave (3).


Orbex-LogoArticle by Orbex

Orbex is a fully licensed broker that was established in 2011. Founded with a mission to serve its traders responsibly and provides traders with access to the world’s largest and most liquid financial markets. www.orbex.com

Intraday Market Analysis – USD In Pullback Mode

By Orbex

USDCHF seeks support

USDCHF

The US dollar stalled after weekly jobless claims came in higher than expected. The pair’s attempt above the daily resistance at 0.9310 suggests that the bulls may have gained the upper hand.

Intraday buyers’ profit-taking led by the RSI’s overbought situation has caused a limited pullback. Buyers may see dips as an opportunity to get in at a discount. Bids could be around the resistance-turned-support at 0.9235.

0.9330 is a fresh resistance. And its breach may trigger an extended rally towards last April’s peak at 0.9450.

NZDUSD bounces off demand area

NZDUSD

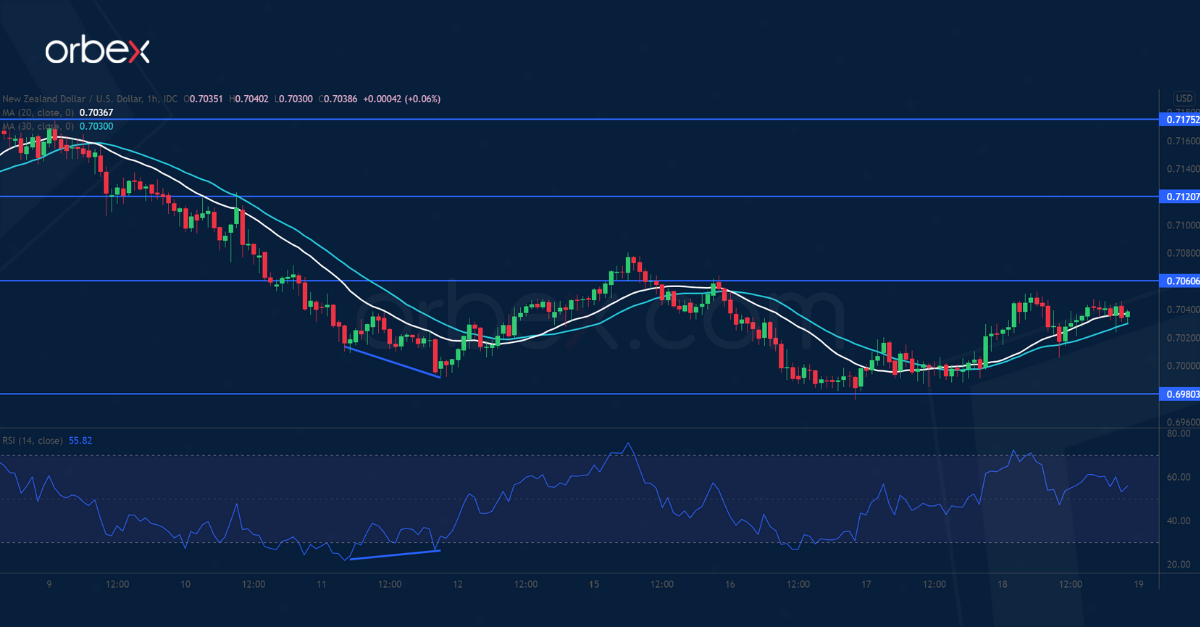
The New Zealand dollar inches higher as traders are positioning for an RBNZ rate hike next week. From the daily chart’s perspective, the pair has bounced off the demand zone near the psychological level of 0.7000.

A bullish RSI divergence indicates a slowdown in the bearish momentum, a sign that sentiment could be turning around. An oversold RSI has attracted buying interest.

A rally above 0.7060 would prompt sellers to cover, paving the way for a recovery towards 0.7175. A break below 0.6980 may drive the kiwi to 0.6900.

US30 struggles to rally back

DJIA

The Dow Jones is under pressure as investors fear that inflation could choke off economic recovery.

The index has been struggling to reclaim the landmark 36000, which coincides with the 20-day moving average. The faded rebound suggests exhaustion after a month-long breakneck rally.

The RSI’s double-dip into the oversold area has attracted buying interest. Though buyers may stay cautious unless the first resistance at 36180 is lifted. On the downside, the previous peak at 35500 has turned into the next support.


Orbex-LogoArticle by Orbex

Orbex is a fully licensed broker that was established in 2011. Founded with a mission to serve its traders responsibly and provides traders with access to the world’s largest and most liquid financial markets. www.orbex.com

Fibonacci Retracements Analysis 19.11.2021 (AUDUSD, USDCAD)

Article By RoboForex.com

AUDUSD, “Australian Dollar vs US Dollar”

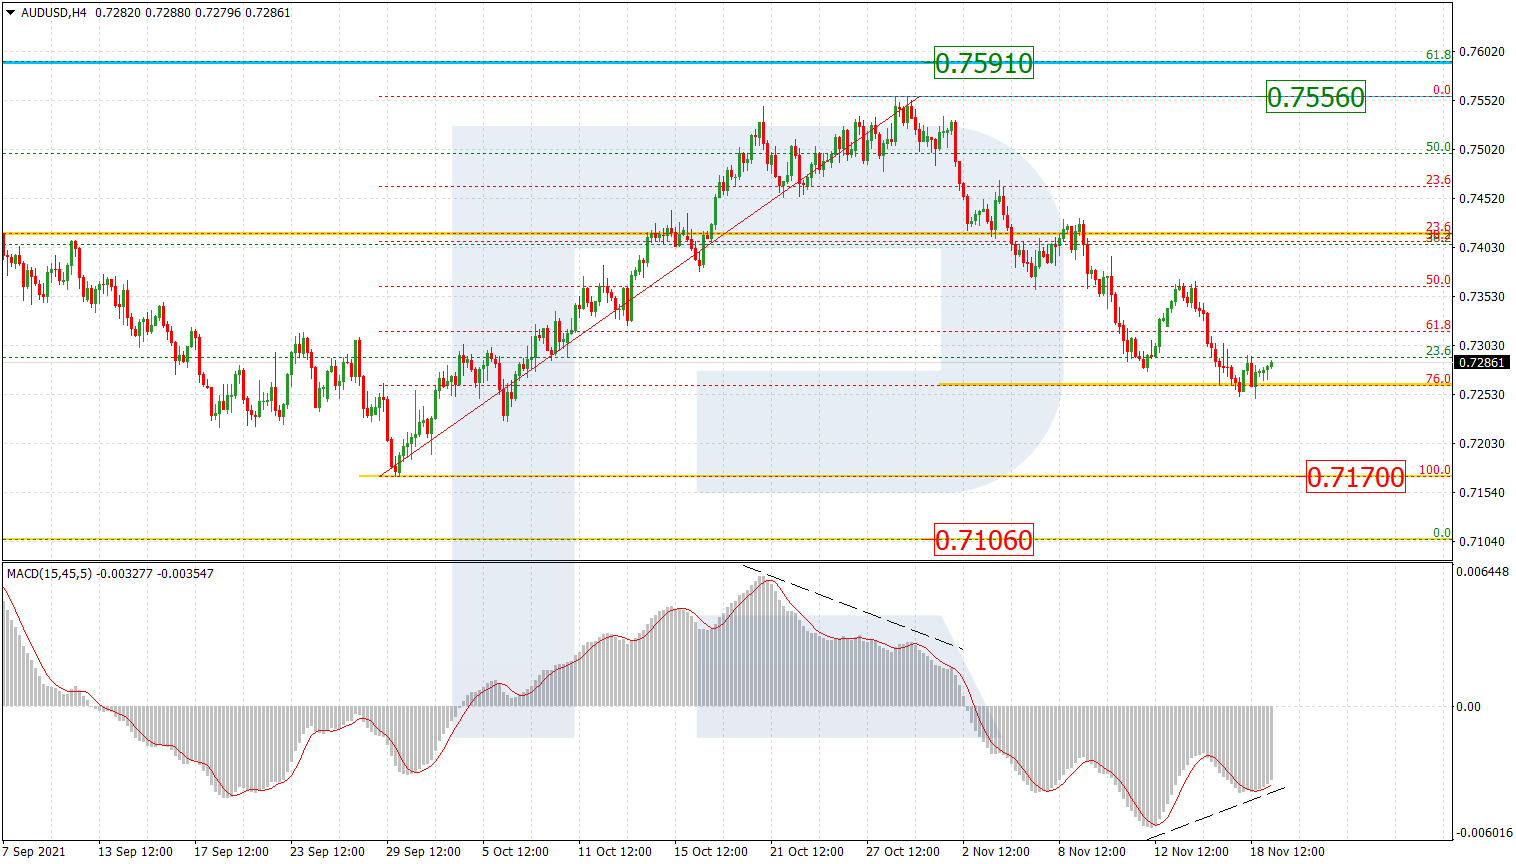
As we can see in the H4 chart, AUDUSD has reached 76.0% fibo. Convergence on MACD indicates a possible pullback to the upside soon. After the pullback is over, the pair may resume falling to break the local support at 0.7170 and then reach the low at 0.7106. The resistance is the local high at 0.7556.

AUDUSD_H4
Risk Warning: the result of previous trading operations do not guarantee the same results in the future

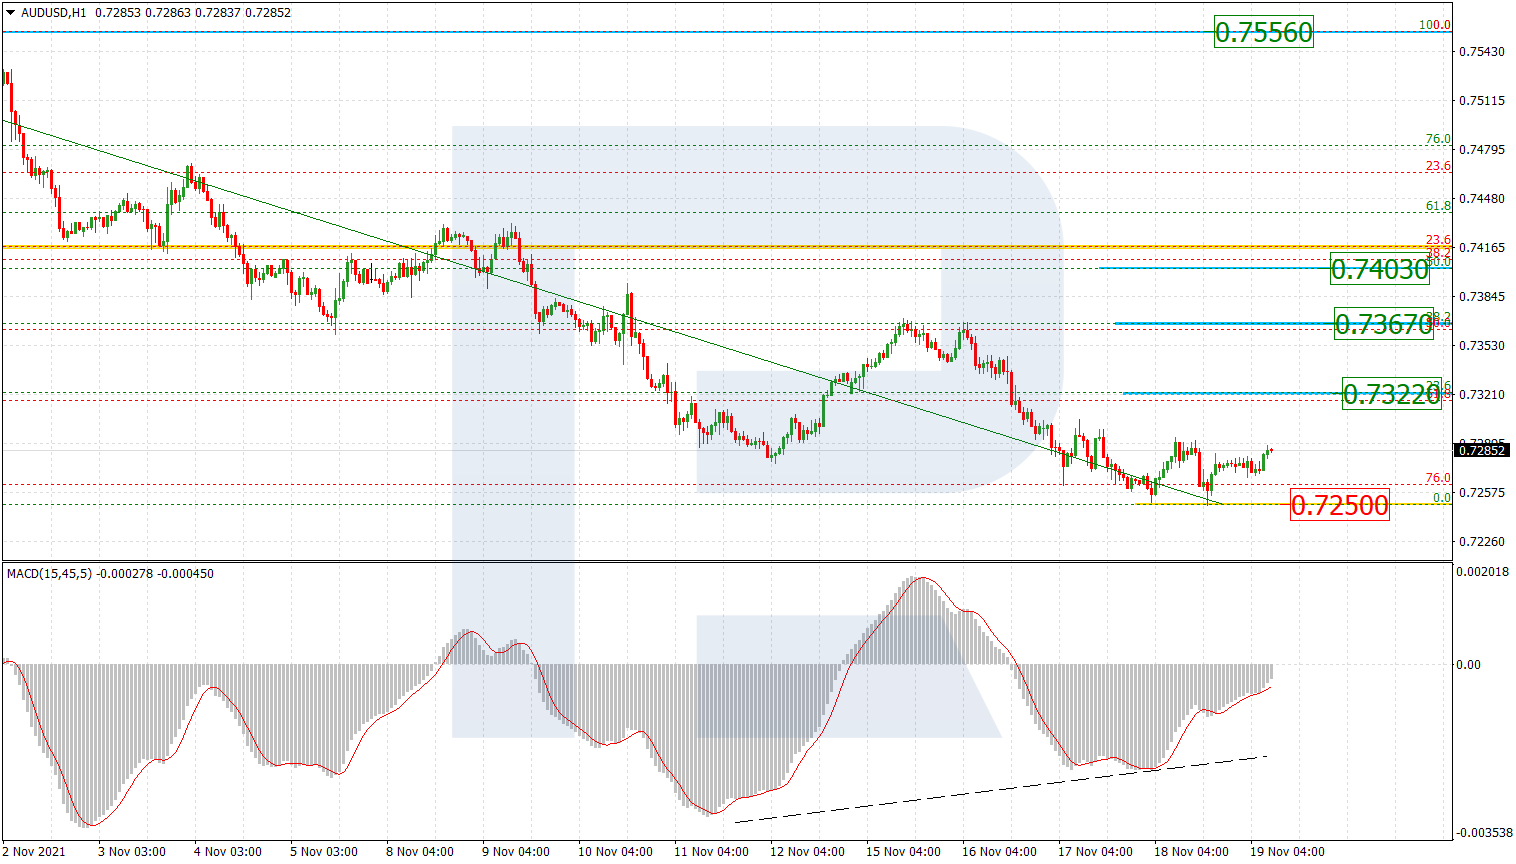
The H1 chart of AUDUSD shows that the start of a new growth after convergence on MACD, which may be heading towards 23.6%, 38.2%, and 50.0% fibo at 0.7322, 0.7367, and 0.7403 respectively. A breakout of the local low at 0.7250 will lead to a further downtrend.

AUDUSD_H1
Risk Warning: the result of previous trading operations do not guarantee the same results in the future

USDCAD, “US Dollar vs Canadian Dollar”

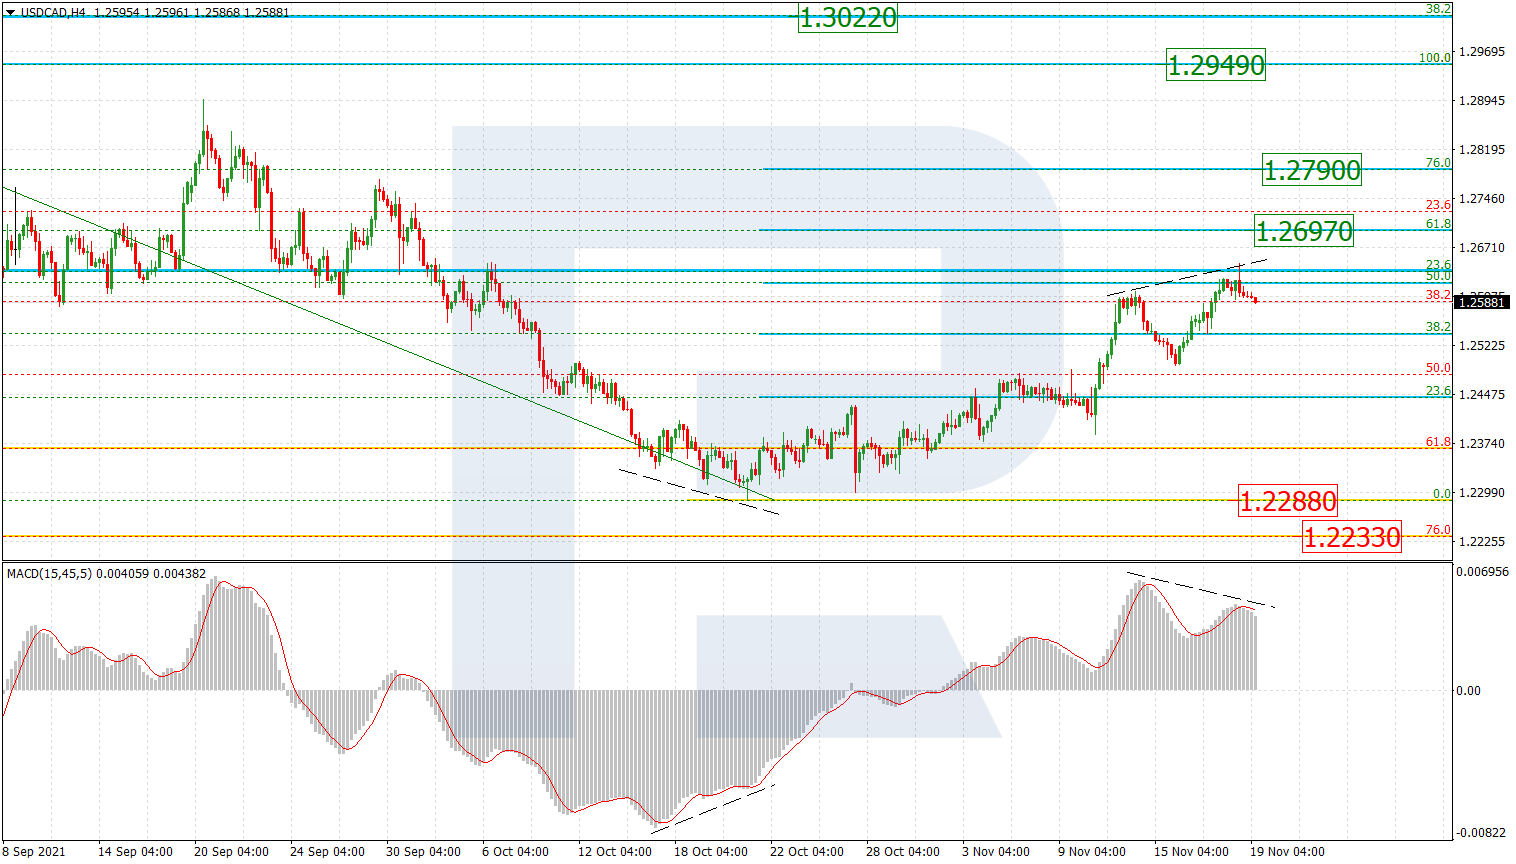
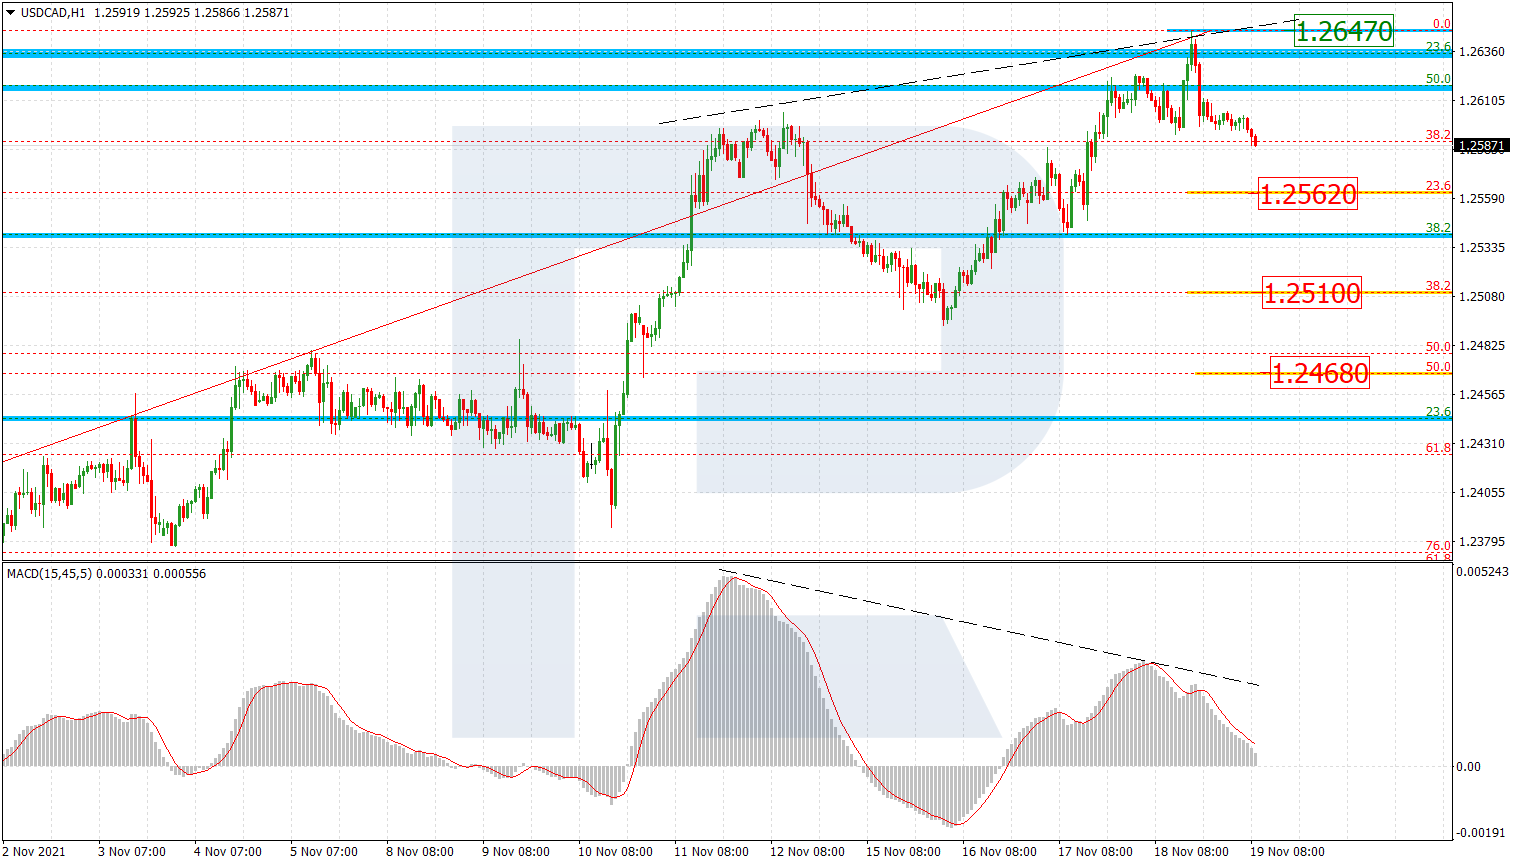
As we can see in the H4 chart, the correctional uptrend in USDCAD has reached 50.0% fibo. At the same time divergence on MACD hints that a further uptrend towards 61.8% and 76.0% fibo at 1.2697 and 1.2790 is highly unlikely. The main scenario implies a new descending wave to break the low at 1.2288 and reach the long-term 76.0% fibo at 1.2233.

USDCAD_H4
Risk Warning: the result of previous trading operations do not guarantee the same results in the future

The H1 chart shows potential short-term downside targets – 23.6%, 38.2%, and 50.0% fibo at 1.2562, 1.2510, and 1.2468 respectively. The local resistance is the high at 1.2647.

USDCAD_H1

Article By RoboForex.com

Attention!
Forecasts presented in this section only reflect the author’s private opinion and should not be considered as guidance for trading. RoboForex LP bears no responsibility for trading results based on trading recommendations described in these analytical reviews.

Ichimoku Cloud Analysis 19.11.2021 (EURUSD, AUDUSD, USDJPY)

Article By RoboForex.com

EURUSD, “Euro vs US Dollar”

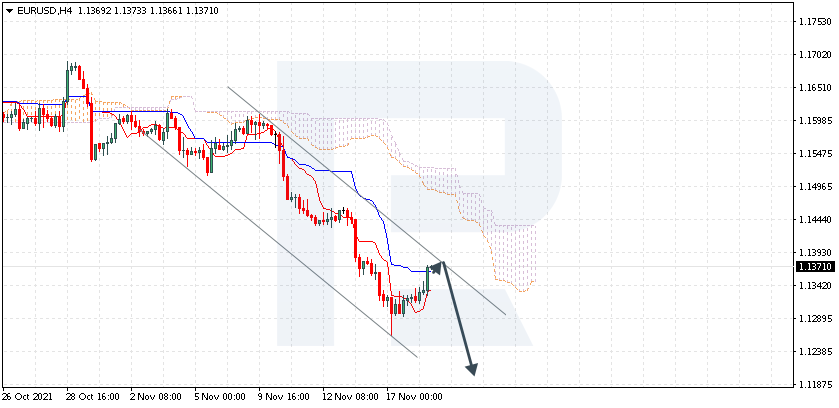
EURUSD is trading at 1.1371; the instrument is moving below Ichimoku Cloud, thus indicating a descending tendency. The markets could indicate that the price may re-test Tenkan-Sen and Kijun-Sen at 1.1380 and then resume moving downwards to reach 1.1205. Another signal in favour of a further downtrend will be a rebound from the descending channel’s upside border. However, the bearish scenario may no longer be valid if the price breaks the cloud’s upside border and fixes above 1.1515. In this case, the pair may continue growing towards 1.1605.

EURUSD
Risk Warning: the result of previous trading operations do not guarantee the same results in the future

AUDUSD, “Australian Dollar vs US Dollar”

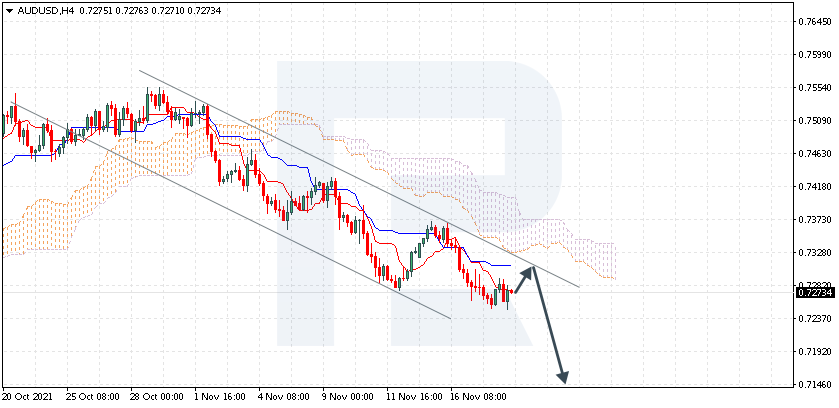
AUDUSD is trading at 0.7273; the instrument is moving below Ichimoku Cloud, thus indicating a descending tendency. The markets could indicate that the price may test Tenkan-Sen and Kijun-Sen at 0.7305 and then resume moving downwards to reach 0.7145. Another signal in favour of a further downtrend will be a rebound from the descending channel’s upside border. However, the bearish scenario may no longer be valid if the price breaks the cloud’s upside border and fixes above 0.7395. In this case, the pair may continue growing towards 0.7485.

AUDUSD
Risk Warning: the result of previous trading operations do not guarantee the same results in the future

USDJPY, “US Dollar vs Japanese Yen”

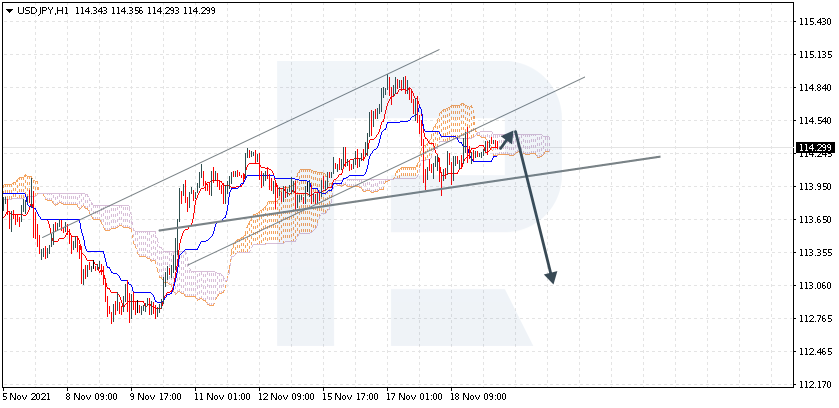
USDJPY is trading at 114.29; the instrument is moving inside Ichimoku Cloud, thus indicating a sideways tendency. The markets could indicate that the price may test the cloud’s upside border at 114.40 and then resume moving downwards to reach 113.05. Another signal in favour of a further downtrend will be a rebound from the upside border of a Head & Shoulders reversal pattern. However, the bearish scenario may no longer be valid if the price breaks the cloud’s upside border and fixes above 114.85. In this case, the pair may continue growing towards 115.75. To confirm further decline, the asset must break the reversal pattern’s “neckline” and fix below 113.85.

USDJPY

Article By RoboForex.com

Attention!
Forecasts presented in this section only reflect the author’s private opinion and should not be considered as guidance for trading. RoboForex LP bears no responsibility for trading results based on trading recommendations described in these analytical reviews.

The Analytical Overview of the Main Currency Pairs on 2021.11.19

by JustForex

The EUR/USD currency pair

Technical indicators of the currency pair:
  • Prev Open: 1.1319
  • Prev Close: 1.1372
  • % chg. over the last day: +0.47%

TThe housing price index in Germany increased more than 1% due to an influx of money from the European Central Bank. Germany has decided to invest free money in real estate.

Trading recommendations
  • Support levels: 1.1256
  • Resistance levels: 1.1386, 1.1436, 1.1535, 1.1613, 1.1667, 1.1717

From the technical point of view, the EUR/USD on the hour time frame is bearish. The Euro continues to show weakness. The MACD indicator has become positive, but the buyers’ pressure is weakening. Under such market conditions, traders should consider sell positions from the resistance levels near the moving average since the price has deviated strongly from the averages. Buy trades should be considered only from the support levels of the higher time frame, given the buyers’ initiative, but only with short targets.

Alternative scenario: if the price breaks out through the 1.1535 resistance level and fixes above, the mid-term uptrend will likely resume.

EUR/USD
News feed for 2021.11.19:
  • – ECB President Christine Lagarde’s Speech at 10:00 (GMT+2);
  • – US FOMC Member Waller speaks at 17:45 (GMT+2);
  • – US FOMC Member Clarida speaks at 19:15 (GMT+2);
  • – ECB President Christine Lagarde’s Speech at 22:00 (GMT+2).

The GBP/USD currency pair

Technical indicators of the currency pair:
  • Prev Open: 1.3480
  • Prev Close: 1.3499
  • % chg. over the last day: +0.14%

The British pound is slowly strengthening in anticipation that the Central Bank of England will raise the interest rate at its next meeting. On the interbank lending market in London, there is an increase in Libor rates. This indicates that bankers have already started to consider a future interest rate hike.

Trading recommendations
  • Support levels: 1.3434, 1.3360
  • Resistance levels: 1.3507, 1.3575, 1.3685, 1.3748

On the hourly time frame, the trend on GBP/USD is bearish. But the British pound looks more confident than the euro. The MACD indicator has become inactive. Under such market conditions, traders should consider sell positions from the priority change level. Buy trades should be considered only from the support levels of the higher time frame, given the buyers’ initiative.

Alternative scenario: if the price breaks out through the 1.3575 resistance level and consolidates above, the bullish scenario will likely resume.

GBP/USD
News feed for 2021.11.19:
  • – UK Retail Sales (m/m) at 09:00 (GMT+2).

The USD/JPY currency pair

Technical indicators of the currency pair:
  • Prev Open: 114.10
  • Prev Close: 114.24
  • % chg. over the last day: +0.12%

Japan’s consumer price index increased by 0.1% in October. The Bank of Japan does not expect a significant increase in inflation in the country. The country’s Prime Minister Fumio Kishida will soon present a new stimulus package, which, in particular, will include measures to mitigate the negative economic consequences of rising energy prices.

Trading recommendations
  • Support levels: 113.79, 113.32, 112.87, 112.30
  • Resistance levels: 114.42, 115.15, 115.50

The global trend on the USD/JPY currency pair is bullish. But the price has corrected to the moving average line. The MACD indicator has become inactive. Under such market conditions, it’s better to look for buy positions from the buyers’ initiative zone near the moving average. Sell positions should be considered from the resistance levels of higher time frames, given there is sellers’ initiative, but only with short targets.

Alternative scenario: if the price falls below 113.32, the uptrend will likely be broken.

USD/JPY
News feed for 2021.11.19:
  • – Japan National Core Consumer Price Index (m/m) at 01:30 (GMT+2).

The USD/CAD currency pair

Technical indicators of the currency pair:
  • Prev Open: 1.2608
  • Prev Close: 1.2597
  • % chg. over the last day: -0.09%

The Canadian dollar is a commodity currency, so the USD/CAD currency pair highly depends on the dynamics of the dollar index and oil prices. Yesterday, the dollar index slightly decreased while oil prices increased. As a result, the USD/CAD currency pair declined slightly due to the strengthening of the Canadian currency. Fundamentally, both the dollar index and oil quotes have an upward trend now, so USD/CAD will be trading flat in the medium term.

Trading recommendations
  • Support levels: 1.2598, 1.2496, 1.2416, 1.2388
  • Resistance levels: 1.2628, 1.2729

From a technical point of view, the trend of the USD/CAD currency is bullish. The MACD indicator is in the positive zone, but there are signs of divergence, which indicates the weakness of the buyers. Under such market conditions, it is better to look for buy trades from the support levels near the moving average. Sell deals should be considered from the resistance levels of the higher time frame or after the price returns to the corridor of 1.2496-1.2598.

Alternative scenario: if the price breaks down through the 1.2416 support level and fixes below, the downtrend will likely resume.

USD/CAD
News feed for 2021.11.19:
  • – Canada Retail Sales (m/m) at 15:30 (GMT+2).

by JustForex


This article reflects a personal opinion and should not be interpreted as an investment advice, and/or offer, and/or a persistent request for carrying out financial transactions, and/or a guarantee, and/or a forecast of future events.