Global Markets-It’s Do-Or-Die Time

By TheTechnicalTraders 

– Almost all of the US and global markets volatility has taken place over the last 6+ trading days. Even though economic data continues to show a strengthening US economy and jobs market, the news of the Omicron COVID variant has spooked the global markets. I’m going to illustrate how the markets are nearing critical support levels that are a “Do-Or-Die” level for the market, in my opinion.

Let’s get right into the charts – shall we?

NASDAQ Support Near $15,721 Should Act As A Solid Floor

This NASDAQ chart highlights the orange support level near $15,271 that I believe will act as a HARD FLOOR/SUPPORT for the US markets. We may see $14,750 become the next downside target level if the NQ falls below this level on strong selling. If this support level holds, then I expect the US markets to resume a rally trend and attempt to target $17,000 or higher before the end of 2021.

Custom US Stock Market Index Confirms Support Near $15,721

This Custom US Stock Market Weekly Chart highlights the key support channel that originates in early 2021 and spans across recent lows (the DARK BLUE LINE). My opinion is that the alignment of the $15,721 support level from the chart above and this key support channel on the Custom US Stock Market Index chart creates a confluence of critical support. This level becomes a “Do-Or-Die” level for the markets to attempt to bottom and recover going forward.

Custom Volatility Index Sets Up A Deep Potential Bottom Level

Lastly, this Weekly Custom Volatility Index chart highlights the multiple deep downside support ranges that have continued to drive future price rallies since the original COVID collapse. The current Custom Volatility Index level is below the last two pullbacks in the US markets and well within the support channel from late 2020 and early 2021.

This Custom Volatility Index would clearly show a breakdown in the US markets by moving below the 6.0 to 6.50 level on strong selling pressure. That is currently not happening, and I suspect the lack of real selling pressure reflects a panic selling mode – not a change in true price trend.

My opinion is the US markets will struggle to hold near recent lows – attempting to hammer out a bottom/base over the next few days. If these critical support levels fail to prompt a bottom in price, we’ll know soon enough. The markets can stay irrational far longer than many people expect.

The next 2 to 5+ trading days should clearly show us if these support levels and channels are solid or not. If the global markets are going to continue to move lower, we should find out soon enough.

Sign up for my free trading newsletter so you don’t miss the next opportunity!

If I’m correct and the markets do hold up near these support channels, we may begin to see a new “Rip-Your-Face-Off” rally phase to start a powerful Santa Rally closing out 2021. That would be incredible to witness and experience.

Watch for support near $15,721 to $15,750 on the NQ over the next 5+ trading days. I believe that level is the “Do-Or-Die” level for the markets going forward.

Curious to Learn More about global markets?

Learn how I use specific tools to help me understand price cycles, set-ups, and price target levels. Over the next 12 to 24+ months, I expect very large price swings in the US stock market and other asset classes across the globe. I believe the markets are beginning to transition away from the continued central bank support rally phase and may start a revaluation phase as global traders attempt to identify the next big trends. Precious Metals will likely begin to act as a proper hedge as caution and concern start to drive traders/investors into Metals.

If you need technically proven trading and investing strategies using ETFs to profit during market rallies and to avoid/profit from market declines, be sure to join me at TEP – Total ETF Portfolio.

Have a great day!

Chris Vermeulen
Chief Market Strategist

TheTechnicalTraders.com

Junk Bonds Are Sending a Signal to Stock Investors

Something happened just before the historic 2007 stock market top — and it’s happening again

By Elliott Wave International

It’s generally known that stocks are risky. It all hinges on how “hungry” investors are.

So, if investors’ appetite for risk starts to diminish, it stands to reason that this is not a positive development for stocks.

But is there a way to gauge investors’ risk tolerance so as to get an early warning sign before stocks start to tank?

Yes, keep your eye on the junk bond market.

You see, junk bonds also carry a great deal of risk because they’re issued by companies with the weakest balance sheets. Investors’ claim on assets in case of bankruptcy is usually next to the bottom rung, just one notch above equity holders. Hence, the trend in junk bonds often aligns with the trend in equities.

Here’s the important point: When the trends of stocks and junk bonds diverge, with stocks holding up as the value of junk debt declines, it’s usually a sign of impending trouble for stocks.

A past Elliott Wave Financial Forecast, a monthly publication which provides coverage of major U.S. financial markets, showed a historical example of such a divergence and said:

A countertrend rally high in prices for high-yield bonds occurred in February 2007, three months before the intraday extreme in the financials, five months before a top in the Dow Jones Composite Average and eight months before a top in the Dow Industrials. All stock indexes then crashed into the first quarter of 2009.

Now, here’s what you need to know in these closing weeks of 2021: Another divergence has been shaping up between high-yield (or “junk”) bonds and stocks.

Indeed, the Nov. 15 U.S. Short Term Update, an Elliott Wave International thrice weekly publication which offers near-term forecasts for key U.S. financial markets, explains why …

… the tension created by the nearly two-month non-confirmation between HYG [a junk bond ETF] and the Dow is about to become more severe.

Plus, the message of the Elliott wave model regarding the stock market is also revealing.

If you’re new to Elliott wave analysis, here’s a quote from Frost & Prechter’s Wall Street classic, Elliott Wave Principle: Key to Market Behavior:

In the 1930s, Ralph Nelson Elliott discovered that stock market prices trend and reverse in recognizable patterns. The patterns he discerned are repetitive in form but not necessarily in time or amplitude. Elliott isolated five such patterns, or “waves,” that recur in market price data. He named, defined and illustrated these patterns and their variations. He then described how they link together to form larger versions of themselves, how they in turn link to form the same patterns of the next larger size, and so on, producing a structured progression. He called this phenomenon The Wave Principle.

Although it is the best forecasting tool in existence, the Wave Principle is not primarily a forecasting tool; it is a detailed description of how markets behave. Nevertheless, that description does impart an immense amount of knowledge about the market’s position within the behavioral continuum and therefore about its probable ensuing path. The primary value of the Wave Principle is that it provides a context for market analysis.

If you’d like to learn more about the Wave Principle, there’s a way to read the entire online version of the book for free.

That “way” is to become a Club EWI member. Club EWI is the world’s largest Elliott wave educational community and membership is free. Plus, members enjoy free access to a wealth of Elliott wave resources on financial markets, investing and trading with zero obligations.

Just follow this link to get started: Elliott Wave Principle: Key to Market Behavior — free and unlimited access.

This article was syndicated by Elliott Wave International and was originally published under the headline Junk Bonds Are Sending a Signal to Stock Investors. EWI is the world’s largest market forecasting firm. Its staff of full-time analysts led by Chartered Market Technician Robert Prechter provides 24-hour-a-day market analysis to institutional and private investors around the world.


Can The November NFP Revert The Markets?

By Orbex

Every new bit of information about the omicron variant of covid has been jostling the markets lately. So. many might have forgotten that tomorrow is the release of NFP data. On the other hand, maybe for some, it might seem like “old” data, as it covers a time before the markets were once again fretting about the virus.

The fundamentals of the economy, nonetheless, are still there. And regardless of how the new variant turns out, they are the starting point for where things will be going.

If the variant turns out to be just like the dozens of others that were of concern but didn’t change the trajectory, then we need to know what the markets will return to. If it turns out to be the new “delta”, potentially causing another economic problem, then we need to know how the economy is doing.

The potential reaction

A substantially above-expectations print in the NFP data could help risk sentiment find its footing. After a week of lackluster data, the report could give the catharsis the market needs to regain its bearings. Especially considering the other risk events going into the weekend.

A disappointing result in NFP, coupled with other concerns, could drive the market lower.

There are worries that Congress will have difficulties getting through a continuing resolution to keep the government open after December 3rd. The discussion could come down to the wire, as fast approvals of new spending require unanimous consent. That said, Republicans could seize the opportunity to make demands.

Without an agreement before the close of trading, investors might lean heavily on safe haven assets going into a fraught weekend.

What to look out for

In the post-covid era of recovery, the consensus seems to be settling around the need for there to be around 500K job additions a month, to reach a successful recovery.

The US still has over 8 million job openings, despite a declining labor force participation rate. So, anything above that number and the market will be “satisfied” with the result, for the most part.

If it’s below 500K we could see the market getting concerned again. Especially if we consider that November is usually when retailers take on more staff ahead of holiday spending. If we expect a consumer boost through the last two months of the year, we ought to expect higher jobs numbers now.

The expectations

The consensus among analysts is that there will be a marginal improvement in hiring. Specifically, they are forecasting 550K jobs created in November. That is significantly higher than 531K created in the prior month.

But one of the things that’s also been a theme lately is larger than usual revisions to the prior month’s data. Even if the results are bang in line with expectations, we could still see a move in the market from changes in the prior month.

The unemployment rate may fall another decimal to 4.5% from 4.6% in October. That’s despite the expectation of an increase in the participation rate to 61.7% from 61.6%.

The Fed generally cares about the employment to population ratio, so they would likely take this as a sign that they are on the right track.


Orbex-LogoArticle by Orbex

Orbex is a fully licensed broker that was established in 2011. Founded with a mission to serve its traders responsibly and provides traders with access to the world’s largest and most liquid financial markets. www.orbex.com

AMZN Triple Zigzag Ending Near 2867.82

By Orbex

Amazon

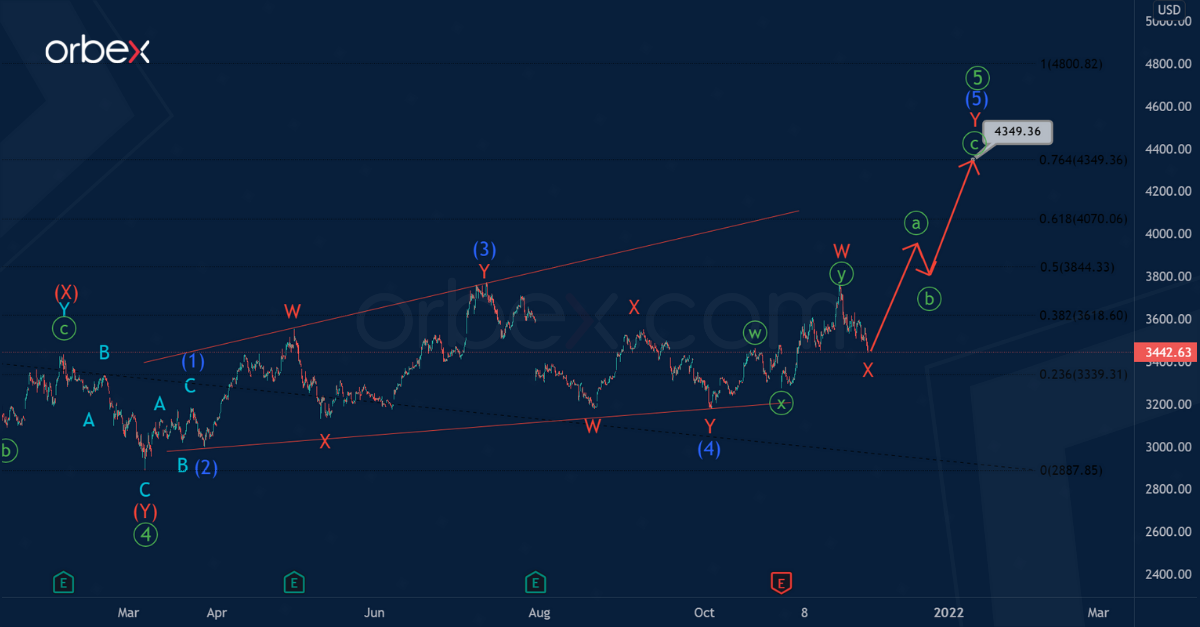
The current AMZN structure shows a bullish impulse. This includes the formation of a deep fourth wave of the primary degree.

The primary correction wave ④, apparently, takes the form of an intermediate triple combination (W)-(X)-(Y)-(X)-(Z). Let’s pay attention to the last wave (Z), which is not enough to complete the correction pattern.

Wave (Z) most likely takes the form of a triple zigzag W-X-Y-X-Z. The minute ending diagonal could have finished the development of the minor intervening wave X. So, the price could fall in the minor wave Z in the direction of the price level of 2867.82 soon.

At that level, wave Z will be at 161.8% of wave Y.

Then bulls could enter the market and push the price in the primary fifth wave above the level of 3772.99, marked by an intermediate intervening (X), as shown on the chart.

Amazon

However, the formation of the primary correction ④ could have ended. And now the primary fifth wave is developing, taking the form of an ending diagonal (1)-(2)-(3)-(4)-(5) of the intermediate degree.

It seems that correction (4) in the form of a minor double zigzag W-X-Y has come to an end not so long ago. An intermediate wave (5), taking the form of a double zigzag W-X-Y, is currently under construction.

In the near future, market participants can expect the construction of a minute zigzag ⓐ-ⓑ-ⓒ, which forms the final minor wave Y. Growth in this zigzag is possible near 4349.36. At that level, wave ⑤ will be at 76.4% of primary impulse wave ③.


Orbex-LogoArticle by Orbex

Orbex is a fully licensed broker that was established in 2011. Founded with a mission to serve its traders responsibly and provides traders with access to the world’s largest and most liquid financial markets. www.orbex.com

Omicron and market sell-off: don’t be surprised if there’s more turbulence to come

By Arturo Bris, International Institute for Management Development (IMD)

Until the Omicron variant hit the headlines, the signs were that 2021 was going to close with a stellar stock-market performance. Most markets have been on the rise since the beginning of the year, with the S&P500 up about 25% and the FTSE All Share index up by about 10%.

There had certainly been some concern that share valuations were irrationally high. This concern was justified – especially if we take into account that most markets closed 2020 on a positive note, too. Having experienced the worst pandemic in 100 years, and also a significant global recession, it seems nonsense that stock markets should have gone so high – yet there seemed no signs of anything that would stop them.

But then came the news of the Omicron variant and the fear that surrounds it, which led to a massive selloff on November 26 (and a partial rebound at the time of writing). So what should we make of this? Are financial markets acknowledging that we have been in a bubble, with share prices misaligned with the real economy, or is this just a temporary panic before a continuation upwards?

What we know so far

These are the facts: new coronavirus variant B.1.1.529 spread significantly in South Africa and Botswana and was identified as more contagious and less controllable than previously known variants. Daily cases in South Africa are now nearing 3,000, which is still not much more than one-tenth of the peak reached in July. Only 24.4% of the population is vaccinated.

Cases of the Omicron variant have now been detected in many other countries, including the UK, Egypt, Belgium and Ireland. With the World Health Organization (WHO) warning that the new variant was likely to spread further and “poses a very high global risk”, many countries have closed their borders to air traffic from southern Africa. Simultaneously, the US, UK, EU, India and several other nations have implemented new restrictions on mobility and travel.

Despite the panic, Dr Angelique Coetzee – the doctor who first spotted the new variant, who also chairs the South African Medical Association – has told the BBC that symptoms linked to Omicron have been extremely mild. Meanwhile, pharmaceutical companies are analysing whether their vaccines provide safe enough protection against Omicron, though we are yet to see conclusive results in any direction.

So it could well be that, despite the faster spread of the infection, its ultimate health, social and economic impact proves negligible. We simply do not know at this point. But detecting more uncertainty than before, financial markets have reacted with panic. For example, the S&P500 tumbled 2.3% on Friday November 26 only to rise 1.1% on Monday November 29. Most markets gave up between 2% and 4%, which is a pretty substantial one-day fall.

Future dangers

What worries me most about the current economic environment is not so much the possibility that a new wave of infections pushes the beginning of the recovery even further back, but that the great uncertainty regarding the end of the pandemic hinders our ability to make decisions for the future. For example, companies are deferring important investments until the dust clears (like expanding current businesses or making acquisitions). Similarly, staff increases may be put off to avoid the risk of downsizing if the pandemic worsens again.

The real concern is that this is for reasons that are difficult to resolve in any quick timeframe: the winding road towards immunising the whole world, the lack of information about the effectiveness of the vaccine against all possible COVID variants, and the feeling that we cannot see the light at the end of the tunnel because the tunnel is longer than we thought.

It does not bode well if we compare monthly stock returns of the S&P500 in 2020 and 2021. If we exclude January and February as pre-pandemic months in most countries in 2020 (and exclude December 2021 since we don’t yet have data), it is striking to observe that 2020 was better in six out of nine months (the exceptions being March, June and September).

I remember how, back on New Year’s Eve 2020, I toasted 2021 – thinking that it could not be any worse than what we were leaving behind. But it is becoming clear that uncertainty today is even greater than a year ago, when we did even not have the vaccines that we have today.

Until we know when we will get rid of this virus and how our economies will regain strength, it will be too early to talk about recovery. So while investors and pension holders may see markets rising further into irrational territory in the weeks and months ahead, they will also be vulnerable to unpredictable lurches back down.The Conversation

About the Author:

Arturo Bris, Professor of Finance, International Institute for Management Development (IMD)

This article is republished from The Conversation under a Creative Commons license. Read the original article.

Japanese Candlesticks Analysis 02.12.2021 (EURUSD, USDJPY, EURGBP)

Article By RoboForex.com

EURUSD, “Euro vs US Dollar”

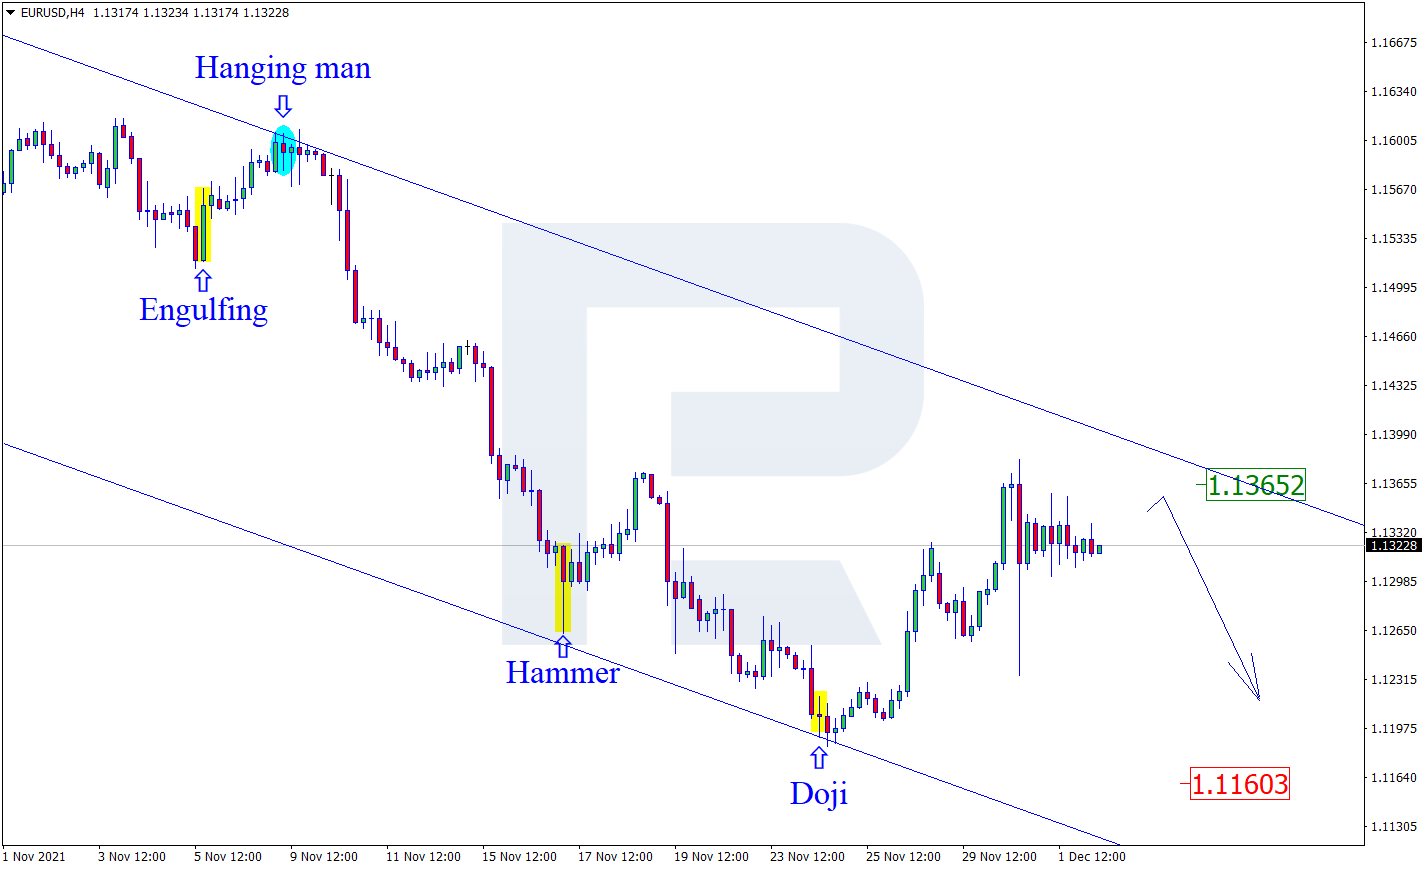
As we can see in the H4 chart, the asset has formed several reversal patterns, including Doji, close to the support level. At the moment, EURUSD may reverse and start a new correctional impulse. In this case, the upside correctional target may be at 1.1365. Later, the market may rebound from the resistance area and resume the descending tendency. However, an alternative scenario implies that the price may continue falling to reach 1.1160 without testing the descending channel’s upside border.

EURUSD
Risk Warning: the result of previous trading operations do not guarantee the same results in the future

USDJPY, “US Dollar vs Japanese Yen”

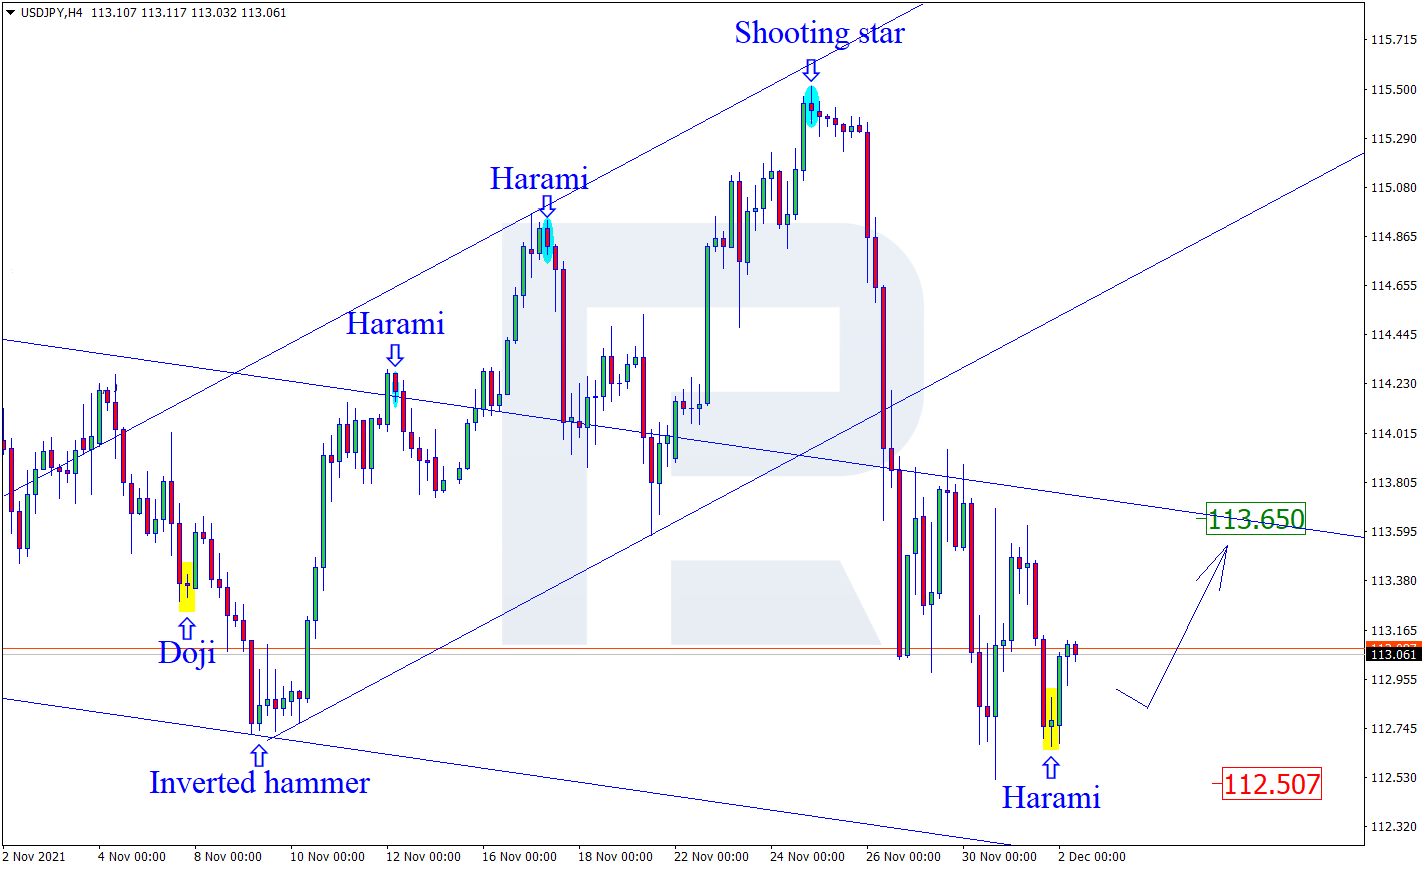
As we can see in the H4 chart, USDJPY has formed several reversal patterns, for example, Harami, while testing the support area. At the moment, USDJPY may reverse and start a new wave to the upside towards the resistance level. In this case, the upside target may be at 113.65. At the same time, an opposite scenario implies that the price may continue falling to reach 112.50 without correcting and reaching the resistance level.

USDJPY
Risk Warning: the result of previous trading operations do not guarantee the same results in the future

EURGBP, “Euro vs Great Britain Pound”

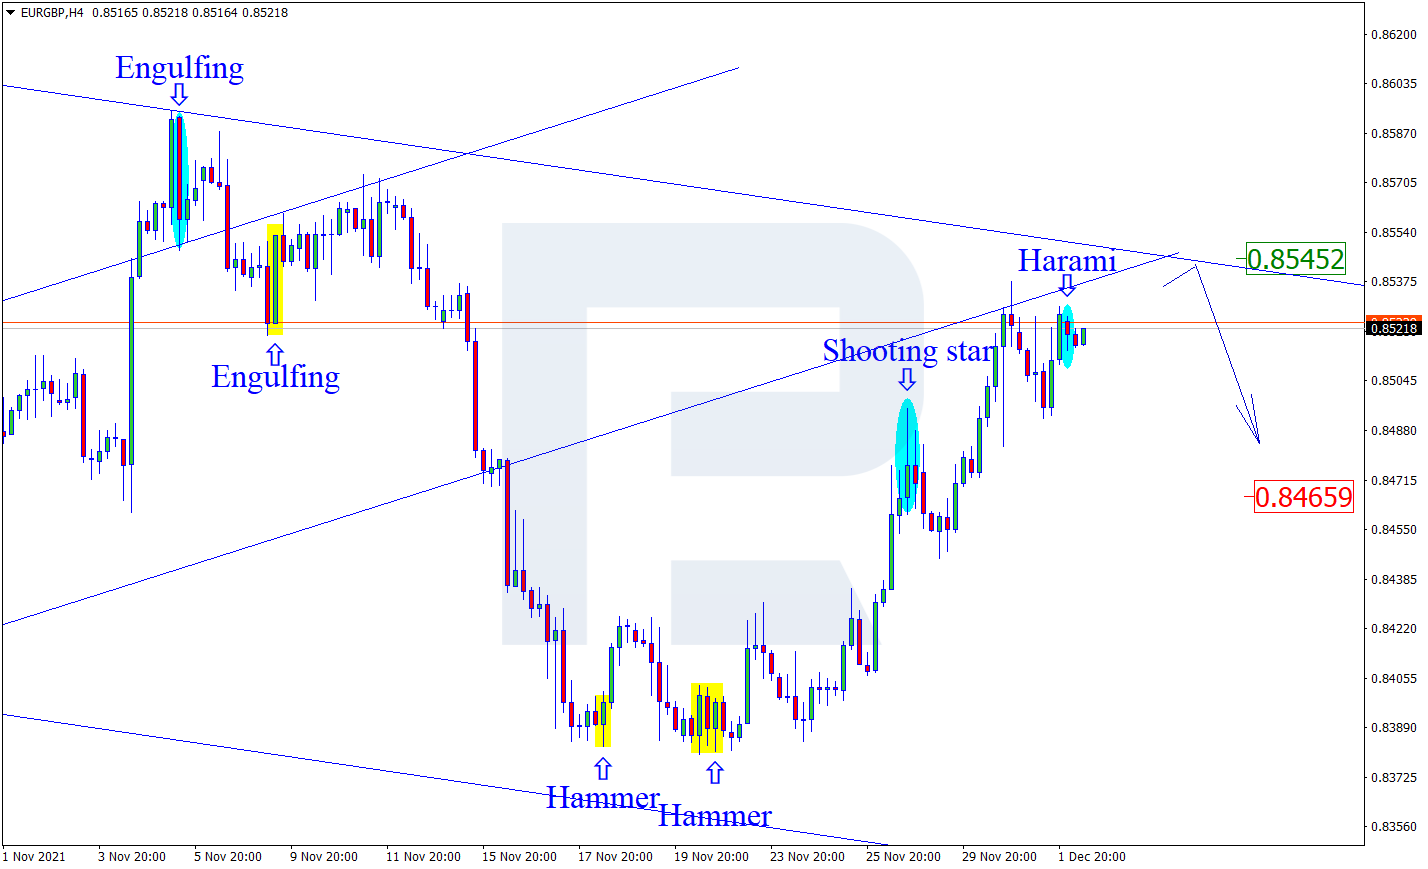
As we can see in the H4 chart, after forming a Harami reversal pattern near the resistance level, EURGBP is reversing and may start another decline towards the support area. In this case, the downside target may be at 0.8465. Later, the market may test the area, break it, and continue the descending tendency. Still, there might be an alternative scenario, according to which the asset may continue growing to reach the channel’s upside border at 0.8545 before resuming its decline.

EURGBP

Article By RoboForex.com

Attention!
Forecasts presented in this section only reflect the author’s private opinion and should not be considered as guidance for trading. RoboForex LP bears no responsibility for trading results based on trading recommendations described in these analytical reviews.

Intraday Market Analysis – USD Accumulates Support

By Orbex

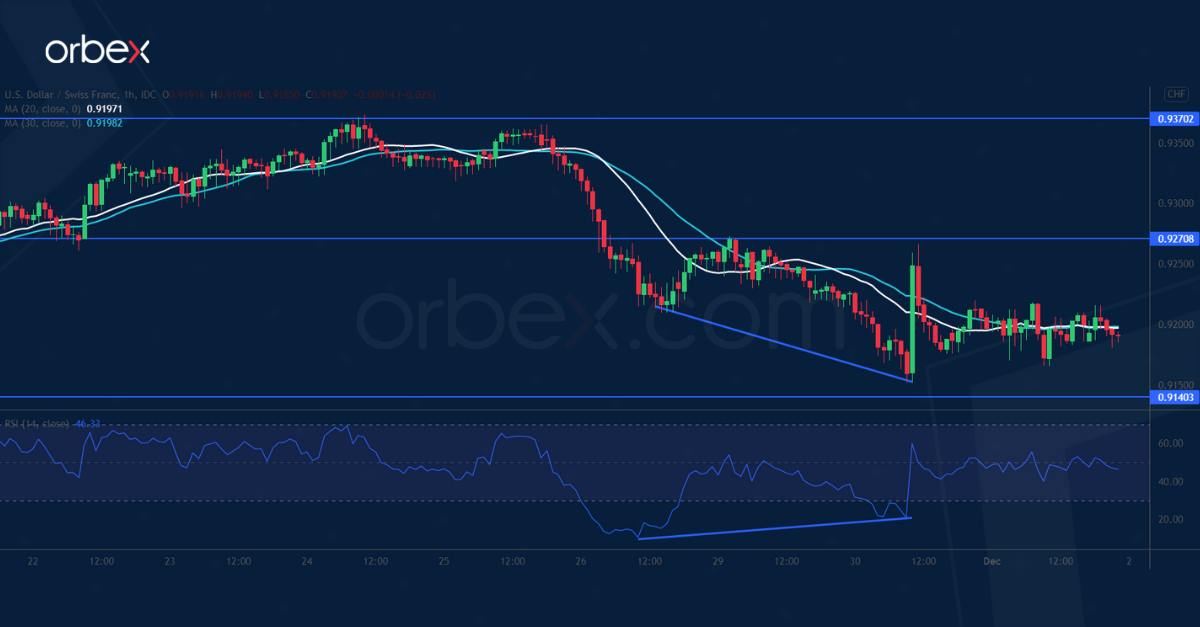
USDCHF to test key support

USDCHF

The US dollar stabilized after Jerome Powell hinted at speeding up the taper pace. The break below 0.9270 has put the rally on hold. The support has turned into resistance with the latest rebound fading.

But a bullish divergence suggests a loss of momentum in the retracement as the price approaches 0.9140. Buying could be expected in this demand zone around November’s low 0.9100.

Sentiment remains upbeat as long as the greenback is above this level. A bounce above 0.9270 may resume the uptrend.

XAGUSD remains under pressure

XAGUSD

Silver struggled after US Treasury yields jumped on Fed’s hawkish tilt. A bearish MA cross on the daily chart indicates a deterioration in the market mood after a drop below the floor at 23.00.

An oversold RSI caused a limited rebound which was then capped by 23.30. This was a sign that the bears were still in control of the direction.

The psychological level of 22.00 is the next support. Its breach would lead to September’s lows at 21.50, an important level to keep the metal afloat in the medium term.

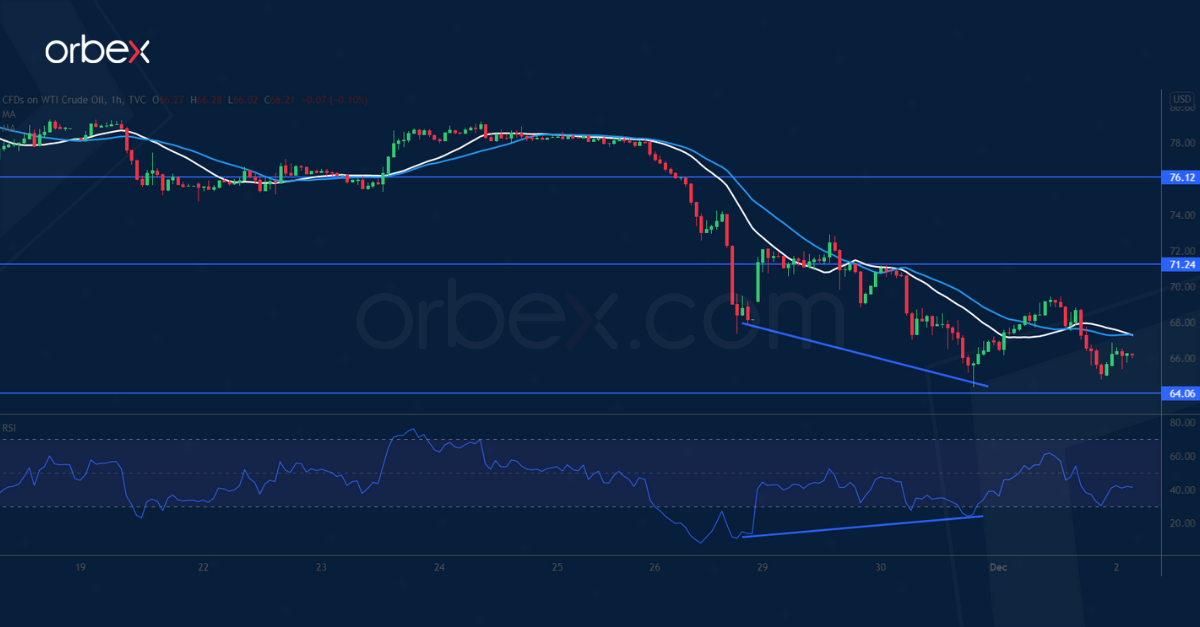
USOIL tests major demand zone

US OIL

WTI crude inches higher as OPEC+ discuss whether to let additional output flow as previously planned. The price is hovering above a major demand zone between 62.00 and 64.00.

A bullish RSI divergence indicates that the selling pressure might have eased. A rally above 71.20 could force the short side to cover and bring in more buying momentum. Then 76.00 would be the next hurdle before a full-blown recovery.

On the downside, a bearish breakout could trigger a broader sell-off and potentially derail a 19-month long rally.


Orbex-LogoArticle by Orbex

Orbex is a fully licensed broker that was established in 2011. Founded with a mission to serve its traders responsibly and provides traders with access to the world’s largest and most liquid financial markets. www.orbex.com

Murrey Math Lines 02.12.2021 (USDCHF, GOLD)

Article By RoboForex.com

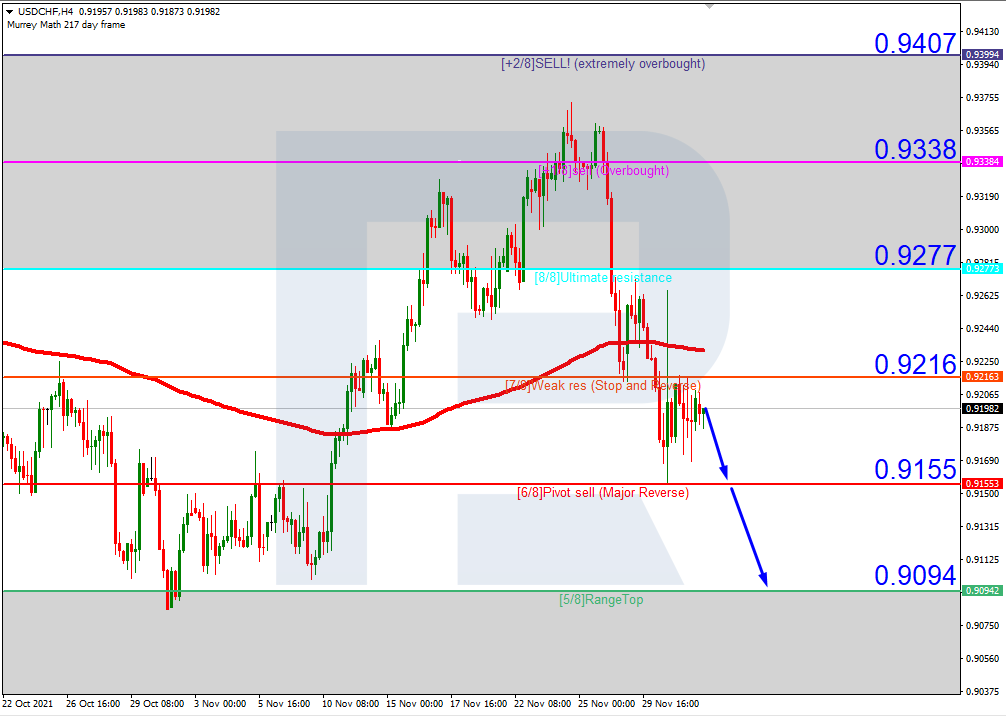
USDCHF, “US Dollar vs Swiss Franc”

As we can see in the H4 chart, after breaking the 200-day Moving Average, USDCHF is trading below it, thus indicating a possible descending tendency. In this case, the price is expected to test 6/8, break it, and then continue falling to reach the support at 5/8. However, this scenario may be cancelled if the price breaks the resistance at 7/8 to the upside. After that, the instrument may grow towards the next resistance at 8/8.

USDCHFH4
Risk Warning: the result of previous trading operations do not guarantee the same results in the future

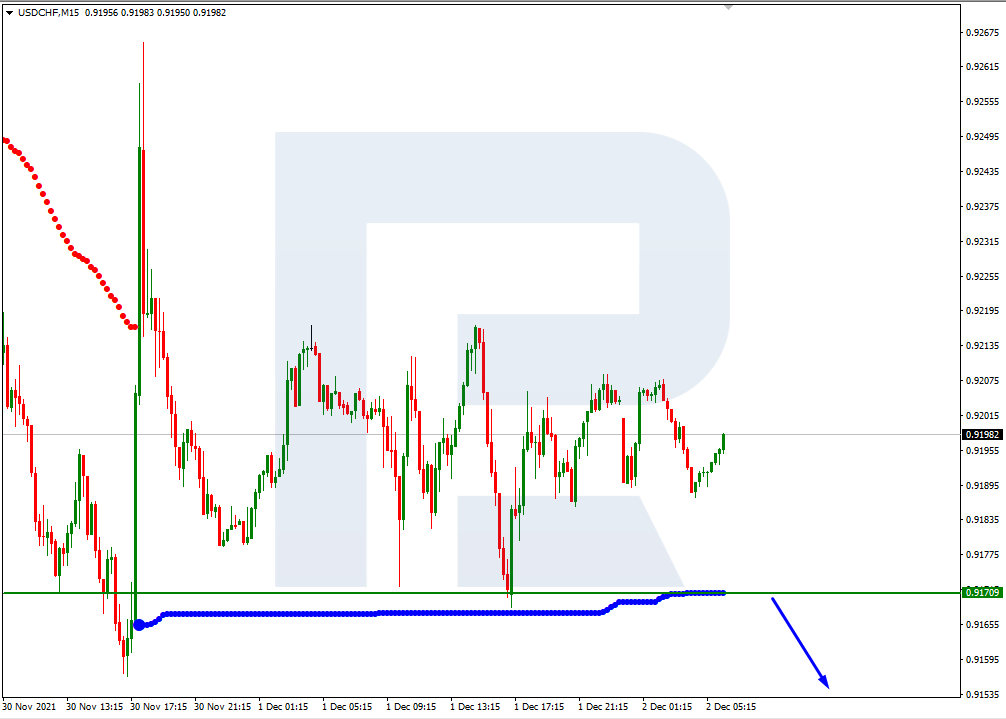
In the M15 chart, the pair may break the downside line of the VoltyChannel indicator and, as a result, continue trading downwards.

USDCHF_M15
Risk Warning: the result of previous trading operations do not guarantee the same results in the future

XAUUSD, “Gold vs US Dollar”

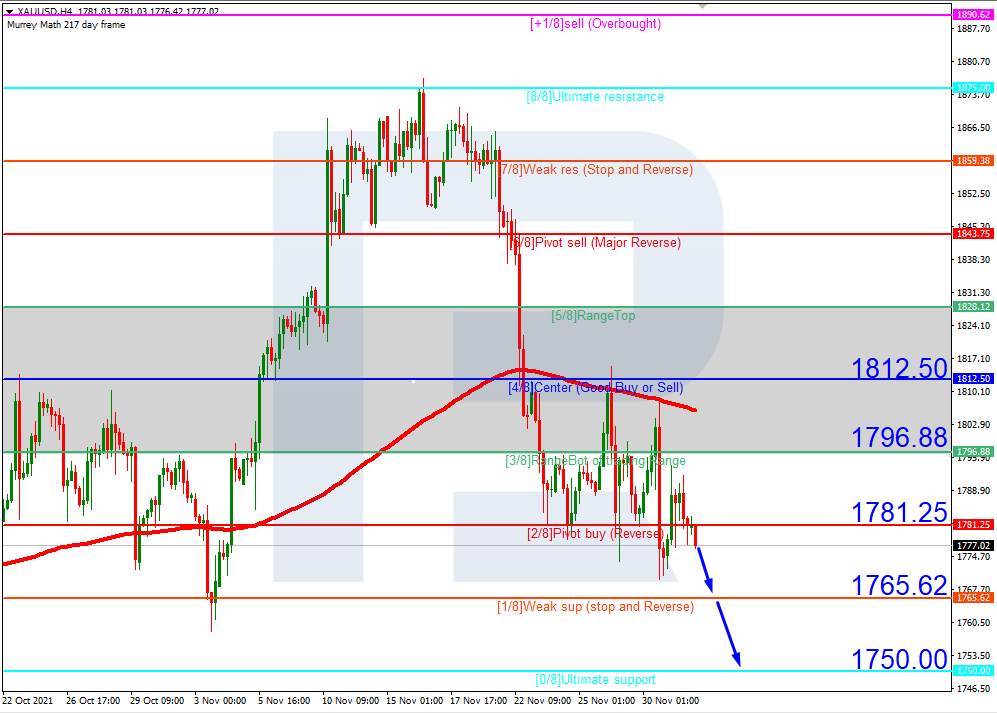
As we can see in the H4 chart, after breaking the 200-day Moving Average, XAUUSD is trading below it, thus indicating a possible descending tendency. In this case, the price is expected to test 1/8, break it, and then move downwards to reach the support at 0/8. However, this scenario may no longer be valid if the price breaks the resistance at 2/8 to the upside. After that, the instrument may continue growing towards the next resistance at 4/8.

XAUUSD_H4
Risk Warning: the result of previous trading operations do not guarantee the same results in the future

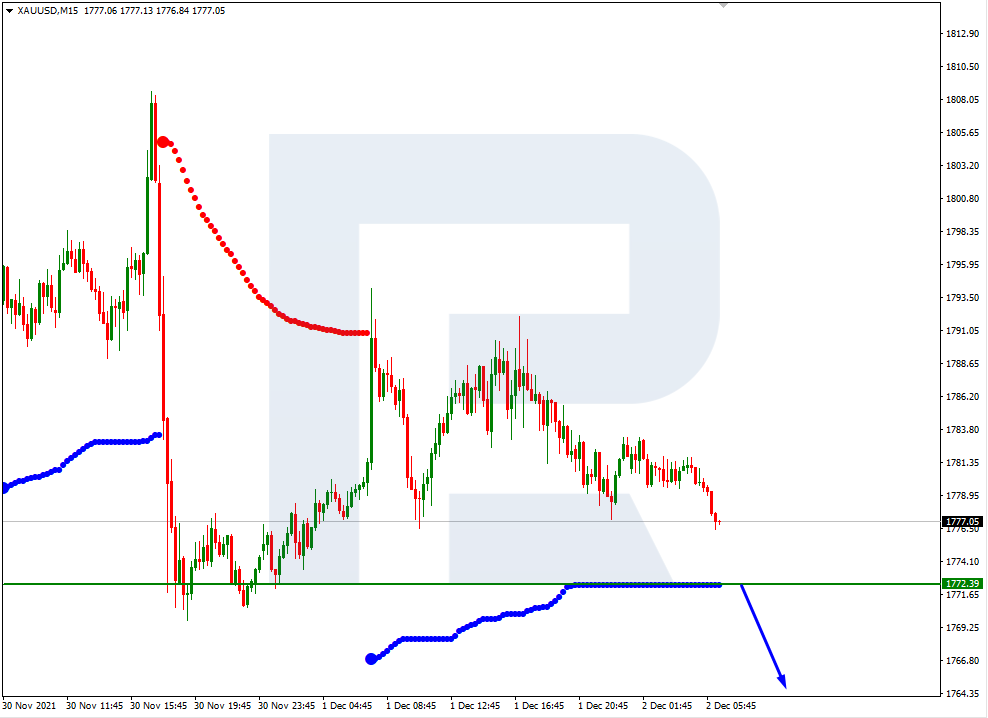
In the M15 chart, the pair may break the downside line of the VoltyChannel indicator and, as a result, continue its decline.

XAUUSD_M15

Article By RoboForex.com

Attention!
Forecasts presented in this section only reflect the author’s private opinion and should not be considered as guidance for trading. RoboForex LP bears no responsibility for trading results based on trading recommendations described in these analytical reviews.

The Analytical Overview of the Main Currency Pairs on 2021.12.02

by JustForex

The EUR/USD currency pair

Technical indicators of the currency pair:
  • Prev Open: 1.1335
  • Prev Close: 1.1318
  • % chg. over the last day: -0.15%

German retail sales fell by 0.3% in October while a 1% increase was expected. The ECB balance continues to rise despite growing inflation. Total assets increased by another €14.7 billion last week to a new level of €8,457 billion. The ECB balance now equals 81.2% of Eurozone GDP, against 37.4% of the Fed, 42% of the Bank of England, and 134.6% of the Bank of Japan.

Trading recommendations
  • Support levels: 1.1263, 1.1230, 1.1168
  • Resistance levels: 1.1371, 1.1436, 1.1535, 1.1613, 1.1667, 1.1717

From the technical point of view, the EUR/USD on the hour time frame is still bearish. The price is currently trading in a narrow corridor. The MACD indicator has become inactive. Under such market conditions, traders should consider sell positions from the priority change level of 1.1371. Buy trades should be considered only from the support levels of the higher time frame, given the buyers’ initiative, but only with short targets.

Alternative scenario: if the price breaks out through the 1.1371 resistance level and fixes above, the mid-term uptrend will likely resume.

EUR/USD
News feed for 2021.12.02:
  • – Eurozone Unemployment Rate (m/m) at 12:00 (GMT+2);
  • – US Initial Jobless Claims (w/w) at 15:30 (GMT+2);
  • – US Treasury Secretary Yellen Speaks at 16:00 (GMT+2).

The GBP/USD currency pair

Technical indicators of the currency pair:
  • Prev Open: 1.3293
  • Prev Close: 1.3272
  • % chg. over the last day: -0.16%

Home prices in the UK continue to grow, hitting a new record again as demand remains strong. According to Nationwide, the average UK home price increased by 0.9% last month after rising 0.7% in October. Home prices have risen nearly 15% since March 2020.

Trading recommendations
  • Support levels: 1.3232
  • Resistance levels: 1.3307, 1.3360, 1.3434, 1.3507, 1.3575, 1.3685, 1.3748

On the hourly time frame, the trend on GBP/USD is bearish. The MACD indicator has become negative but is still signaling divergence on several time frames. Under such market conditions, traders should consider sell positions from the resistance levels around the moving average. Buy trades should be considered on the support levels of higher time frames, given the buyers’ initiative.

Alternative scenario: if the price breaks out through the 1.3385 resistance level and consolidates above, the bullish scenario will likely resume.

GBP/USD
There is no news feed for today.

The USD/JPY currency pair

Technical indicators of the currency pair:
  • Prev Open: 113.13
  • Prev Close: 112.76
  • % chg. over the last day: -0.32%

Japan’s Ministry of Transportation is asking international airlines to stop booking all incoming flights to the country until 2022 because of the Omicron strain. The Japanese Yen is at seven-week highs as investors shift their assets into safe-haven currencies.

Trading recommendations
  • Support levels: 112.87, 112.30
  • Resistance levels: 113.79, 114.48, 115.15, 115.50

The global trend on the USD/JPY currency pair is bearish. At the moment the price is trading in the corridor with the 112.87-113.79 range. Under such market conditions, it is best for traders to look for sell positions from the resistance levels around the moving average or from the upper border of the corridor. Buy positions should be considered from the false breakdown zone, which was formed below when the price tried to move down.

Alternative scenario: if the price rises above 114.52, the uptrend will likely resume.

USD/JPY
There is no news feed for today.

The USD/CAD currency pair

Technical indicators of the currency pair:
  • Prev Open: 1.2779
  • Prev Close: 1.2820
  • % chg. over the last day: +0.32%

From a fundamental point of view, the dollar index is now inclined to rise as the Fed has started cutting the QE program and may accelerate the process at the next meeting. Analysts are confused about how the new Omicron coronavirus strain will affect oil supply and demand and what OPEC+ will do after many countries release their strategic reserves to the market.

Trading recommendations
  • Support levels: 1.2729, 1.2646, 1.2598, 1.2571, 1.2483, 1.2416, 1.2388
  • Resistance levels: 1.2828

From a technical point of view, the trend of the USD/CAD currency is bullish. The price is trading flat in the corridor with a range of 1.2729-1.2828. The MACD indicator has become positive. Under such market conditions, it is better to look for buy trades from the lower border of the flat corridor. Sell deals should be considered from the resistance levels of the higher time frames.

Alternative scenario: if the price breaks down through the 1.2646 support level and fixes below, the downtrend will likely resume.

USD/CAD
News feed for 2021.12.02:
  • – OPEC+ Meeting at 12:00 (GMT+2).

by JustForex


This article reflects a personal opinion and should not be interpreted as an investment advice, and/or offer, and/or a persistent request for carrying out financial transactions, and/or a guarantee, and/or a forecast of future events.

The US stock indices continue to fall amid Omicron uncertainty

by JustForex

The US stock indices are negative again as the first Omicron case in the US caused more uncertainty. Although the potential appearance of Omiсron in the United States was expected, the official announcement was enough to send the market into a decline, which had previously been quite positive. Overall, investor sentiment was dampened by new concerns over the Omicron coronavirus variant and statements by Jerome Powell that the Fed was ready to accelerate the process of reducing the stimulation program. It could mean interest rates hikes sooner than expected. The Dow Jones (US30) decreased by 1.34% by market close, the S&P 500 (US500) decreased by 1.18%, the Nasdaq (US100) lost 1.83%.

The volatility in the financial markets has been near the highest level since January. Analysts believe the volatility will persist through the end of December, driven by a tightening of central bank policy to fight inflation, while the Omicron variant threatens to prevent the recovery from the pandemic. Many questions about this strain remain unanswered.

WHO experts are increasingly convinced that the new Omicron strain is very “soft” and so far has not led to a dramatic increase in deaths anywhere, including in southern Africa.

Japan wants to stop all incoming international flights. Japan’s Ministry of Transportation is asking international airlines to stop booking all incoming flights into the country until 2022 because of the Omicron strain. The Japanese yen is at seven-week highs as investors shift their assets into safe-haven currencies. Airline stocks ended yesterday’s trading with a sharp drop. American Airlines (AAL) decreased by 8%, United Airlines Holdings Inc (UAL) lost 7.6%, and Delta Air Lines (DAL) lost 7.4%.

Amazon (AMZN) is investing in 274 renewable energy projects around the world.

European stock indexes ended yesterday’s trading with a solid gain despite rising inflation in the region as well as a rise in Covid-19 cases. French index CAC 40 (FR40) gained 2.4%, British FTSE 100 (UK100) jumped by 1.6%, German DAX (DE40) increased by 2.5%, Spanish IBEX (ES35) added 1.8%. The ECB representatives gave a clear understanding of the future monetary policy in the region. The ECB won’t reduce the PEPP program until the spring of 2022, so European stock indices will now be more resilient to shocks than US stock markets.

Turkey’s central bank intervened in the markets by selling foreign currency for the first time in seven years to stop the lira from falling against the US dollar. The intervention was due to “unhealthy pricing” in the market.

The US oil inventories fell by 909,000 barrels over the week. Oil prices increased slightly in today’s trading as investors adjust their positions ahead of the OPEC+ meeting, where the issue of production volumes will probably be considered. But analysts believe OPEC+ will decide to keep the current supply level and are confident that the growth of oil prices is limited. This is caused by concerns that the spread of the Omicron strain will negatively impact fuel demand since many countries have already closed flights.

The Central Bank of Ireland buys gold for the first time in years. The institution bought 2 tons of precious metal last month. The Irish central bank is adding to its gold reserves as inflation in the Eurozone far exceeds the European Central Bank’s target. Singapore increased its gold reserves by about 20% earlier this year. But that doesn’t mean that gold prices should rise at all. Gold has lost its status as a safe haven asset against inflation because it highly depends on US Treasury yields, which in turn depend on the Fed policy. When the QE program is cut, government bond yields rise, while making gold and silver prices fall.

Main market quotes:

S&P 500 (F) (US500) 4,513.04 −53.96 (−1.18%)

Dow Jones (US30) 34,022.04 −461.68 (−1.34%)

DAX (DE40) 15,472.67 +372.54 (+2.47%)

FTSE 100 (UK100) 7,168.68 +109.23 (+1.55%)

USD Index 96.08 +0.08 (+0.08%)

Important events for today:
  • – Australia Retail Sales (m/m) at 02:30 (GMT+2);
  • – OPEC+ Meeting at 12:00 (GMT+2);
  • – Eurozone Unemployment Rate (m/m) at 12:00 (GMT+2);
  • – US Initial Jobless Claims (w/w) at 15:30 (GMT+2);
  • – US Treasury Secretary Yellen Speaks at 16:00 (GMT+2);
  • – US Natural Gas Storage (w/w) at 17:30 (GMT+2).

by JustForex


This article reflects a personal opinion and should not be interpreted as an investment advice, and/or offer, and/or a persistent request for carrying out financial transactions, and/or a guarantee, and/or a forecast of future events.