
Article By RoboForex.com
USDCHF, “US Dollar vs Swiss Franc”
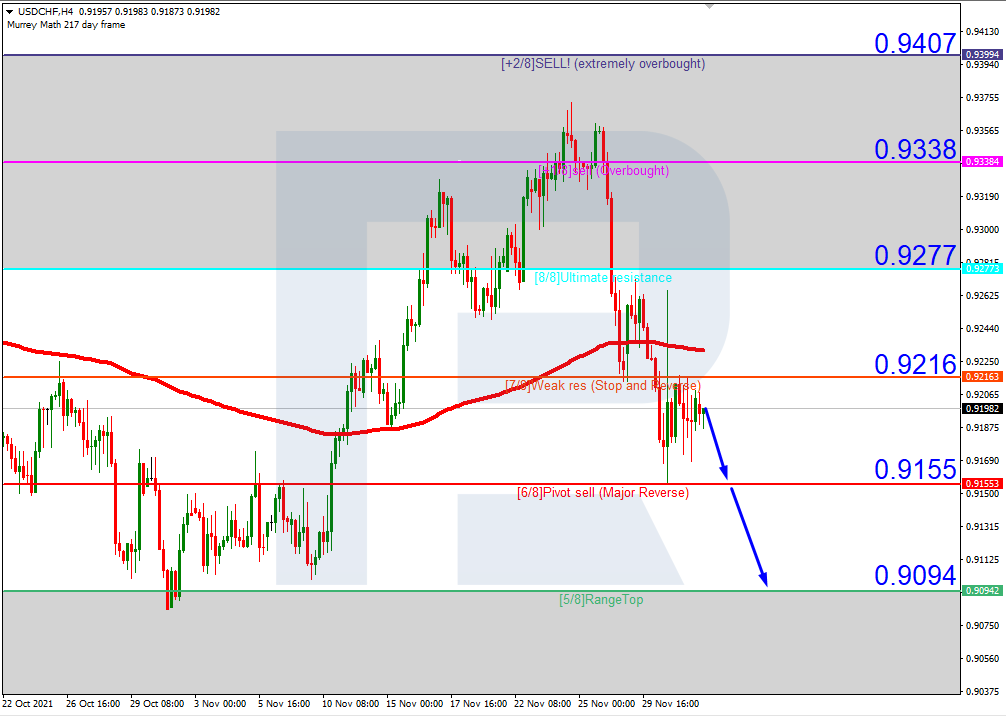
As we can see in the H4 chart, after breaking the 200-day Moving Average, USDCHF is trading below it, thus indicating a possible descending tendency. In this case, the price is expected to test 6/8, break it, and then continue falling to reach the support at 5/8. However, this scenario may be cancelled if the price breaks the resistance at 7/8 to the upside. After that, the instrument may grow towards the next resistance at 8/8.

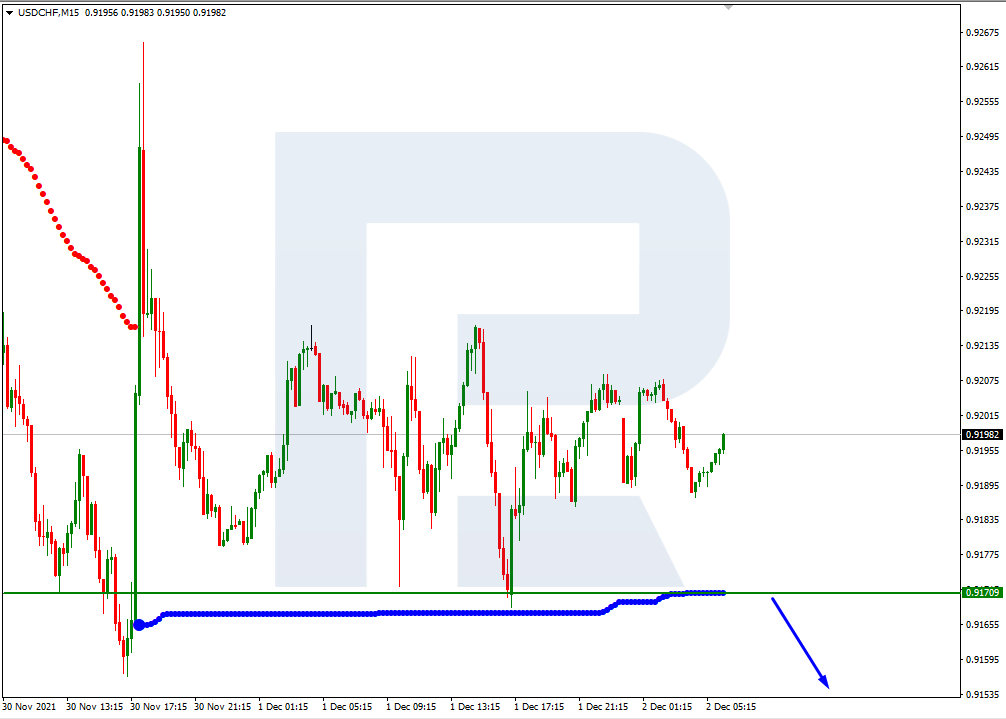
In the M15 chart, the pair may break the downside line of the VoltyChannel indicator and, as a result, continue trading downwards.
Free Reports:
 Get our Weekly Commitment of Traders Reports - See where the biggest traders (Hedge Funds and Commercial Hedgers) are positioned in the futures markets on a weekly basis.
 Sign Up for Our Stock Market Newsletter – Get updated on News, Charts & Rankings of Public Companies when you join our Stocks Newsletter
XAUUSD, “Gold vs US Dollar”
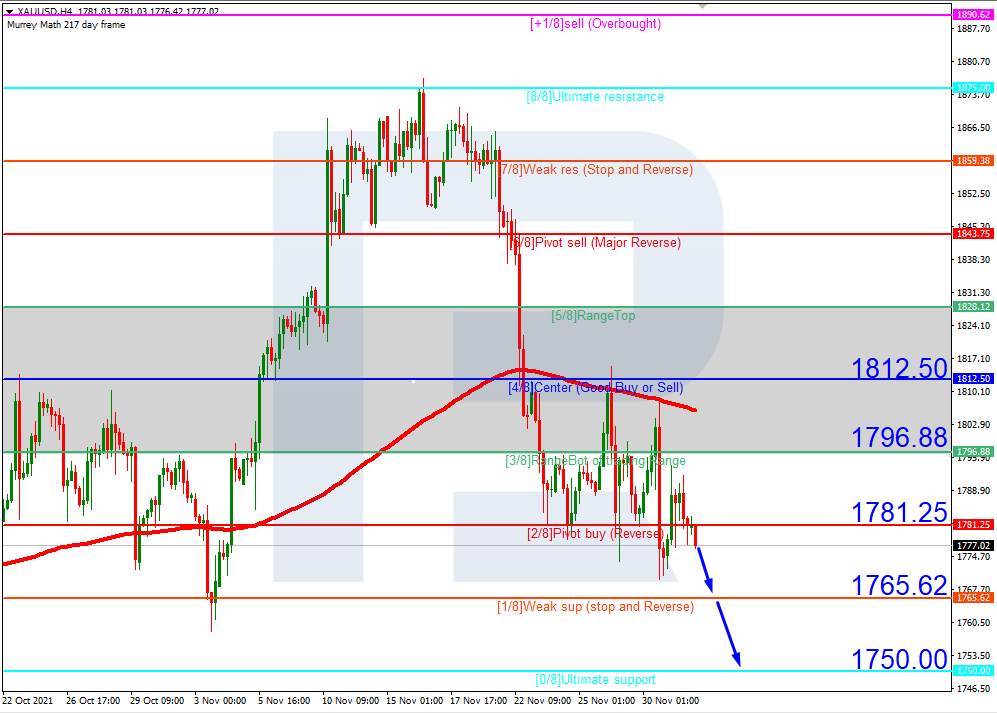
As we can see in the H4 chart, after breaking the 200-day Moving Average, XAUUSD is trading below it, thus indicating a possible descending tendency. In this case, the price is expected to test 1/8, break it, and then move downwards to reach the support at 0/8. However, this scenario may no longer be valid if the price breaks the resistance at 2/8 to the upside. After that, the instrument may continue growing towards the next resistance at 4/8.
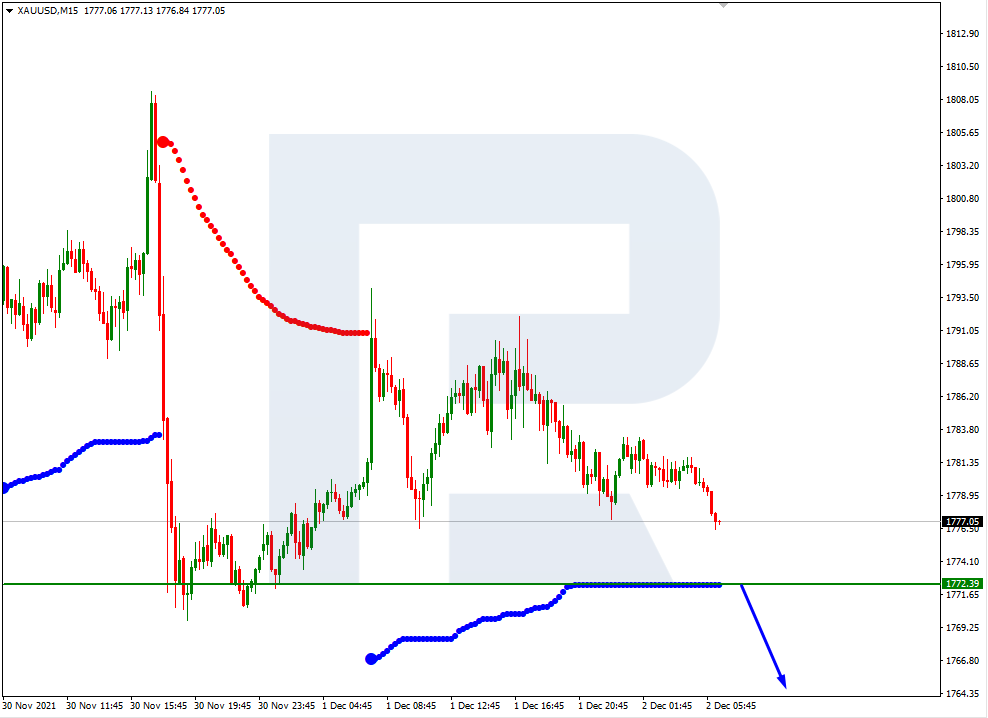
In the M15 chart, the pair may break the downside line of the VoltyChannel indicator and, as a result, continue its decline.
Article By RoboForex.com
Attention!
Forecasts presented in this section only reflect the author’s private opinion and should not be considered as guidance for trading. RoboForex LP bears no responsibility for trading results based on trading recommendations described in these analytical reviews.

- COT Metals Charts: Weekly Speculator Bets see small gains for Silver & Gold Jul 12, 2026
- COT Bonds Charts: Speculator Bets led by SOFR 3-Months & 2-Year Bonds Jul 12, 2026
- COT Energy Charts: Weekly Speculator Changes led by Brent Oil Jul 12, 2026
- COT Soft Commodities Charts: Weekly Speculator Changes led by Sugar, Corn & Soybeans Jul 12, 2026
- The US and European stock indices are rising again amid renewed investor interest in the AI industry. Jul 10, 2026
- USD/JPY Falls as Yen Recovers Weekly Losses Jul 10, 2026
- Crude oil prices surged sharply by 7% in reaction to the rapid escalation of the conflict in the Middle East Jul 9, 2026
- Middle East Tensions Weigh on Gold Jul 9, 2026
- Pound Awaits Tighter Policy from Bank of England Jul 8, 2026
- The United States carried out airstrikes on Iran after Iran’s attacked tankers in the Strait of Hormuz. The RBNZ raised the interest rate to 2.5% Jul 8, 2026