Mid-Week Technical Outlook: Yen Crosses Under The Spotlight

Lukman Otunuga

By Lukman Otunuga Senior Research Analyst, ForexTime

Market sentiment improved on Wednesday with global equities rebounding as easing concerns about the Omicron variant rekindled risk appetite. 

There was some action in the currency space amid the sense of positivity, resulting in dollar weakness against G10 majors. One currency that caught our attention was the Japanese Yen which held its ground despite investors turning to riskier assets. With the OPEC+ meeting around the corner and the US jobs report on Friday, it may be wise to keep a close eye on the Yen this week.

USDJPY: Wobbles above 112.80

The USDJPY looks to be balancing on shaky support around 112.80. After last Friday’s steep selloff, the currency pair has struggled to recover with bears firmly in the driving seat. 

Prices are trading below the 50-day Simple Moving Average but still above the 100-day while the MACD is in the process of crossing below zero. A strong daily close below 112.80 could encourage a decline towards 112.00 and potentially 111.50 – a level just above the 100-day Simple Moving Average. Should 112.80 prove to be reliable support, a rebound back above 113.30 and 114.00 could be on the cards. 


EURJPY: Challenges key support at 128.00

The last time the EURJPY secured a daily close below 128.00 was back in February 2021.

While this is major support has warded off bears on numerous occasions, the technicals remain in a favour of further downside. Prices are trading well below the 50, 100, and 200-day Simple Moving Average while the MACD trades below zero. A solid daily and weekly close below 128.00 could open the doors towards 127.40 and 126.00. Alternatively, a rebound from 128.00 may result in a sharp move towards 129.50.


GBPJPY: Approaches major support 

Just taking a glance at the GBPJPY, one can see the currency pair is under pressure on the daily charts.

Since hitting levels not seen in over 5 years back in October at 158.19, prices have been on a slippery decline, bringing bears back into the picture. The sharp decline last Friday has added fuel to the fire with prices approaching major support at 149.00. A strong breakdown below this level could open the doors towards 147.70 and 146.00, respectively. Should 149.00 prove to be solid support, a move towards 151.00 could be a possibility. 


AUDJPY: All eyes on 80.00

How prices behave around 80.00 will determine whether the AUDJPY tumbles lower or experiences a sharp rebound. Prices remain bearish on the daily charts with some pressure building close to the 80.00 support level. A strong break below this support could trigger a decline towards 78.80 and 78.00. If bulls can fend off the pressure and push prices back above 82.20, then expect a move back towards the 83.00 resistance and 84.50 level.


Disclaimer: The content in this article comprises personal opinions and should not be construed as containing personal and/or other investment advice and/or an offer of and/or solicitation for any transactions in financial instruments and/or a guarantee and/or prediction of future performance. ForexTime (FXTM), its affiliates, agents, directors, officers or employees do not guarantee the accuracy, validity, timeliness or completeness, of any information or data made available and assume no liability as to any loss arising from any investment based on the same.


Forex-Time-LogoArticle by ForexTime

ForexTime Ltd (FXTM) is an award winning international online forex broker regulated by CySEC 185/12 www.forextime.com

5 Interesting Energy Stocks added to our Watchlist this Quarter

The fourth quarter of 2021 is approximately two-thirds over and we wanted to highlight some of the Top Energy Companies that have been analyzed by our QuantStock system so far. Our QuantStock system is a proprietary algorithm that takes into account key company fundamentals, earnings trends and other strength components to find quality companies. We use it as a stock market ideas generator and to update our stock watchlist every quarter. The QuantStock system does not take into consideration the stock price or technical price trends so one must compare each company idea against the current stock prices. There are a plethora of professional studies that continue to show stock markets are overvalued and this is always a key component to consider when researching any stock market idea. As with all investment ideas, past performance does not guarantee future results.

Here we go with 5 of our Top Energy Stocks two-thirds of the way through Quarter 4 of 2021:

Suncor Energy

Energy Stock | Medium Cap | 5.42 percent dividend | 15.22 P/E | Our Grade = C+

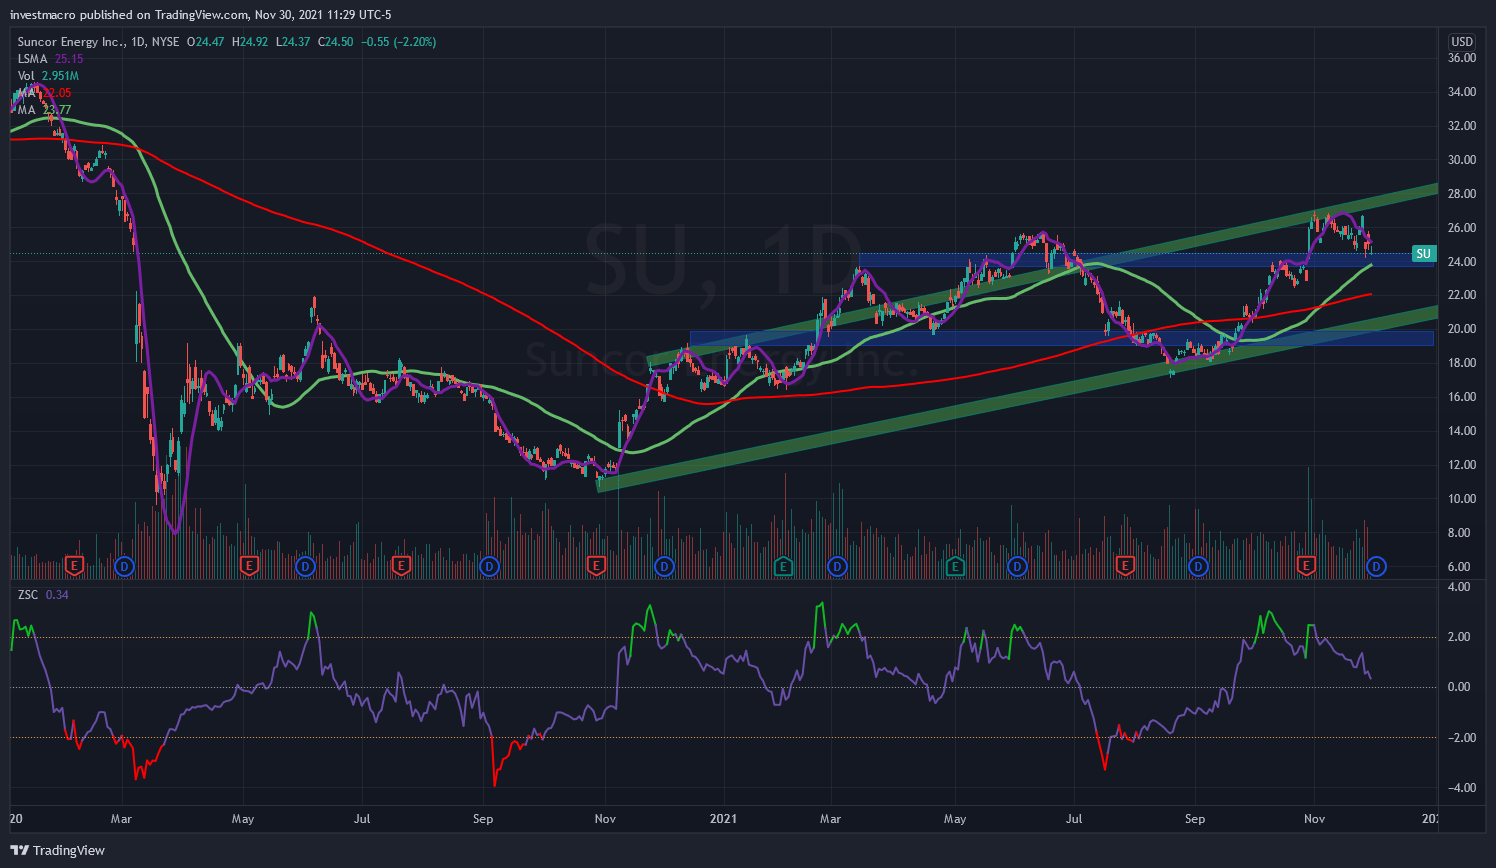
Suncor Energy Inc. (NYSE: SU) Energy Stock Chart

Suncor Energy Inc. (NYSE: SU) is one of Canada’s biggest energy stocks. It is an integrated energy company engaged in producing synthetic crude from oil sands. Suncor last announced its financial results for the third quarter on October 27. It came up with earnings of 56 cents per share and revenue of $8.11 billion for the three months ended September 30. The results showed significant improvement from the comparable quarter of 2020 but missed the consensus forecast of 58 cents per share for profit and $8.5 billion for revenue. Despite missing expectations, Suncor Energy stock climbed to a new high of $26.97 earlier this month.


Matador Resources Co.

Energy Stock | Small Cap | 0.51 percent dividend | 16.78 P/E | Our Grade = C-

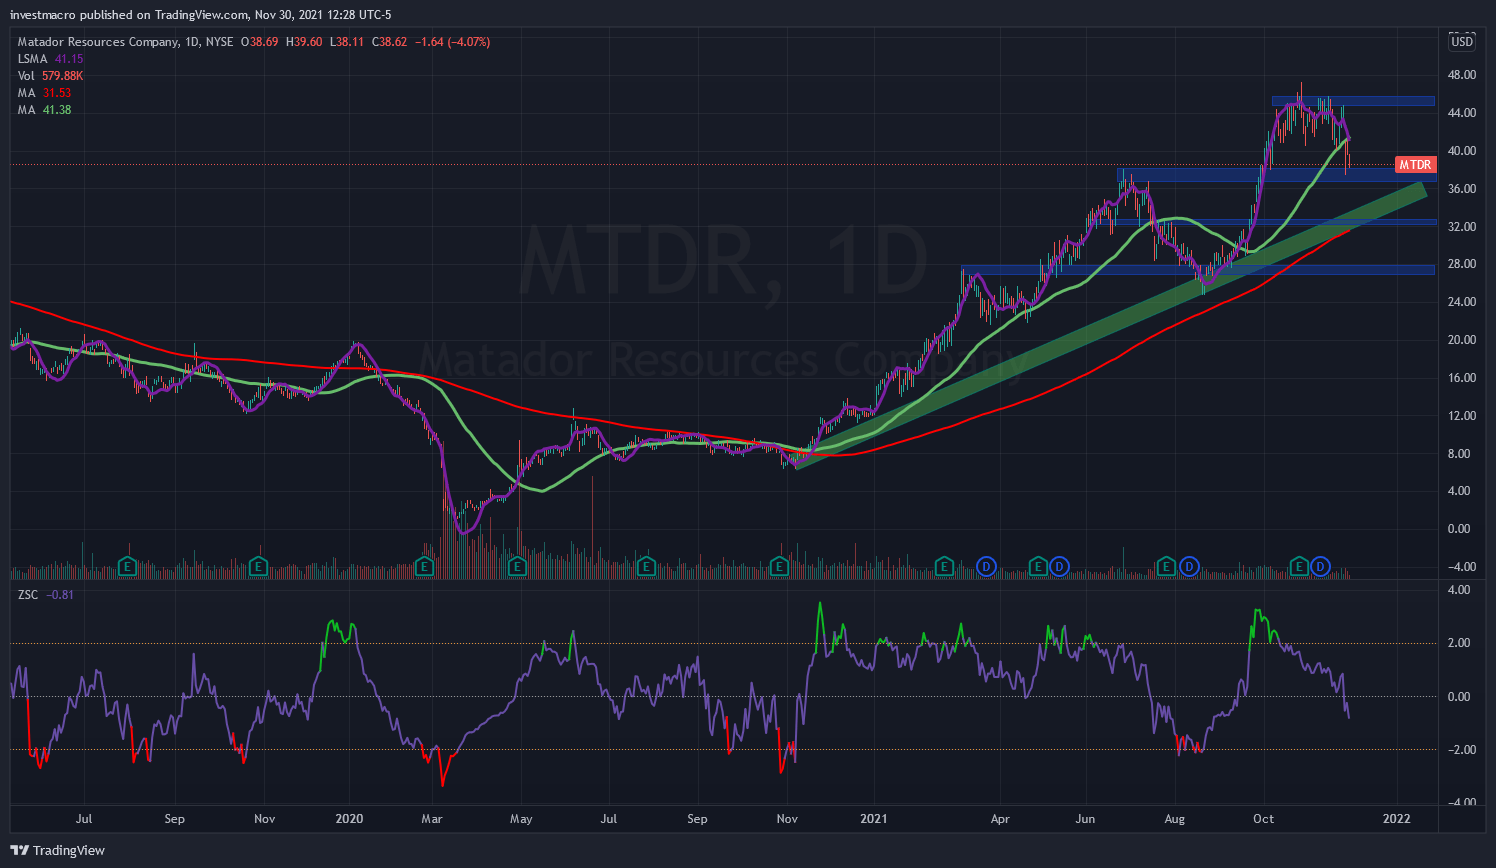
Matador Resources Co. (NYSE: MTDR) Energy Stock Chart

Matador Resources Co. (NYSE: MTDR) is an energy company based in Texas, United States. The company last month announced impressive financial results for the third quarter. Matador earned $1.25 per share during the three months ended September 30, beating the consensus forecast of 96 cents per share. Moreover, it generated revenue of $472.351 million during the quarter, ahead of analysts’ average estimate of $387.950 million. In addition, Matador stock has also performed exceptionally well so far in 2021. The company’s share price has skyrocketed more than 200 percent on a year-to-date basis. The 52-week range of the stock is $10.16 – $47.23, while its total market value stands close to $4.5 billion.


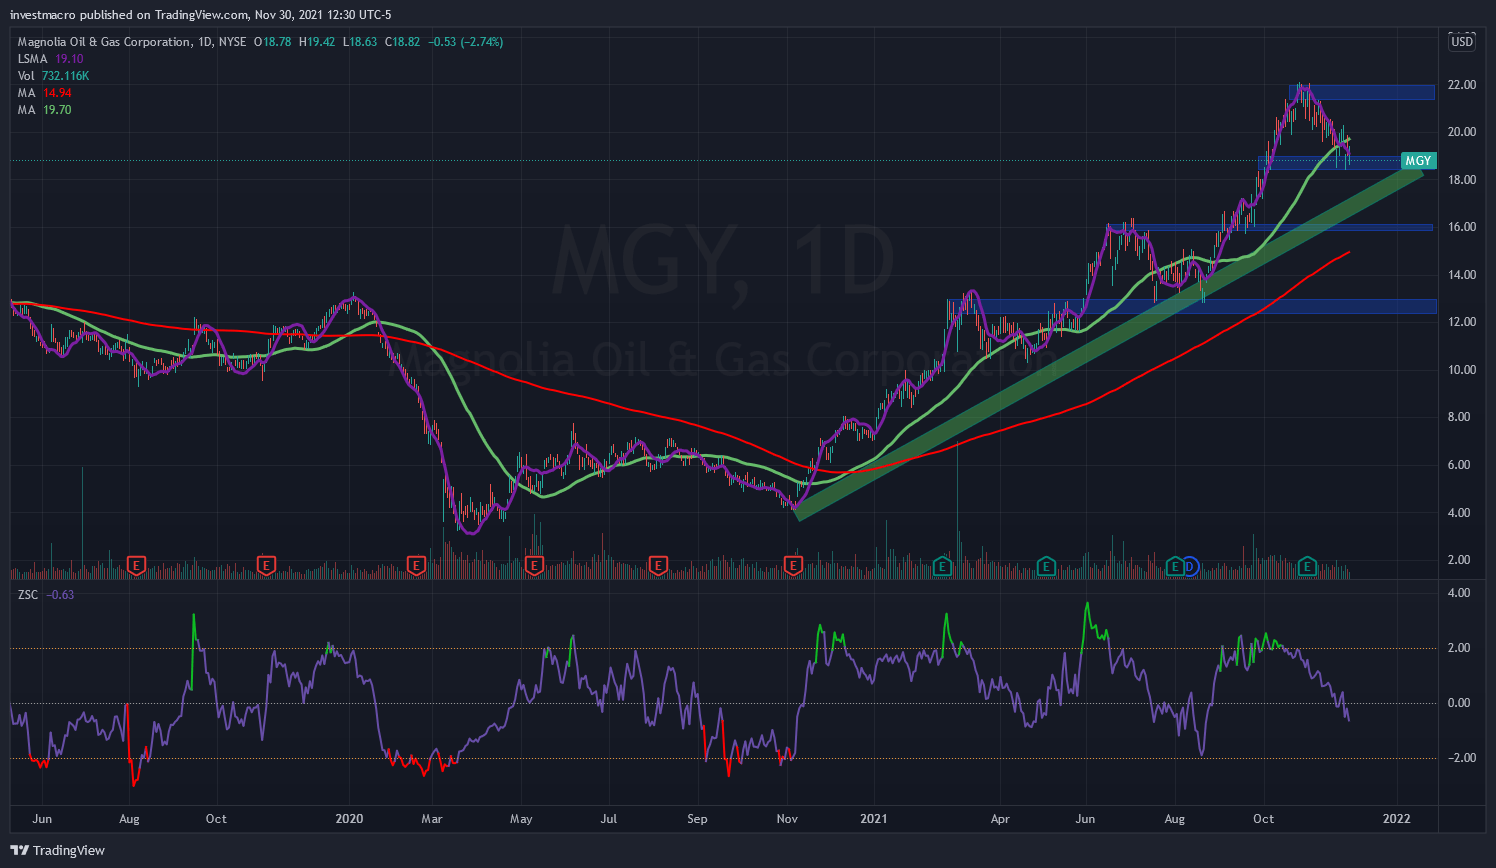
Magnolia Oil & Gas Corp.

Energy Stock | Small Cap | 0.84 percent dividend | 11.29 P/E | Our Grade = C-

Magnolia Oil & Gas Corp. (NYSE: MGY) Energy Stock Chart

Magnolia Oil & Gas Corp. (NYSE: MGY) is another Texas-based oil producer. The company posted solid financial results for the third quarter earlier this month. Magnolia reported adjusted earnings of 67 cents per share on revenue of $283.58 million. The results easily surpassed analysts’ average estimate of 61 cents per share for earnings and $274 million for revenue. If we quickly look at its key financial metrics, Magnolia stock is currently trading around $18.82, against its 52-week range of $18.38 – $19.07. Moreover, the company’s market value is just over $3.4 billion, while its P/E ratio stands at 11.03.


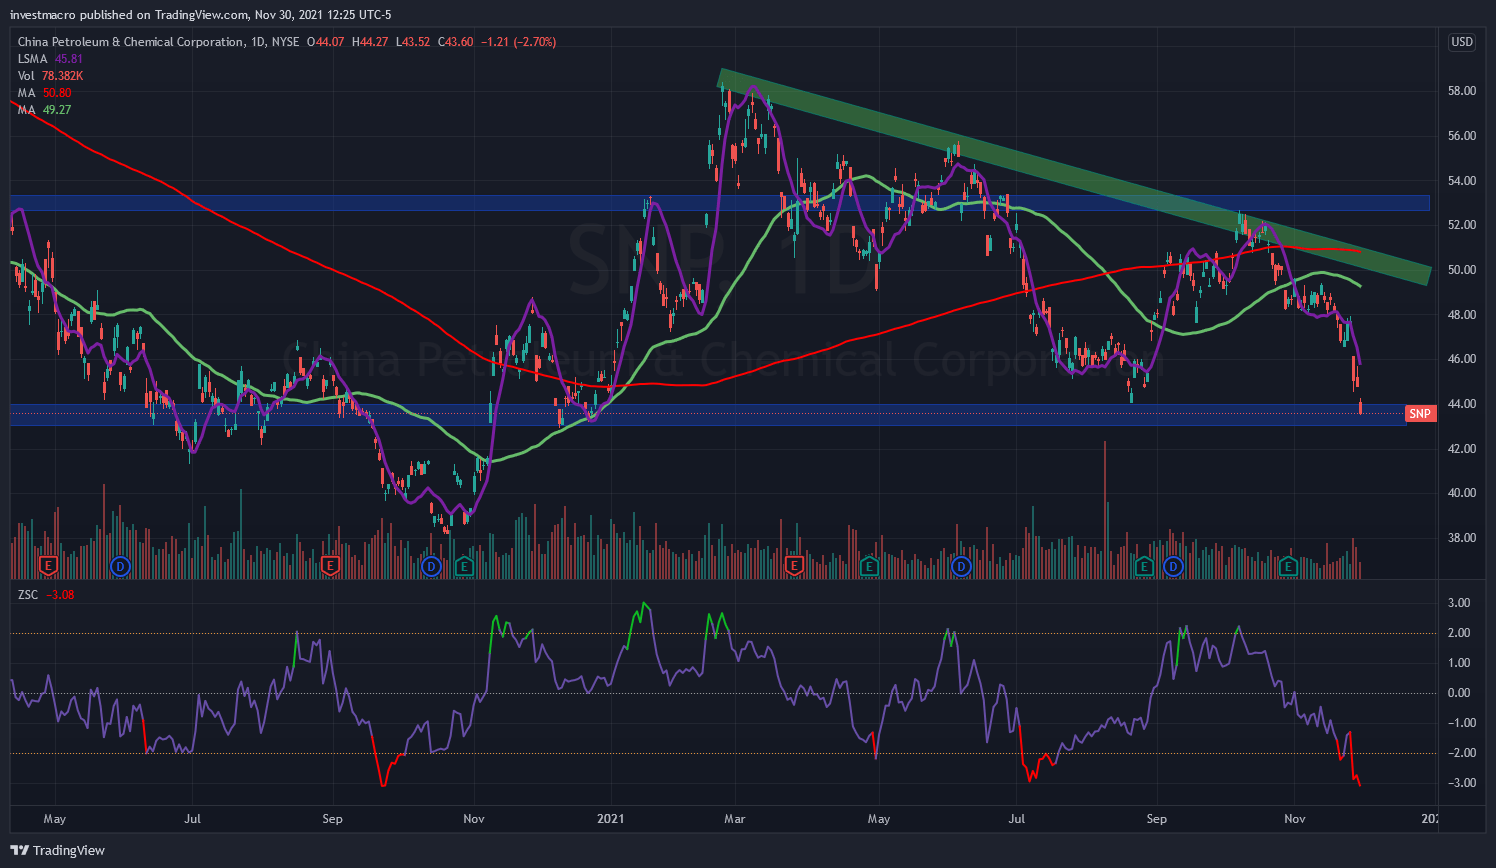
China Petroleum & Chemical Corp.

Energy Stock | Medium Cap | 10.26 percent dividend | 3.71 P/E | Our Grade = C

China Petroleum & Chemical Corporation (NYSE: SNP) Energy Stock Chart

China Petroleum & Chemical Corporation (NYSE: SNP), commonly known as Sinopec, is a leading oil and gas company based in China. Besides its listing in the New York Stock Exchange, it also trades in Hong Kong and Shanghai. Sinopec last month announced mixed results for the third quarter. Its reported earnings of $2.64 per share, representing a sharp decline from $5.54 per share in the comparable period of 2020. On the positive side, its revenue for the third quarter grew over 52 percent to $114.58 million. If we look at its share price, Sinopec stock has struggled to gain value so far in 2021. The stock has only increased nearly one percent on a year-to-date basis.


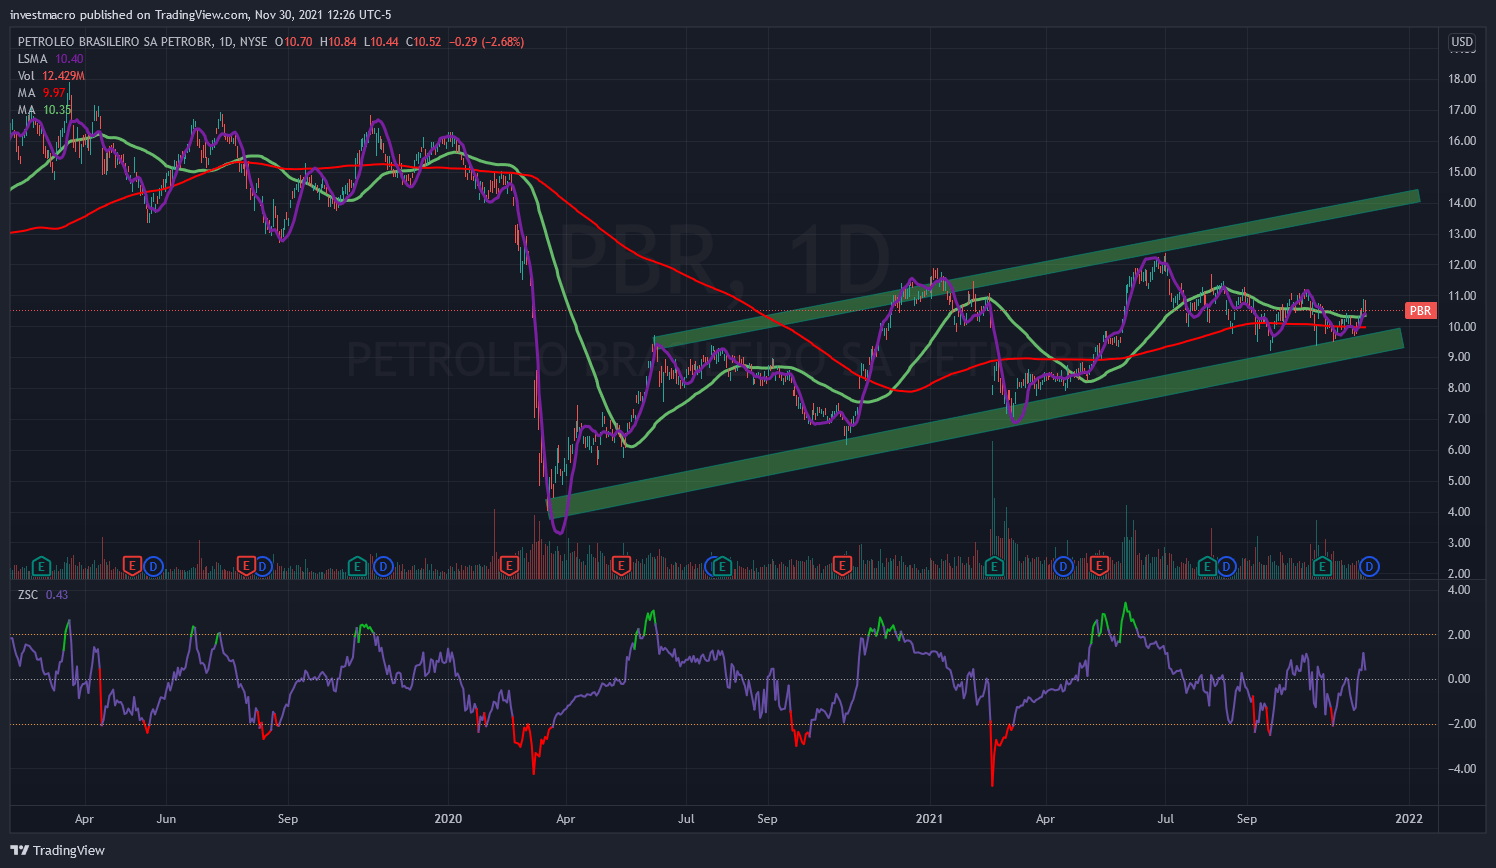
Petróleo Brasileiro S.A.

Energy Stock | Medium Cap | 19.49 percent dividend | 2.71 P/E | Our Grade = C

Petróleo Brasileiro S.A. (NYSE: PBR) Energy Stock Chart

Petróleo Brasileiro S.A. (NYSE: PBR) is one of the leading energy stocks based in Rio de Janeiro, Brazil. The company, also called Petrobras, is engaged in the exploration and production of oil and natural gas. Petrobras last released its quarterly financial results on October 28. The company reported earnings of $5.9 billion for the third quarter, down 26.9 percent from Q2 but significantly higher than the comparable period of 2020. In addition, its quarterly revenue of $23.3 billion was also well above $13.15 billion in the year-ago period. If we talk about its share price movement, Petrobras stock hasn’t performed well this year. The stock is still down nearly six percent on a year-to-date basis.


Article by InvestMacro – Be sure to join our stock market newsletter to get our updates and to see more top companies we add to our stock watch list.


Fibonacci Retracements Analysis 01.12.2021 (GBPUSD, EURJPY)

Article By RoboForex.com

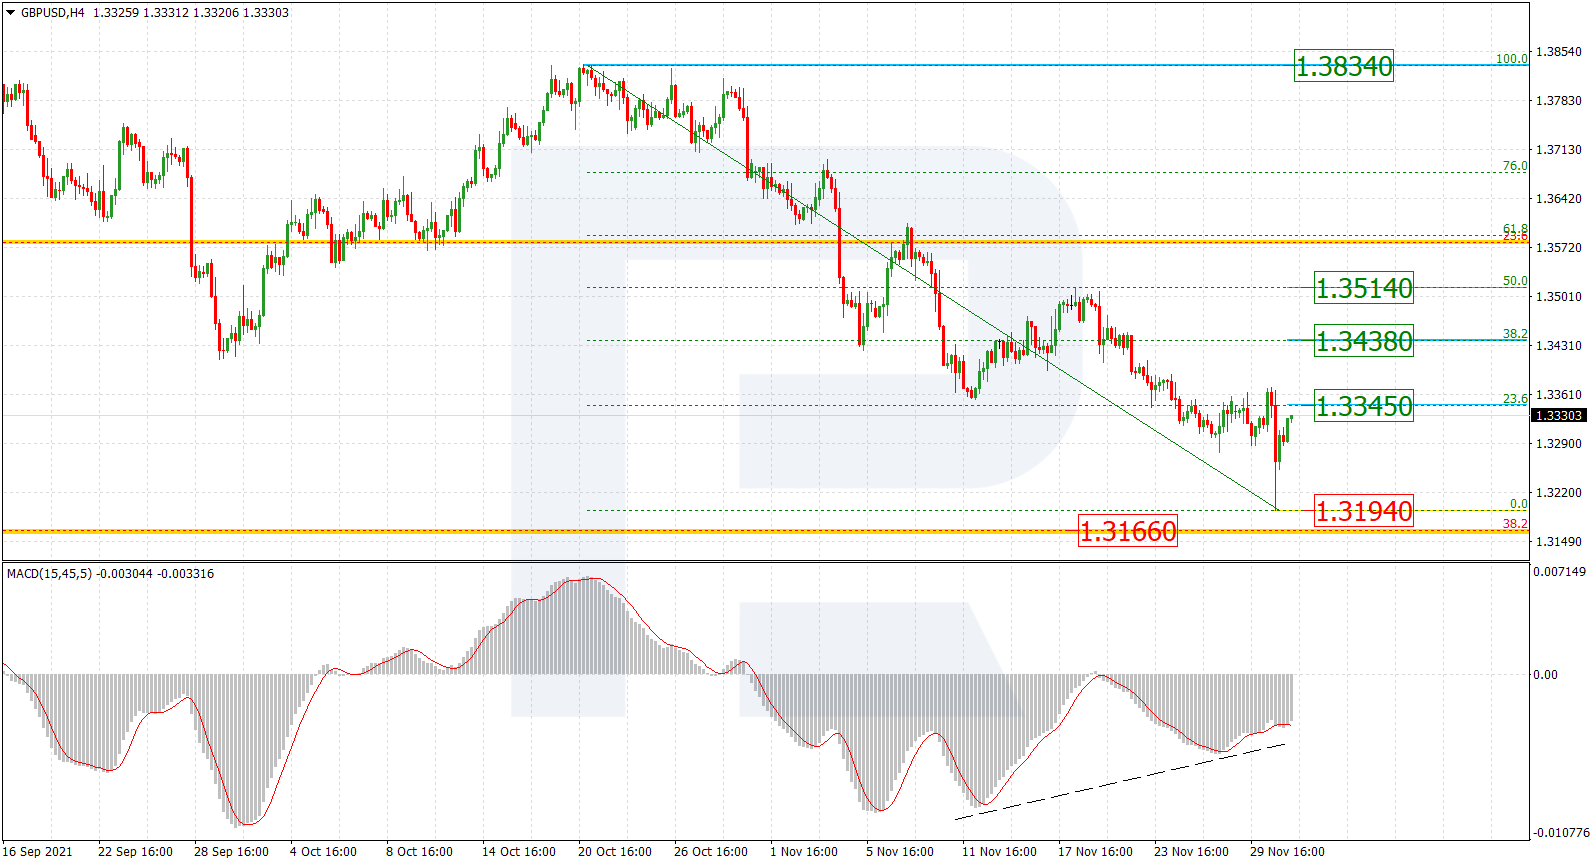
GBPUSD, “Great Britain Pound vs US Dollar”

As we can see in the H4 chart, after failing to test the long-term 38.2% fibo at 1.3166, the asset is forming a new pullback to the upside. However, it doesn’t mean that the descending tendency is over. Convergence on MACD is another signal in favour of the ascending correction. A breakout of the local low at 1.3194 will lead to a further downtrend towards the long-term target. The key resistance is at 1.3834.

GBPUSD_H4
Risk Warning: the result of previous trading operations do not guarantee the same results in the future

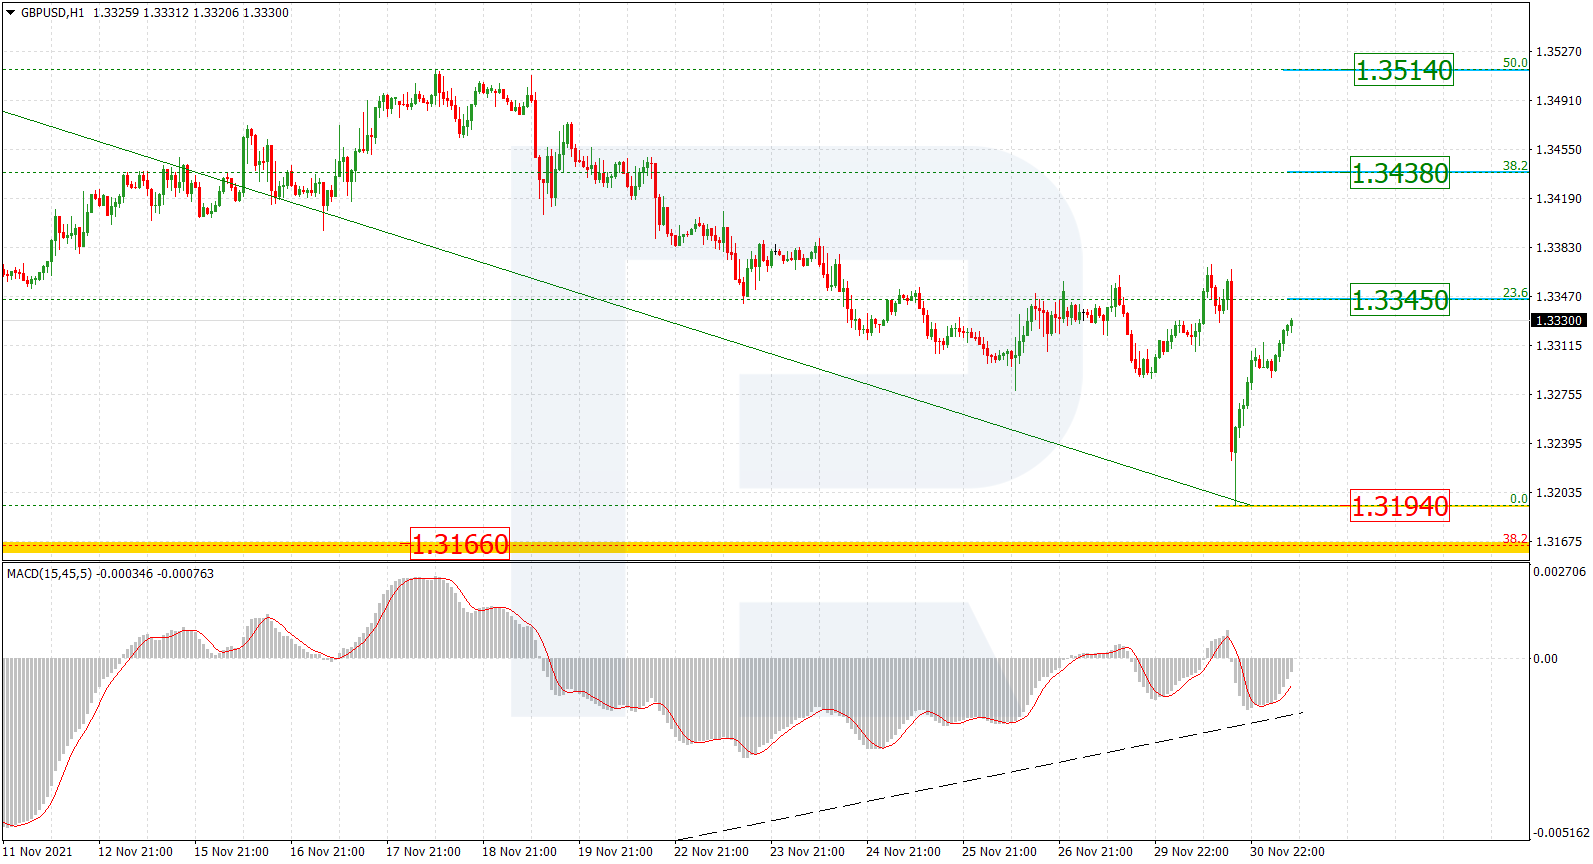
The H1 chart shows a more detailed structure of the current growth towards 23.6% fibo at 1.3345. After a slight pullback, the correctional uptrend may continue to reach 38.2% and 50.0% fibo at 1.3438 and 1.3514 respectively.

GBPUSD_H1
Risk Warning: the result of previous trading operations do not guarantee the same results in the future

EURJPY, “Euro vs. Japanese Yen”

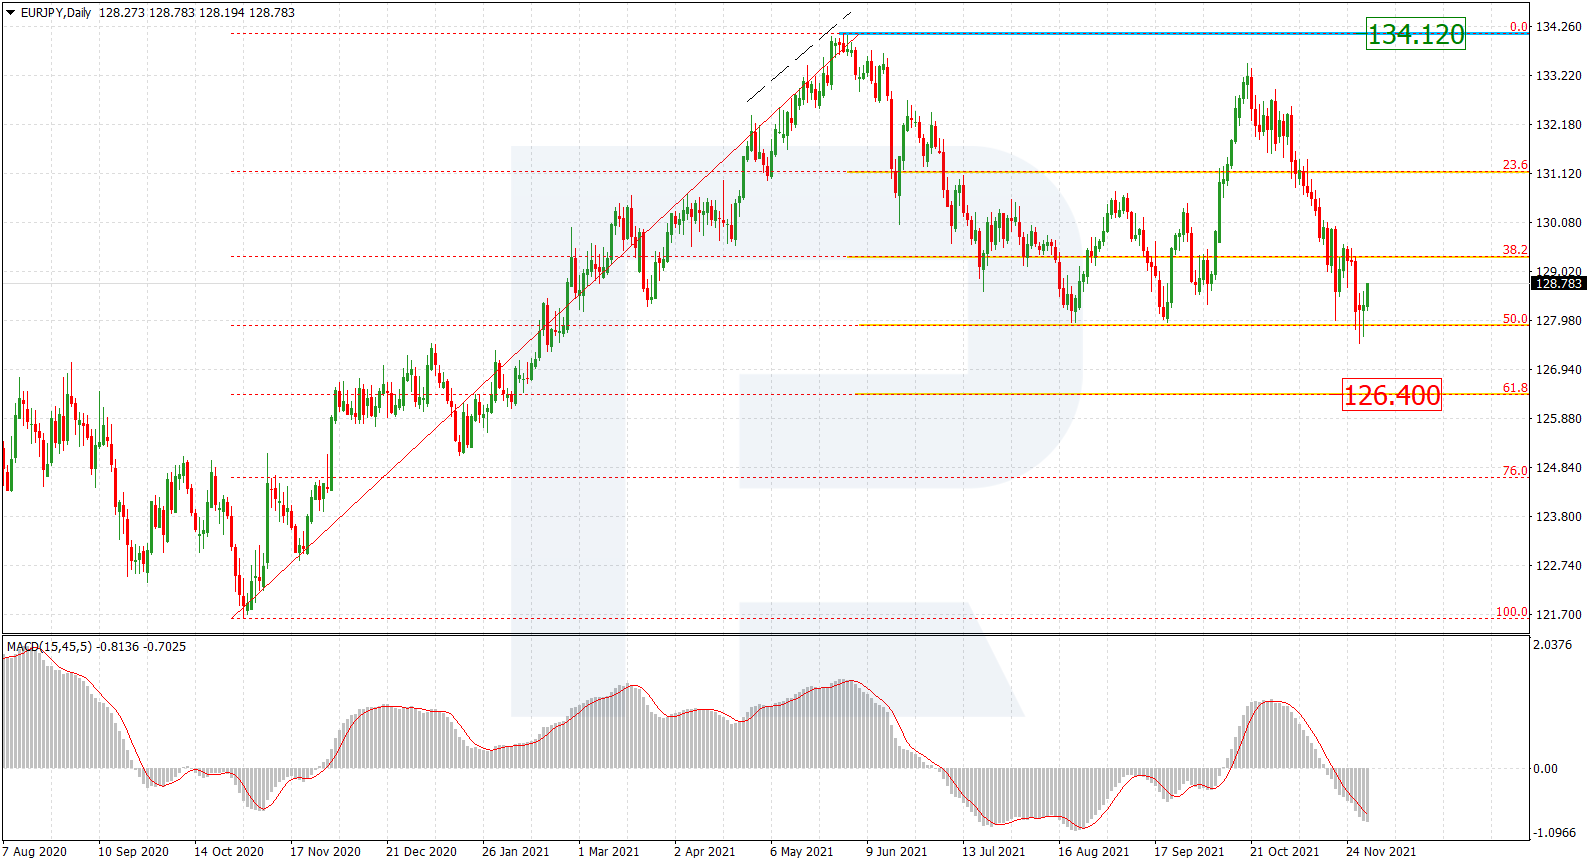
The daily chart shows that after falling and reaching 50.0% fibo, EURJPY is correcting upwards. After the pullback is over, the asset may continue falling towards 61.8% fibo at 126.40. Later, the market may start a new uptrend to reach the high at 134.12.

EURJPY_D1
Risk Warning: the result of previous trading operations do not guarantee the same results in the future

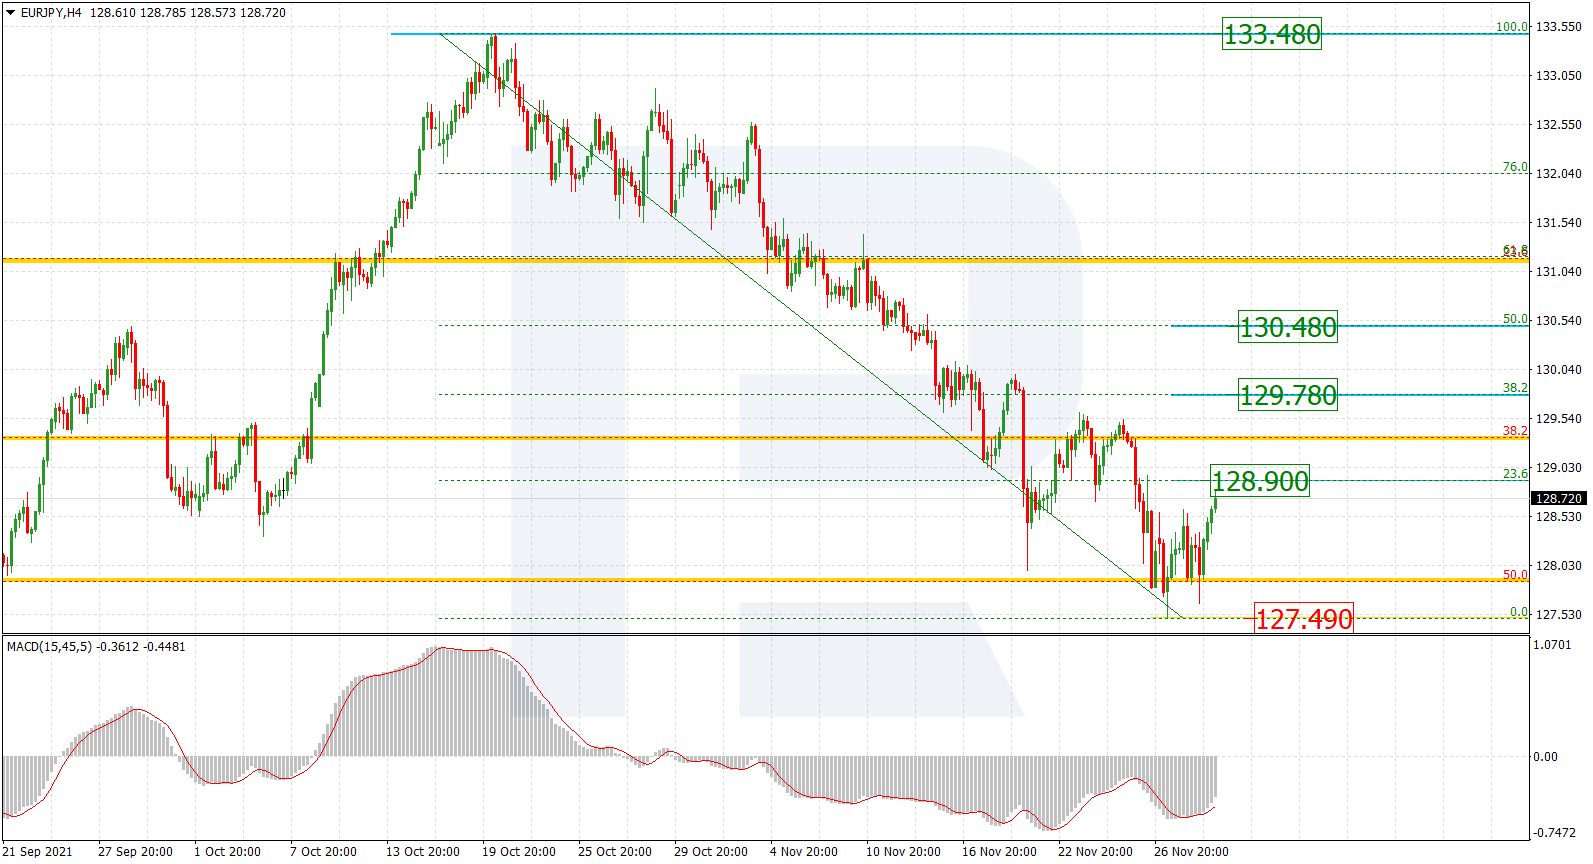
As we can see in the H4 chart, after testing and breaking the mid-term 50.0% fibo, EURJPY is correcting upwards; right now, it is approaching 23.6% fibo at 128.90 and may later continue towards 38.2% and 50.0% fibo at 129.78 and 130.48 respectively. The support is the low at 127.49.

EURJPY_H4

Article By RoboForex.com

Attention!
Forecasts presented in this section only reflect the author’s private opinion and should not be considered as guidance for trading. RoboForex LP bears no responsibility for trading results based on trading recommendations described in these analytical reviews.

Will Japan’s November Consumer Confidence Move The Yen?

By Orbex

It’s common knowledge that the chronic problem the BOJ has had to deal with is low inflation. But, inflation is unlikely to pick up if consumers are unwilling to spend.

So, keeping an eye on consumer sentiment can give us some advance warning about where inflation trends are going, and whether the BOJ will ever be able to look towards normalizing policy.

In general, and particularly recently, the yen has been driven primarily by safe haven flows. The move in the yen last Friday was the latest evidence. If, however, consumers are feeling a little better about spending, it could provide some more weight to fundamentals.

Japan imports a significant amount of its consumer goods. If consumers start buying, it could weaken the yen, even as traders look for a safe haven. Or it could accelerate the rise in the USDJPY if investors finally get over their covid jitters.

But how good are the numbers, really?

Last month, consumer confidence in Japan moved above pre-pandemic levels for the first time. This came on the heels of the removal of covid restrictions across the country.

Naturally, the expectation was for consumers to go back to spending this month. The thing is, though, consumer confidence had been falling for well over a year even before the pandemic.

Therefore, returning to pre-pandemic levels is evidently a good sign. Nonetheless, it doesn’t mean that the Japanese economy has returned to full health. Of course, the pandemic might have changed the dynamic of the economy. And now consumer confidence could continue to move higher.

The underlying issues haven’t changed

The thing that drove down consumer confidence before the pandemic is arguably the hike in sales taxes as part of Abenomics. The new PM has vowed to double down on the outlook, and raise taxes again after the pandemic.

So, even though there is some initial optimism among shoppers now, it might not continue for long. Additionally, it takes some time for increased consumer demand to translate into inflation.

What drives the yen, though, are bond yields, which are tied to inflation expectations. Even if consumer confidence improves, if investors aren’t convinced that inflation will tick up in the near future, bonds are likely to remain under pressure. In turn, this means that there will be a little carryover to the yen in the short term.

However, a blowout number could convince investors that at least in the short term it might be prudent to expect a weaker yen. If consumer sentiment disappoints, then it would likely confirm the status quo, with people waiting on risk appetite to drive the yen.

What to look out for

Analysts anticipate that Japan’s November Consumer Confidence will move up again to 40.0 from 39.2 prior. For comparison, the series was around 39.5 ahead of the pandemic.

And if the data meets expectations, it would be the best result since early 2019. However, it’s quite a bit lower than just under 45, which was the norm before the latest round of sales tax hikes.

Even when consumer confidence was 5 points higher than it was now, inflation was still a problem for the BOJ. So, for now, it’s unlikely that consumers will be putting enough pressure on the currency to move the needle much.


Orbex-LogoArticle by Orbex

Orbex is a fully licensed broker that was established in 2011. Founded with a mission to serve its traders responsibly and provides traders with access to the world’s largest and most liquid financial markets. www.orbex.com

Bitcoin is a better inflation hedge than gold: deVere CEO

By George Prior

The Bitcoin rally stalled on heightening global worries about inflation, but, says the CEO of one of the world’s leading financial advisory, asset management and fintech firms, it remains “a better shield than gold.”

The largest cryptocurrency by market capitalization ended three consecutive days of healthy gains, before stabilizing, after U.S. Federal Reserve Chair Jerome Powell said on Tuesday it may be time to stop using the term “transitory” as a way of describing the current wave of inflation.

Meanwhile, inflation in Europe has ballooned to the highest on record.

Mr Green says: “Bitcoin is perceived by many investors as a hedge against inflation due largely to its strict supply controls.

“As such, it would be assumed that its price would automatically rise when the U.S. central bank suggests that it would consider speeding up the reduction of its asset purchase policies that have boosted the stock markets.

“But for other investors, including some major institutional investors who have piled into Bitcoin in recent months, the cryptocurrency is still perceived as a risky asset.

“So when they sell-off riskier assets, despite the longer-term outlook and based on short-term hawkish policies from the world’s de facto central bank, Bitcoin, like equities, also becomes vulnerable.”

A long-term, high-profile crypto advocate, Mr Green remains confident that “Bitcoin is today a greater inflation shield than gold”, which has long been the standard go-to inflation hedge.

He says: “Gold has always been regarded as the ultimate inflation hedge – but the world is a much different place now. Our lives and the global economy is increasingly run on tech and digital solutions and this megatrend is only set to become more dominant.

“Gold is likely to be dethroned within a generation as millennials and younger investors, who are so-called ‘digital natives’, are going to be more comfortable with Bitcoin as a hedge than a physical metal.”

The deVere CEO goes on to say: “Bitcoin is often referred to as ‘digital gold’ because like the precious metal it is a medium of exchange, a unit of account, non-sovereign, decentralized, scarce, and a store of value.

“Yet, the cryptocurrency, Bitcoin is superior to gold as a medium of exchange or form of payment.

“Unlike gold, it is a fixed unit of account and easily divisible and transportable. Gold is not easily immediately divisible, and there are potential issues with purity and verification. Whereas Bitcoin is easily traced on blockchain technology and this is going to be a considerable advantage, especially in cross-border transactions.”

Mr Green concludes: “Gold and Bitcoin can, and perhaps should, complement each other in a portfolio.

“But as the world continues to pick up momentum in its shift towards tech, and as millennials become a more dominant part of the world economy, we should expect Bitcoin to also take an increasingly influential role in financial markets, including in regards to being an inflation hedge.”

About:

deVere Group is one of the world’s largest independent advisors of specialist global financial solutions to international, local mass affluent, and high-net-worth clients.  It has a network of more than 70 offices across the world, over 80,000 clients and $12bn under advisement.


Murrey Math Lines 01.12.2021 (USDJPY, USDCAD)

Article By RoboForex.com

USDJPY, “US Dollar vs. Japanese Yen”

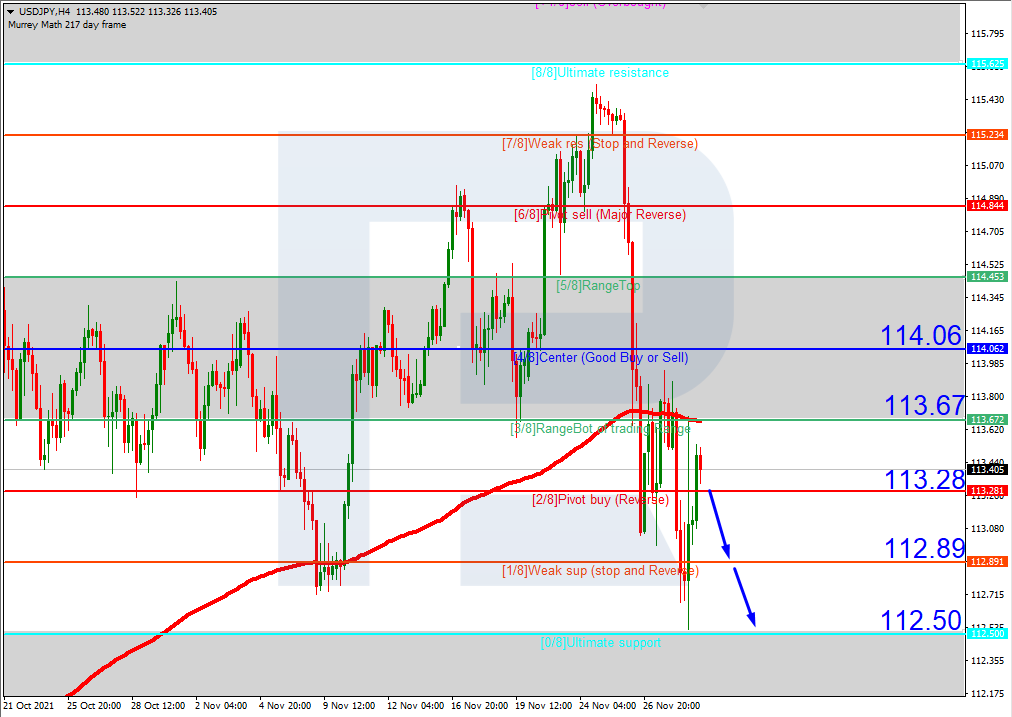
In the H4 chart, after breaking the 200-day Moving Average, USDJPY is trading below it, thus indicating a descending tendency. In this case, the price is expected to test 2/8, break it, and continue falling to reach the support at 0/8. However, this scenario may no longer be valid if the price breaks 3/8 to the upside. After that, the instrument may reverse and grow towards the resistance at 5/8.

USDJPYH4
Risk Warning: the result of previous trading operations do not guarantee the same results in the future

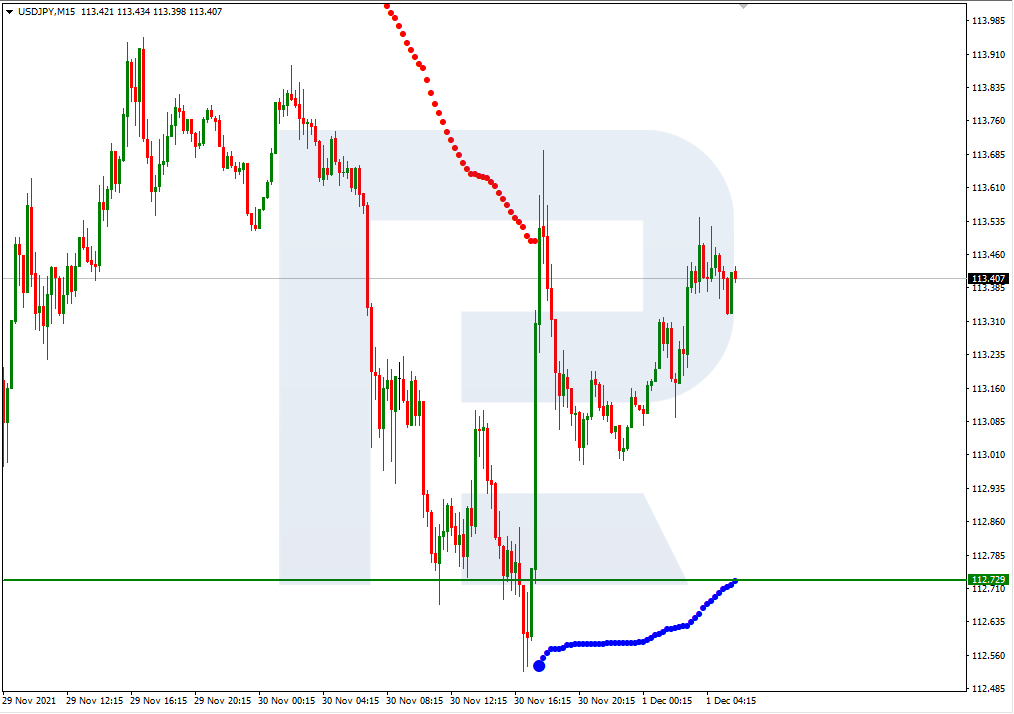
As we can see in the M15 chart, the downside line of the VoltyChannel indicator is pretty far away from the price, that’s why the pair may resume trading downwards only after breaking 2/8 in the H4 chart.

USDJPY_M15
Risk Warning: the result of previous trading operations do not guarantee the same results in the future

USDCAD, “US Dollar vs Canadian Dollar”

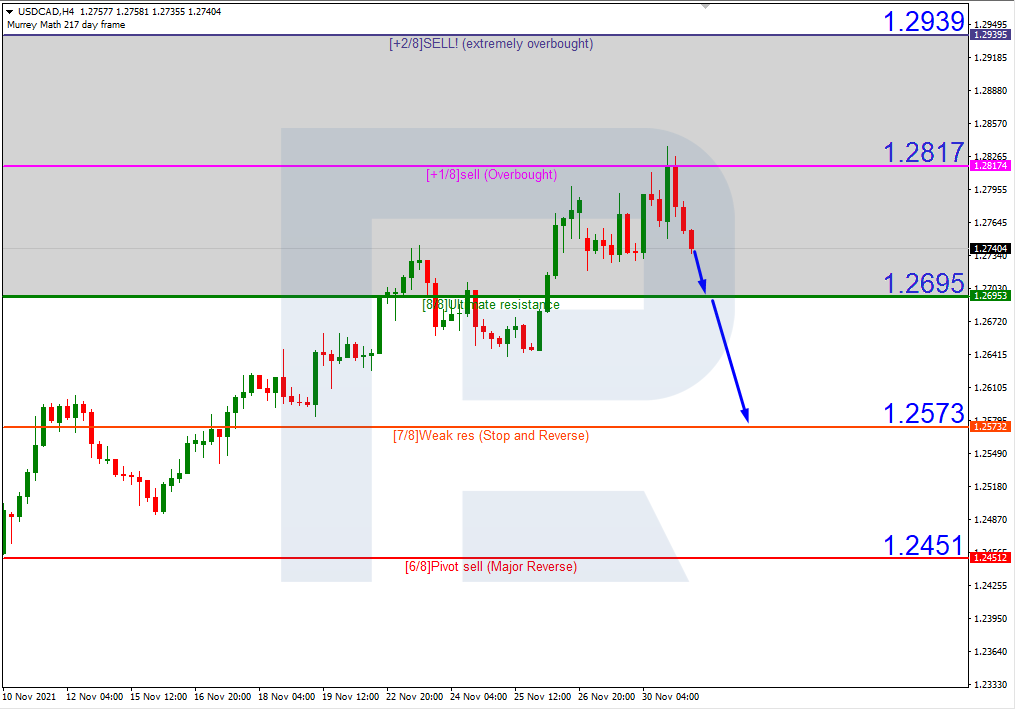
As we can see in the H4 chart, USDCAD is trading within the “overbought area”. In this case, the price is expected to test the support at 8/8, break it, and then continue falling towards 7/8. Still, this scenario may no longer be valid if the price breaks the resistance at +1/8 to the upside. After that, the instrument may grow to reach +2/8.

USDCAD_H4
Risk Warning: the result of previous trading operations do not guarantee the same results in the future

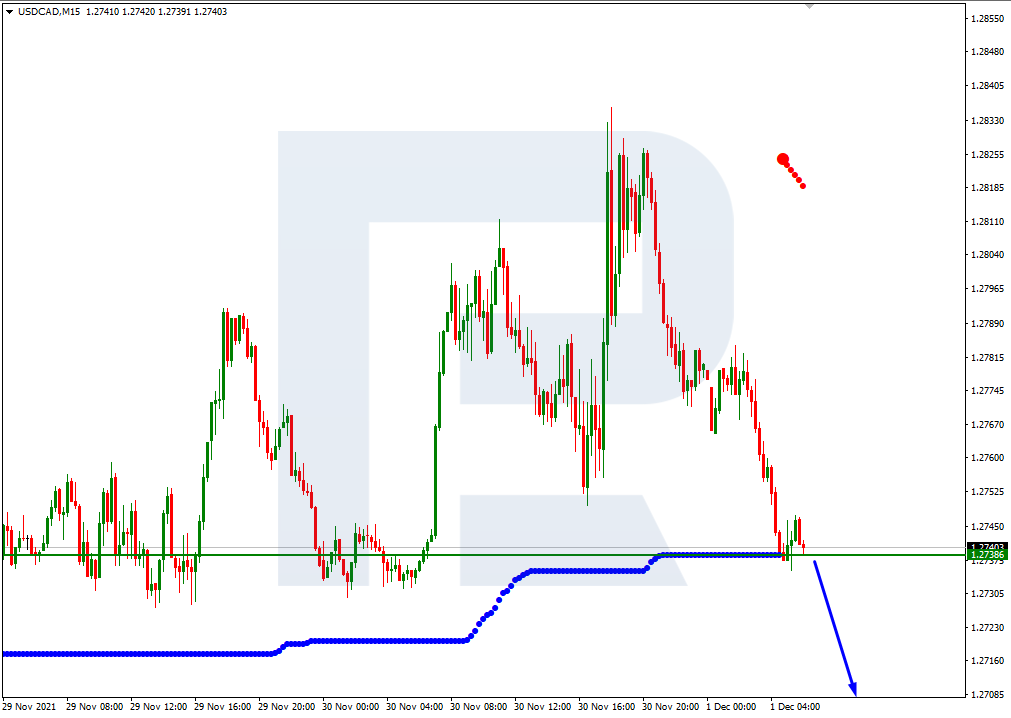
In the M15 chart, the pair may break the downside line of the VoltyChannel indicator and, as a result, continue falling.

USDCAD_M15

Article By RoboForex.com

Attention!
Forecasts presented in this section only reflect the author’s private opinion and should not be considered as guidance for trading. RoboForex LP bears no responsibility for trading results based on trading recommendations described in these analytical reviews.

The Analytical Overview of the Main Currency Pairs on 2021.12.01

by JustForex

The EUR/USD currency pair

Technical indicators of the currency pair:
  • Prev Open: 1.1287
  • Prev Close: 1.1338
  • % chg. over the last day: +0.45%

Eurozone annual inflation accelerated to 4.9% in November from 4.1%, it’s well above the 4.5% forecast and above the ECB’s target. Pressure is now building on the ECB on future monetary stimulus, as the ECB initially did not plan to cut the PEPP program until spring 2022.

Trading recommendations
  • Support levels: 1.1230, 1.1168
  • Resistance levels: 1.1350, 1.1436, 1.1535, 1.1613, 1.1667, 1.1717

From a technical point of view, the EUR/USD on the hour time frame is still bearish, but yesterday the price made an attempt to break out of the priority change level but failed to consolidate above. The MACD indicator became inactive. Under such market conditions, traders should consider sell positions from the priority change level of 1.1371. Buy trades should be considered only from the support levels of the higher time frame, given the buyers’ initiative, but only with short targets.

Alternative scenario: if the price breaks out through the 1.1371 resistance level and fixes above, the mid-term uptrend will likely resume.

EUR/USD
News feed for 2021.12.01:
  • – German Retail Sales (m/m) at 09:00 (GMT+2);
  • – German Manufacturing PMI (m/m) at 10:55 (GMT+2);
  • – Eurozone Manufacturing PMI (m/m) at 11:00 (GMT+2);
  • – US ADP Nonfarm Employment Change (m/m) at 15:15 (GMT+2);
  • – US ISM Manufacturing PMI (m/m) at 17:00 (GMT+2);
  • – US Fed Chair Powell Testifies at 17:00 (GMT+2);
  • – US Treasury Secretary Yellen Speaks at 17:00 (GMT+2).

The GBP/USD currency pair

Technical indicators of the currency pair:
  • Prev Open: 1.3307
  • Prev Close: 1.3301
  • % chg. over the last day: -0.05%

After analysts reduced their forecasts on the Bank of England rate hike, the British pound lost some ground against the Euro. But unlike the ECB, the Bank of England plans to raise the rate soon, so fundamentally, the British pound can quickly strengthen.

Trading recommendations
  • Support levels: 1.3307
  • Resistance levels: 1.3360, 1.3434, 1.3507, 1.3575, 1.3685, 1.3748

On the hourly time frame, the trend on GBP/USD is bearish. The MACD indicator has become inactive but is still signaling divergence on several time frames. Under such market conditions, traders should consider sell positions from the resistance levels around the moving average. Buy trades should be considered on the support levels of higher time frames, given the buyers’ initiative.

Alternative scenario: if the price breaks out through the 1.3385 resistance level and consolidates above, the bullish scenario will likely resume.

GBP/USD
News feed for 2021.12.01:
  • – UK Manufacturing PMI (m/m) at 11:30 (GMT+2);
  • – UK BoE Gov Bailey’s Speech at 16:00 (GMT+2).

The USD/JPY currency pair

Technical indicators of the currency pair:
  • Prev Open: 13.51
  • Prev Close: 113.18
  • % chg. over the last day: -0.29%

Japan’s manufacturing PMI index shows growth, indicating a gradual recovery from the pandemic. The Japanese Yen at the moment does not have any fundamental factors for strengthening in the mid-term prospect, so analysts expect the growth of USD/JPY quotes at least till the spring of the next year.

Trading recommendations
  • Support levels: 112.87, 112.30
  • Resistance levels: 113.79, 114.48, 115.15, 115.50

The global trend on the USD/JPY currency pair is bearish. At the moment, the price is trading in the corridor with the 112.87-113.79 range. Under such market conditions, it is best for traders to look for sell positions from the resistance levels around the moving average or from the upper border of the corridor. Buy positions should be considered from the false breakdown zone formed yesterday when the price tried to move down.

Alternative scenario: if the price rises above 114.52, the uptrend will likely resume.

USD/JPY
News feed for 2021.12.01:
  • – Japan Manufacturing PMI (m/m) at 02:30 (GMT+2).

The USD/CAD currency pair

Technical indicators of the currency pair:
  • Prev Open: 1.2736
  • Prev Close: 1.2777
  • % chg. over the last day: +0.32%

Oil prices continue to decline amid news that a new variant of the Omicron virus is resistant to vaccines, adding to fears that there could be an excess of supply in the first quarter of next year. The Canadian dollar is a commodity currency, so the CAD is falling sharply against the dollar amid a drop in oil.

Trading recommendations
  • Support levels: 1.2729, 1.2646, 1.2598, 1.2571, 1.2483, 1.2416, 1.2388
  • Resistance levels: 1.2807

From a technical point of view, the trend of the USD/CAD currency is bullish. The MACD indicator has become inactive, but buyer pressure remains high. Under such market conditions, it is better to look for buy trades from the lower border of the flat corridor. Sell deals should be considered from the resistance levels of the higher time frames.

Alternative scenario: if the price breaks down through the 1.2646 support level and fixes below, the downtrend will likely resume.

USD/CAD
News feed for 2021.12.01:
  • – Canada Building Permits (m/m) at 15:30 (GMT+2);
  • – US Crude Oil Reserves (w/w) at 17:30 (GMT+2).

by JustForex


This article reflects a personal opinion and should not be interpreted as an investment advice, and/or offer, and/or a persistent request for carrying out financial transactions, and/or a guarantee, and/or a forecast of future events.

Markets gripped by Omicron menace

Lukman Otunuga

By Lukman Otunuga Senior Research Analyst, ForexTime

A wave of risk aversion upset European markets on Tuesday as concerns over the effectiveness of existing Covid-19 vaccines against the Omicron virus left investors on edge.

US equity markets are in the red while bond yields have fallen as market players fled from riskier assets to safe-haven destinations. The Omicron variant has most definitely hijacked the headlines, roiled global markets and darkened the overall mood.

A growing number of countries have reported confirmed cases of the variant, including the United Kingdom, Germany, and Hong Kong among many others. This has led to oil being one of the biggest casualties with prices collapsing last Friday and limping into the new week under renewed pressure. Caution certainly remains the name of the game, and this may see global stocks remain depressed as the new virus in town overshadows economic data. Nevertheless, Omicron uncertainty coupled with other key events this week like the OPEC+ meeting and US jobs report could result in explosive levels of volatility over the next few sessions.

Dollar weakens despite risk-off mood

The dollar has depreciated against almost every single G10 currency today, despite the risk-off sentiment stimulating appetite for safe-haven assets. Weakness in the dollar may be attributed to action in bond markets with Treasury yields on a slippery decline below 1.50%.

Fed Chair Jerome Powell and Treasury Secretary Janet Yellen are due to testify before the US Senate Banking Committee this afternoon.  In prepared testimony ahead of his appearance, Powell said the Omicron variant posed risks to both sides of the central bank’s mandate. Essentially, it could impact both growth and inflation, and with it the US economic recovery, ultimately affecting the Fed’s tapering timeline and future rate hikes. Powell is expected to provide more insight this afternoon alongside Treasury Chief Janet Yellen which could impact the dollar further.

Looking at the technical picture, the Dollar Index has shed over 0.5% today with prices approaching the 95.52 level. A solid breakdown below this point could open the doors towards 95.00.

No love for oil ahead of OPEC meeting

Brent crude is struggling to nurse the deep wounds inflicted from last Friday’s brutal selloff, with prices extending losses in the new trading week. Crude has shed almost 4% today as concerns over the new Covid-19 variant weighed heavily. Given how the Omicron variant has triggered fresh travel restrictions across the globe, this certainly does not bode well for the demand outlook at a time when Covid cases have already been rising in Europe.

The main risk event for oil will be the OPEC+ meeting on Thursday. It’s worth keeping in mind that the cartel already agreed at its last meeting to increase output by 400k barrels per day in December, so any decision made this week will likely take effect in January production levels. There is speculation around the cartel halting its planned supply increase in January. Whatever, the outcome of the meeting it will certainly have an impact on oil which has lost over 16% in November.

Commodity spotlight – Gold

Gold was back in fashion on Tuesday as Omicron virus fears accelerated the flight to safety. A weaker dollar and falling Treasury yields supported upside gains, with prices trading above $1800 as of writing. With markets reining in bets on the Fed tightening policy, gold has the potential to shine ahead of the US jobs report on Friday.

Disclaimer: The content in this article comprises personal opinions and should not be construed as containing personal and/or other investment advice and/or an offer of and/or solicitation for any transactions in financial instruments and/or a guarantee and/or prediction of future performance. ForexTime (FXTM), its affiliates, agents, directors, officers or employees do not guarantee the accuracy, validity, timeliness or completeness, of any information or data made available and assume no liability as to any loss arising from any investment based on the same.


Forex-Time-LogoArticle by ForexTime

ForexTime Ltd (FXTM) is an award winning international online forex broker regulated by CySEC 185/12 www.forextime.com
AAPL Is The Ending Diagonal Not Complete Yet?

By Orbex

AAPL

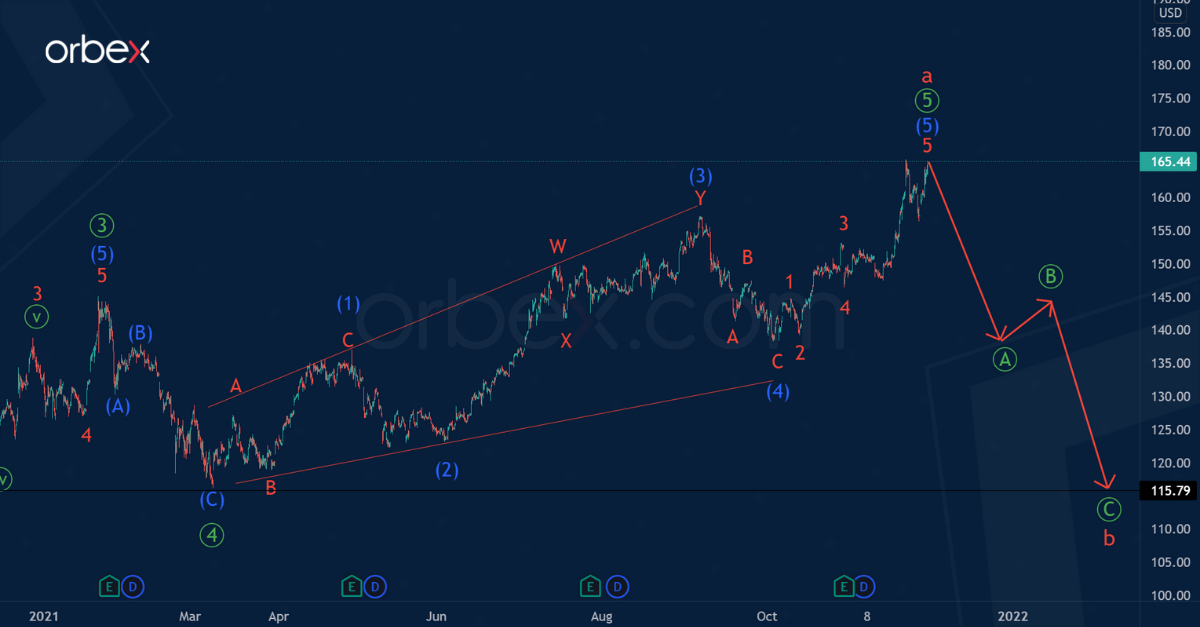
AAPL shares seem to be forming a primary fifth wave, taking the form of an ending diagonal of the intermediate degree (1)-(2)-(3)-(4)-(5). This wave is also the final one in the cycle impulse a.

It is likely that at the moment we are in the intermediate wave (3). This wave is taking the form of a double combination W-X-Y. An actionary wave Y is necessary to complete the specified pattern.

Bulls in the minor wave Y can send the market to the level of 174.48, which is on the resistance line. And then the price could fall within the correction (4) to the support level of 138.14, as shown on the chart.

AAPL

An alternative scenario suggests that the ending diagonal has fully completed its pattern, and the cycle impulse wave a has also come to an end.

If that is the case, then in the upcoming trading weeks market participants will see a collapse in prices in a cycle correction b. This correction may take the form of a standard zigzag Ⓐ-Ⓑ-Ⓒ.

There is a high probability that the bears will be able to bring the market to the previous low of -115.79, where the primary fourth correction ended earlier.


Orbex-LogoArticle by Orbex

Orbex is a fully licensed broker that was established in 2011. Founded with a mission to serve its traders responsibly and provides traders with access to the world’s largest and most liquid financial markets. www.orbex.com

The US Federal Reserve can fully complete the QE program at the next meeting

by JustForex

Fed chief Jerome Powell indicated in his speech to the US Senate that the US central bank could fully reduce large-scale bond purchases in two weeks, referring to a strong economy. This will be a necessary first step toward raising rates next year to prevent inflationary problems by the end of 2022. The chairman of the US Federal Reserve said that the economy was likely to pass the target the Fed has set for raising interest rates on inflation in the coming months. On the other hand, it will still need complete employment before it starts the rise. Mr. Powell also pointed out that inflation in the United States could no longer be called “temporary”.

Powell’s statement was received negatively by traders, leading to a sharp strengthening of the dollar index and a decline in major stock indices worldwide. By the end of the trading session on Tuesday, Dow Jones Industrial Average (US30) decreased by 1.86% (-3.98% for the month), S&P 500 (US500) lost 1.90% (-1.01% for the month), and the tech index Nasdaq (US100) decreased by 1.55% (-0.37% for the month).

The US consumer sentiment index continued its decline in November, falling 4.3 points to 109.5, according to the Conference Board. This is the third consecutive decline.

Ray Dalio, a famous hedge-fund manager, said that there was no need to “go to the cash” right now despite the heightened market volatility due to a new strain of the virus. Dalio said that cash would burn because of high inflation, and reliable and balanced portfolios would save investors. At the same time, the billionaire is worried about a lot of liquidity in the economy: “It won’t raise living standards in an important way. As inflation then begins to bite, it has political consequences”.

European stock indices also closed in the red area yesterday. French index CAC 40 (FR40) decreased by 0.81% (-2.5% for the month), British FTSE 100 (UK100) decreased by 0.44% (-3.14% for the month), German DAX (DE40) lost 1.18% (-4.47% for the month), Spanish IBEX (ES35) lost 1.78% (-9.56% for the month). Eurozone annual inflation accelerated to 4.9% in November from 4.1%; it’s well above the 4.5% forecast and above the ECB’s target. Pressure is now building on the ECB on future monetary stimulus, as the ECB initially did not plan to cut the PEPP program until spring 2022.

Rating agency MOODY pointed out that the emergence of the Omicron strain creates new risks to global economic growth and inflation expectations. MERCK expects the Covid-19 drug to be effective against the Omicron strain.

The White House is disappointed that oil prices fell, but gasoline prices remained at the same level. Yesterday, WTI crude oil fell below $65 a barrel for the first time since August, and the Vix oil volatility index reached 2008 levels. Oil prices increased more than 3% this morning ahead of an OPEC+ meeting, where major producers will discuss how to respond to the threat of falling fuel demand due to the Omicron strain. Algeria’s Energy Minister said yesterday that OPEC+ would deliver enough oil to the world market and take all necessary measures to maintain market balance amid fears of a new strain.

Asian markets, on the other hand, are showing a recovery today. Japan’s Nikkei index (JP225) increased by 0.41% (-6.16% for the month), Hong Kong’s Hang Seng (HK50) added 0.75% (-6.68% for the month), Australia’s ASX 200 (AU200) decreased by 0.28% (-1.21% for the month).

Evergrande’s price fell by 4.8% yesterday after Chairman Hui Ka Yan had sold part of his stake in the company, raising about $344 million. He sold 1.2 billion shares on Friday, reducing his stake from 77% to 67.9% to solve the problem of more than $300 billion debt.

Main market quotes:

S&P 500 (F) (US500) 4,567.00 −88.27 (−1.90%)

Dow Jones (US30) 34,483.72 −652.22 (−1.86%)

DAX (DE40) 15,100.13 −180.73 (−1.18%)

FTSE 100 (UK100) 7,059.45 −50.50 (−0.71%)

USD Index 96.27 +0.18 (+0.19%)
Important events for today:

– Australia GDP (q/q) at 02:30 (GMT+2);
– Japan Manufacturing PMI (m/m) at 02:30 (GMT+2);
– German Retail Sales (m/m) at 09:00 (GMT+2);
– German Manufacturing PMI (m/m) at 10:55 (GMT+2);
– Eurozone Manufacturing PMI (m/m) at 11:00 (GMT+2);
– UK Manufacturing PMI (m/m) at 11:30 (GMT+2);
– US ADP Nonfarm Employment Change (m/m) at 15:15 (GMT+2);
– Canada Building Permits (m/m) at 15:30 (GMT+2);
– UK BoE Gov Bailey’s Speech at 16:00 (GMT+2);
– US ISM Manufacturing PMI (m/m) at 17:00 (GMT+2);
– US Fed Chair Powell Testifies at 17:00 (GMT+2);
– US Treasury Secretary Yellen Speaks at 17:00 (GMT+2);
– US Crude Oil Reserves (w/w) at 17:30 (GMT+2).

by JustForex


This article reflects a personal opinion and should not be interpreted as an investment advice, and/or offer, and/or a persistent request for carrying out financial transactions, and/or a guarantee, and/or a forecast of future events.