World stock indices have demonstrated growth since the new Omicron strain turned out to be less dangerous than expected

by JustForex

Omicron’s latest research suggests that the new strain of the coronavirus is less dangerous than expected. The US stock indices closed higher on Monday as easing concerns about the impact of the Omicron Covid-19 strain resumed investor views on cyclical and technology stocks. At the close of the stock exchange, the Dow Jones Industrial Average (US30) increased by 1.87%, the S&P 500 Index (US500) added 1.17% and the Nasdaq Composite Index (US100) increased by 0.93%.

Tesla CEO Elon Musk said that the US Congress should not approve the Biden administration’s bill to increase subsidies for electric cars, saying that the proposal would worsen the country’s budget deficit.

The Securities and Exchange Commission (SEC) launched an investigation into Tesla’s solar panels due to their possible spontaneous self-burning. Shares of Lucid Group fell 5.1% yesterday after it was reported that SEC had sued the electric car maker Lucid over a deal that took the company public this summer.

The European stock market closed in the green area yesterday. Investors have started to move funds from safe-haven assets to the stock market as Omicron risks have decreased and stock prices are at good levels now. Germany’s DAX (DE40) increased by 1.4%, Britain’s FTSE 100 (UK100) added 1.54%, France’s CAC40 (FR40) gained by 1.5%, and Spain’s IBEX (ES35) jumped by 2.4%. In Germany, electricity prices are approaching a new record. Germany’s industrial production increased sharply by 2.8% last month, while analysts had expected a 0.8% increase.

The capitalization of the Airbus aircraft manufacturing group rose by 4.6%. The company’s helicopter division received an order to supply 26 helicopters for Saudi Arabia during French President Emmanuel Macron’s visit to Riyadh.

Carbon prices reached a new high of 81.64 euros per ton. Carbon is up nearly 150% this year.

China has eased its monetary policy by cutting reserve requirements for banks for the second time in 2021. The People’s Bank of China will cut the reserve requirement ratio for most banks by 0.5 percentage points next week.

Asia-Pacific stock markets rose in Tuesday’s trading, following the positive dynamics of US and European stock indexes. Japan’s Nikkei 225 Index (JP225) gained 1.89%, Hong Kong’s Hang Seng (HK50) jumped by 2.48%, and Australia’s ASX 200 (AU200) added 0.95%.

Shares of Japan’s largest bank, SoftBank, fell by 8% yesterday and decreased for the 7th straight day on the delisting of Didi and after the US Federal Trade Commission decided to block the sale of Arm to Nvidia.

Shares of Chinese real estate developer China Evergrande fell about 14% to a May 2010 low amid indications that China Evergrande may officially default. The company is due to pay investors about $10 billion in bonds in January.

The Russian ruble is falling since the US and European allies weigh sanctions targeting major Russian banks and officials if Russia begins the invasion of Ukraine. A video call between US President Joe Biden and Russian President Vladimir Putin over the situation on the border with Ukraine will take place today.

Australia’s central bank expectedly kept its key interest rate at a record low of 0.1% and kept its bond-buying program unchanged. The stimulus program is scheduled to be cut in February 2022.

Main market quotes:

S&P 500 (F) (US500) 4,591.67 +53.24 (+1.17%)

Dow Jones (US30) 35,227.03 +646.95 (+1.87%)

DAX (DE40) 15,380.79 +210.81 (+1.39%)

FTSE 100 (UK100) 7,232.28 +109.96 (+1.54%)

USD Index 96.28 +0.16 (+0.17%)

Important events for today:
  • – Australia RBA Interest Rate Decision (m/m) at 05:30 (GMT+2);
  • – Australia RBA Rate Statement (m/m) at 05:30 (GMT+2);
  • – German Industrial Production (m/m) at 09:00 (GMT+2);
  • – Germany ZEW Economic Sentiment (m/m) at 12:00 (GMT+2);
  • – Eurozone ZEW Economic Sentiment (m/m) at 12:00 (GMT+2);
  • – Eurozone GDP (q/q) at 12:00 (GMT+2);
  • – Canada Ivey PMI (m/m) at 17:00 (GMT+2).

by JustForex


This article reflects a personal opinion and should not be interpreted as an investment advice, and/or offer, and/or a persistent request for carrying out financial transactions, and/or a guarantee, and/or a forecast of future events.


Trade Of The Week: Gold Waits For Fundamental Catalyst

Lukman Otunuga

By Lukman Otunuga Senior Research Analyst, ForexTime

Gold commenced the week in a muted fashion as investors digested last Friday’s mixed US jobs report.

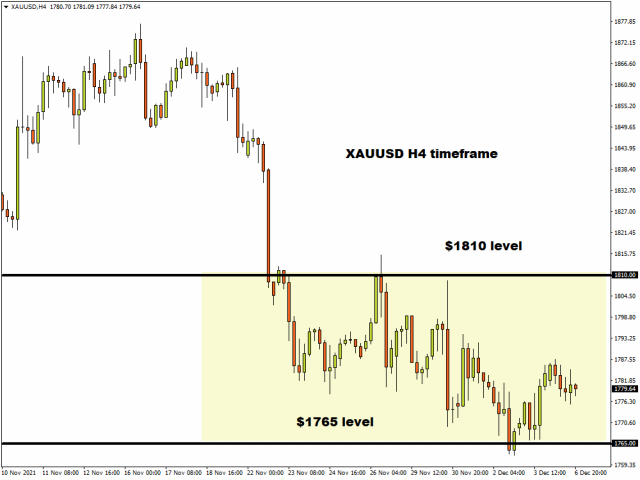
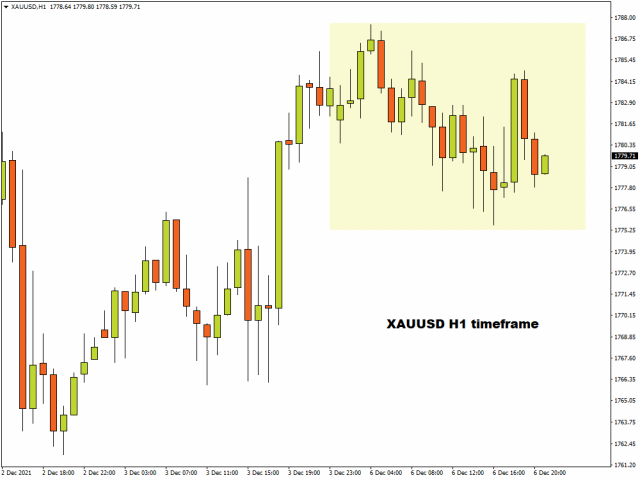
Bulls and bears were missing in action with prices stuck within a $10 range despite the cautious mood. While the Fed’s hawkish tilt, Omicron fears, dollar, and Treasury yields among other themes are likely to continue influencing gold, the precious metal could be waiting for a fresh fundamental spark. Taking a look at this week’s economic calendar, this catalyst may be the latest US inflation numbers released on Friday.

After concluding November -0.5% lower, things are looking slow for the precious metal thus far. Nevertheless, some action could be around the corner if prices break above or below the two-week range.

All eyes on the US inflation report

Inflation in the United States remains at elevated levels with consumer prices surging 6.2% in October, the highest in more than three decades. November’s consumer price index data is expected to show inflation surging to 6.7% thanks to persistent supply chain issues, higher energy costs, and strong consumer demand. Given Jerome Powell’s recent comment that the Fed could speed up bond tapering to counter inflation, the pending CPI report has the potential to rock markets.

Another jump in US consumer price inflation may fuel market expectations over the Federal Reserve raising interest rates more quickly than expected. But this is where things get tricky. If the Fed pulls the rate hike trigger prematurely, this may expose the US economy to downside risks. It will be interesting to see how the Fed tames inflation without sending the U.S economy into a recession, while also dealing with the Omicron threat. A hot US CPI report could rekindle appetite for safe-haven assets like gold if US recession fears resurface.

Traders are currently pricing in a 64% probability of at least one rate hike by early May 2022 and a 99% probability by mid-June next year.

Gold ETFs favour bears  

According to an automated report from Bloomberg, gold ETFs cut 196,935 troy ounces of gold from their holdings last Friday, marking the biggest one-day decrease since October 1st, 2021.

The sharp outflow could be the result of the mixed US jobs report doing little to alter hawkish Fed expectations. An ETF (Exchange Traded Funds) is an investment instrument that allows retail traders to gain exposure to an existing market or groups of markets. A gold ETF provides investors exposure to gold without owning it physically. Outflows from ETF’s are seen as bearish for the underlying asset. In this instance, ETF investors could be reducing their exposure to the zero-yielding metal amid the prospects of higher interest rates.

Keep an eye on the breakout

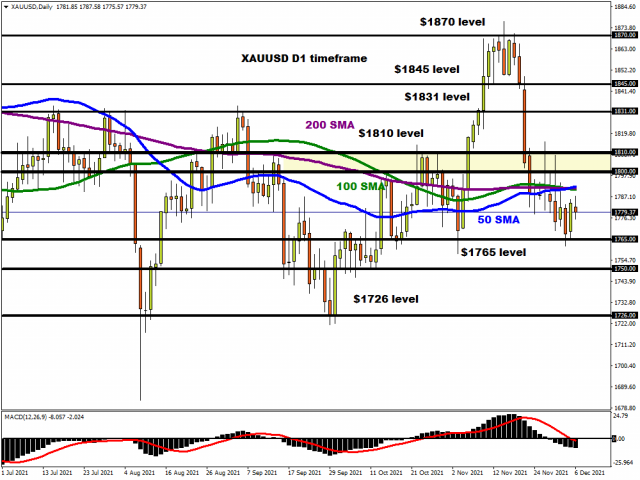
Gold prices have been trapped within a wide range on the daily charts with support at $1765 and resistance around $1810. A solid breakout and daily close above $1810 could encourage a move towards $1831, $1845, and $1870. Should $1765 prove to be unreliable support, a decline back towards $1750 and $1726, could be on the cards.

Disclaimer: The content in this article comprises personal opinions and should not be construed as containing personal and/or other investment advice and/or an offer of and/or solicitation for any transactions in financial instruments and/or a guarantee and/or prediction of future performance. ForexTime (FXTM), its affiliates, agents, directors, officers or employees do not guarantee the accuracy, validity, timeliness or completeness, of any information or data made available and assume no liability as to any loss arising from any investment based on the same.


Forex-Time-LogoArticle by ForexTime

ForexTime Ltd (FXTM) is an award winning international online forex broker regulated by CySEC 185/12 www.forextime.com

RBA Interest Rate Decision: The End Of Optimism?

By Orbex

After the last RBA meeting, there was a bullish outlook for the AUD. The Reserve Bank upgraded its targets and brought forward their guidance for when rates might lift off. The economy looked like it was back on solid footing after the lockdowns had been lifted.

Now, most of the headlines going into the RBA meeting are talking about the threat from the omicron variant. That said, the Reserve Bank might have a more cautious outlook and tone down some of the optimism following the last meeting.

The fact that Australia confirmed its first case of community spread of omicron didn’t help matters. Nonetheless, just because the press is talking a lot about it, that doesn’t mean it’s what the RBA will be most focused on.

To lockdown or not to lockdown

The main issue with a resurgence of a new variant, of course, is whether it will cause a new round of lockdowns.

However, that’s not a monetary policy decision. The RBA is likely to focus on the underlying data, and not try to pre-guess what the state authorities will do. So far, both Victoria and ACT premiers have insisted that they won’t go into lockdown again.

To be sure, the RBA can hedge potential uncertainty. However, by providing a pessimistic view ahead of the summer, they could actually hurt the economic outlook and contradict their efforts to support growth.

If the RBA is worried about the possibility of another economic hit, that could keep investors on hold, and cause an economic hit. Without any concrete measures regarding omicron, there is good reason for the RBA to stay on course.

What to expect

There is a unanimous agreement among analysts that the RBA will keep its policy unchanged at the upcoming meeting. Any potential impact to the markets will likely come from any changes in the language regarding the outlook.

However, the RBA just recently updated their projections at the last meeting. And there is a consensus that they will likely wait to see the impact. Without a press conference scheduled for after the meeting, there is little chance that any questions could rile up the markets as well.

In other words, everything is pointing to the meeting being a non-event. That is except with all the commentary about the new variant there might have been some pre-adjustment in the market.

So, an across-the-board affirmation of the outlook by the RBA might provide a little bit of a boost for the AUD, as it would help calm some of the uncertainty.

Where could the AUD go?

The RBA’s likelihood to keep things on hold doesn’t mean the AUD is out of the woods. The general loss of risk sentiment, combined with an expectation that central banks aren’t about to change their guidance, is likely to keep weighing on commodity currencies.

A weaker AUD also contributes to higher inflation in the country. And that’s a further reason for the RBA to keep its outlook steady.

Even if it doesn’t play a role in the RBA meeting, omicron is likely to keep being the major factor driving the Aussie. Any positivity we get out of the monetary policy decision could quickly evaporate if there are further negative headlines on the virus front.


Orbex-LogoArticle by Orbex

Orbex is a fully licensed broker that was established in 2011. Founded with a mission to serve its traders responsibly and provides traders with access to the world’s largest and most liquid financial markets. www.orbex.com

Fibonacci Retracements Analysis 06.12.2021 (GOLD, USDCHF)

Article By RoboForex.com

XAUUSD, “Gold vs US Dollar”

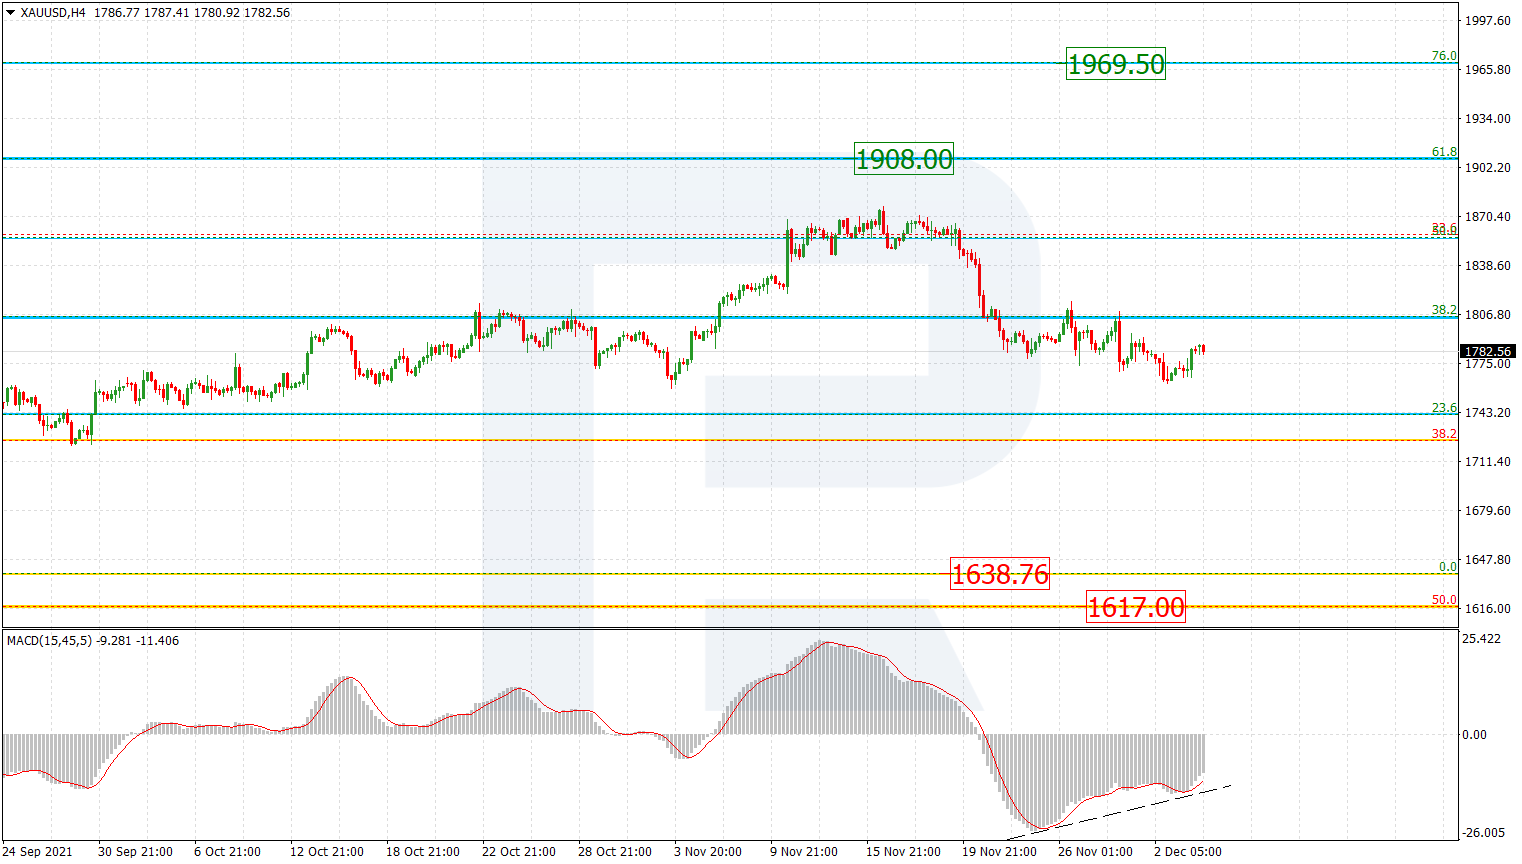
In the H4 chart, after growing and reaching 50.0% fibo, XAUUSD is correcting downwards. Convergence on MACD indicates that the correction may be over soon. In this case, the next upside targets may be 61.8% and 76.0% fibo at 1908.00 and 1969.50 respectively. The key support is the low at 1638.76.

GOLD_H4
Risk Warning: the result of previous trading operations do not guarantee the same results in the future

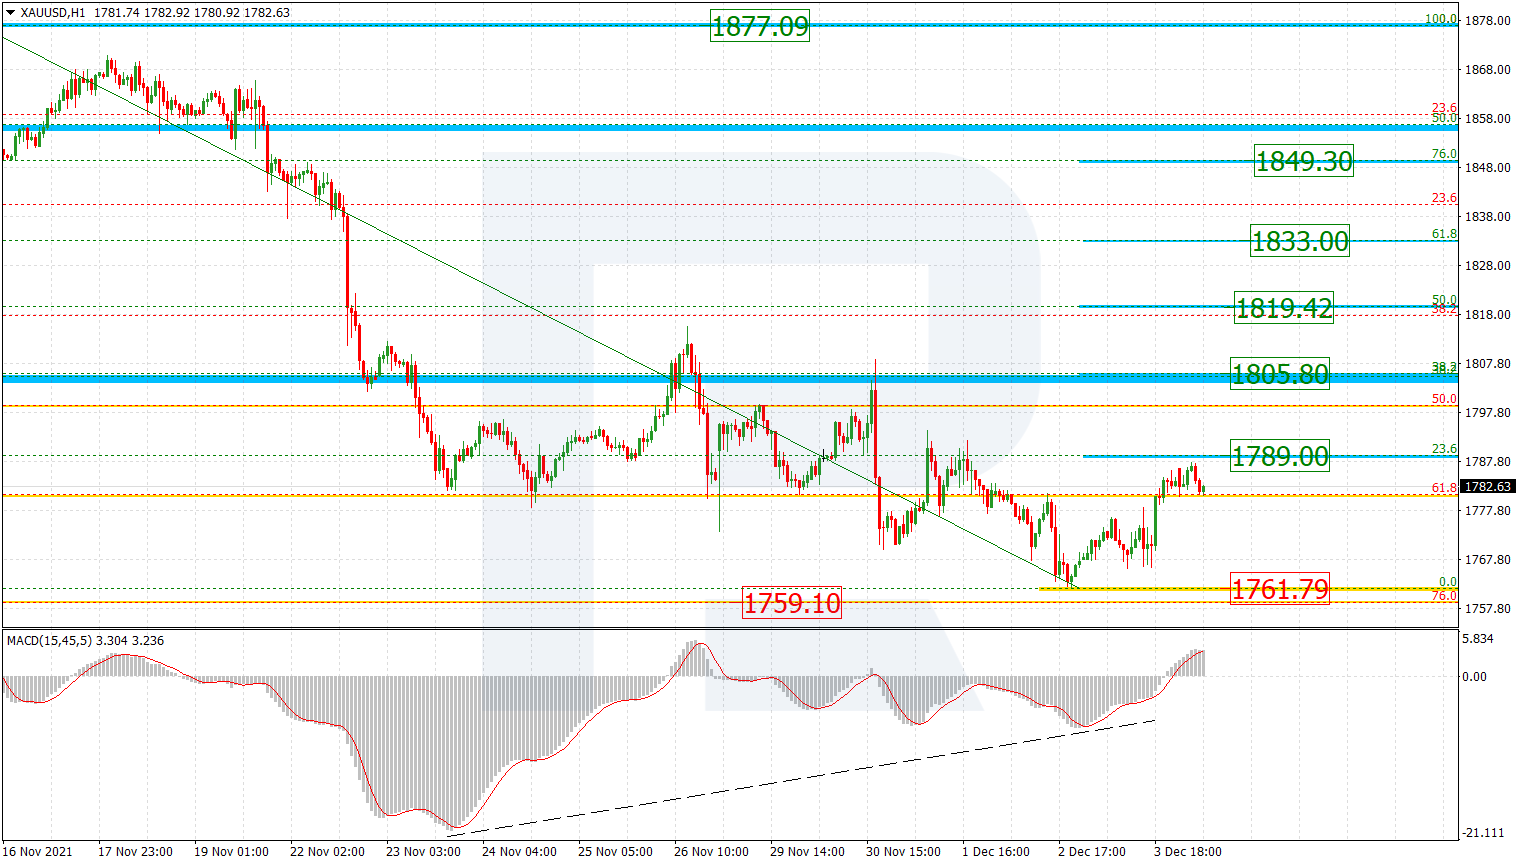
As we can see in the H1 chart, the pair is forming the first rising wave after convergence on MACD, which has almost tested 23.6% fibo at 1789.00 and may later continue towards 38.2%, 50.0%, 61.8%, and 76.0% fibo at 1805.80, 1819.42, 1833.00, and 1849.30 respectively. The key upside target is the current high at 1877.09, while the support is at 1761.79.

GOLD_H1
Risk Warning: the result of previous trading operations do not guarantee the same results in the future

USDCHF, “US Dollar vs Swiss Franc”

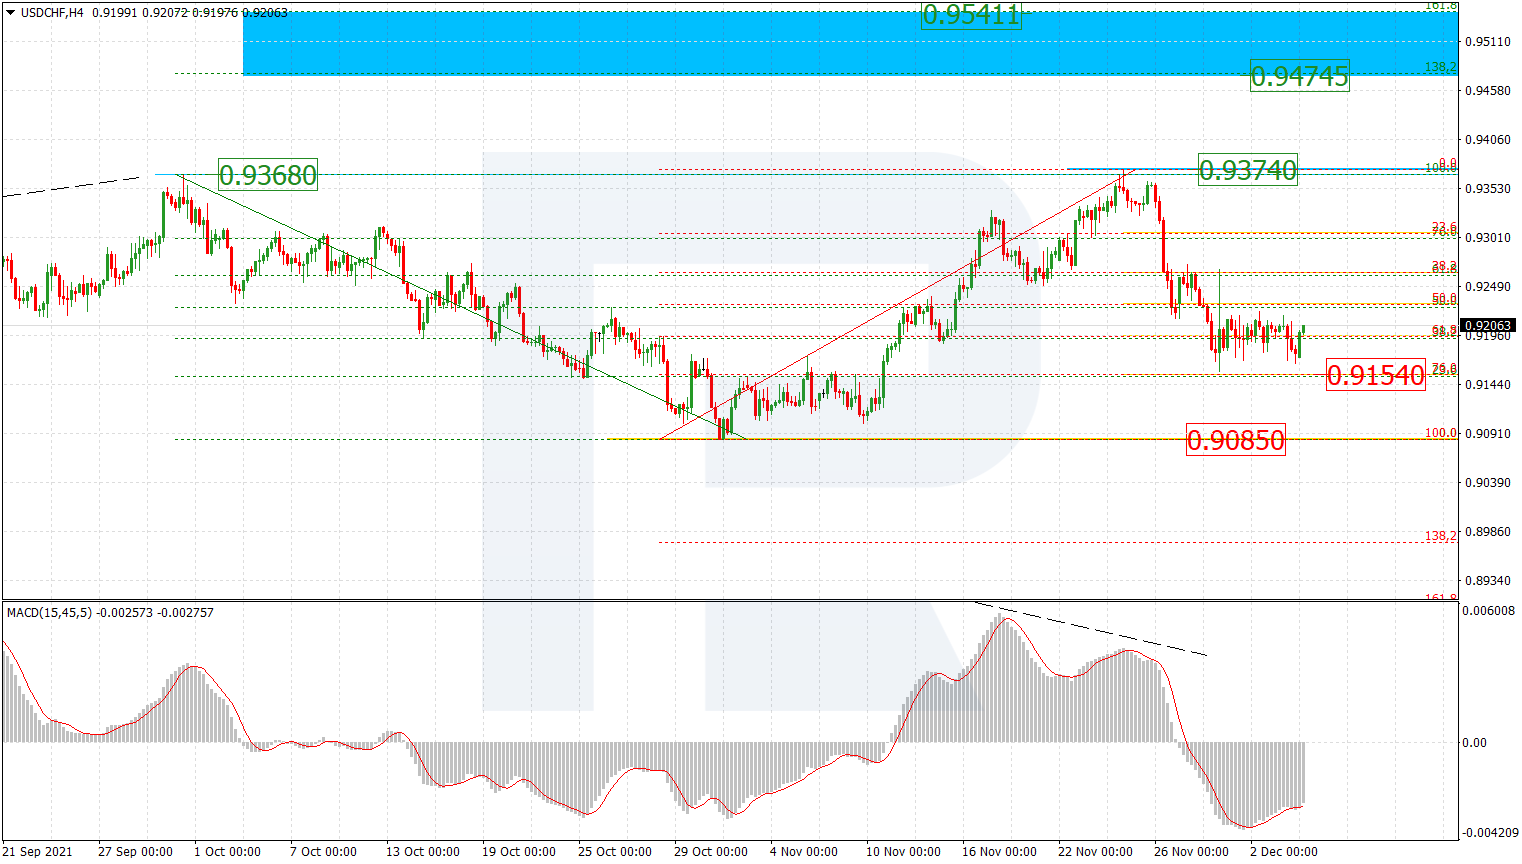
As we can see in the H4 chart, after updating its previous high, the asset started a new descending correction, which has almost reached 76.0% fibo and may later continue towards the high at 0.9374. A breakout of the high will result in a further uptrend towards the post-correctional extension area between 138.2% and 161.8% fibo at 0.9474 and 0.9541 respectively. The key support remains at 0.9085.

USDCHF_H4
Risk Warning: the result of previous trading operations do not guarantee the same results in the future

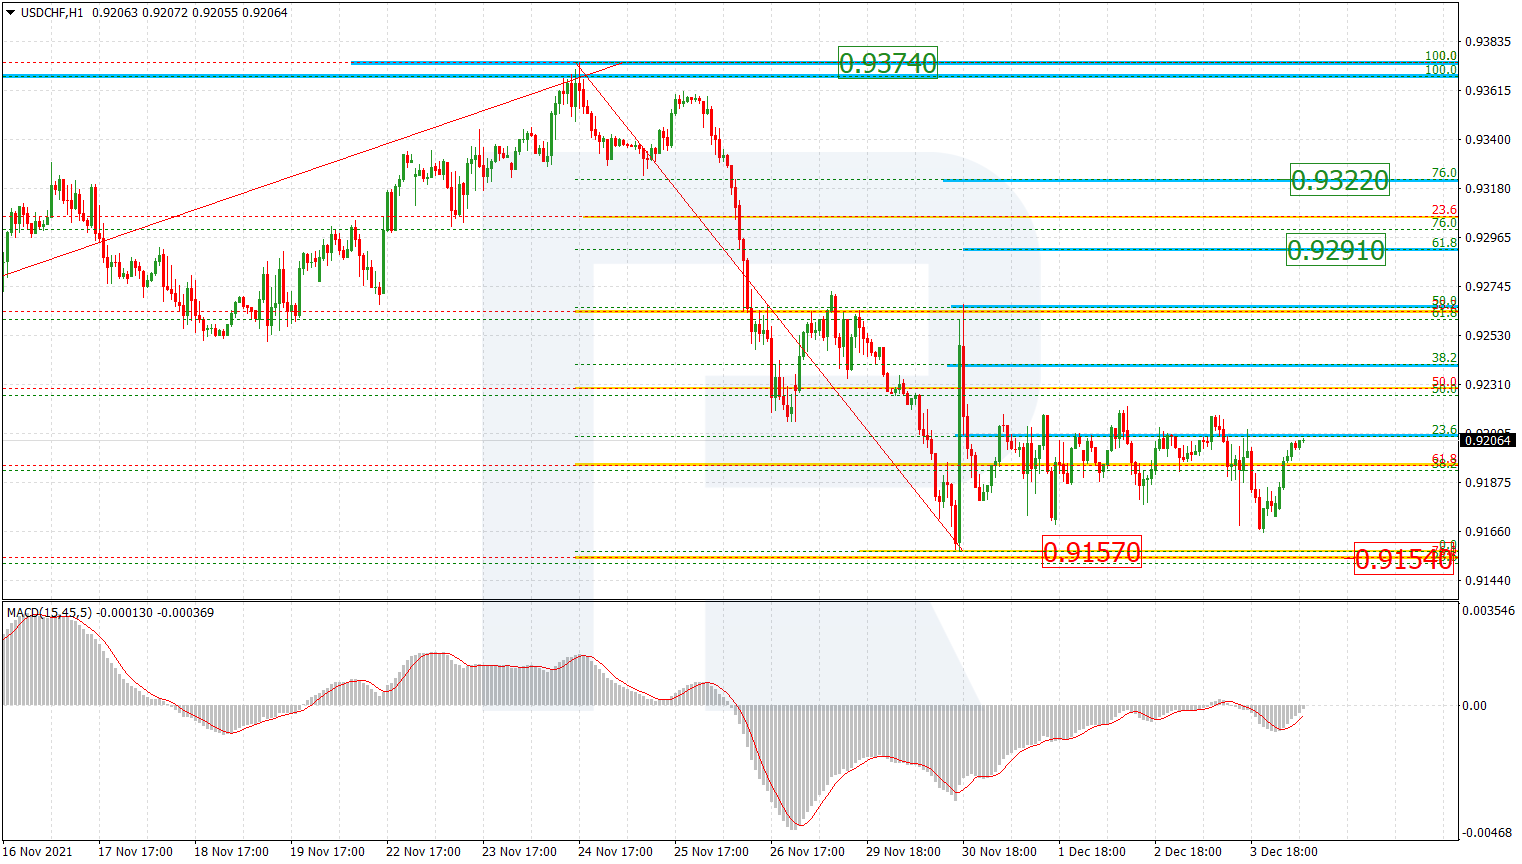
In the H1 chart, convergence on MACD made the pair stop falling and start a rather volatile rising impulse, which has reached 50.0% fibo. At the moment, the price is moving sideways. The local support is at 0.9157. The current situation doesn’t exclude a possibility of a further decline towards the above-mentioned support but the main scenario implies another growth to reach 61.8% and 76.0% fibo at 0.9291 and 0.9322 respectively.

USDCHF_H1

Article By RoboForex.com

Attention!
Forecasts presented in this section only reflect the author’s private opinion and should not be considered as guidance for trading. RoboForex LP bears no responsibility for trading results based on trading recommendations described in these analytical reviews.

Japanese Candlesticks Analysis 06.12.2021 (USDCAD, AUDUSD, USDCHF)

Article By RoboForex.com

USDCAD, “US Dollar vs Canadian Dollar”

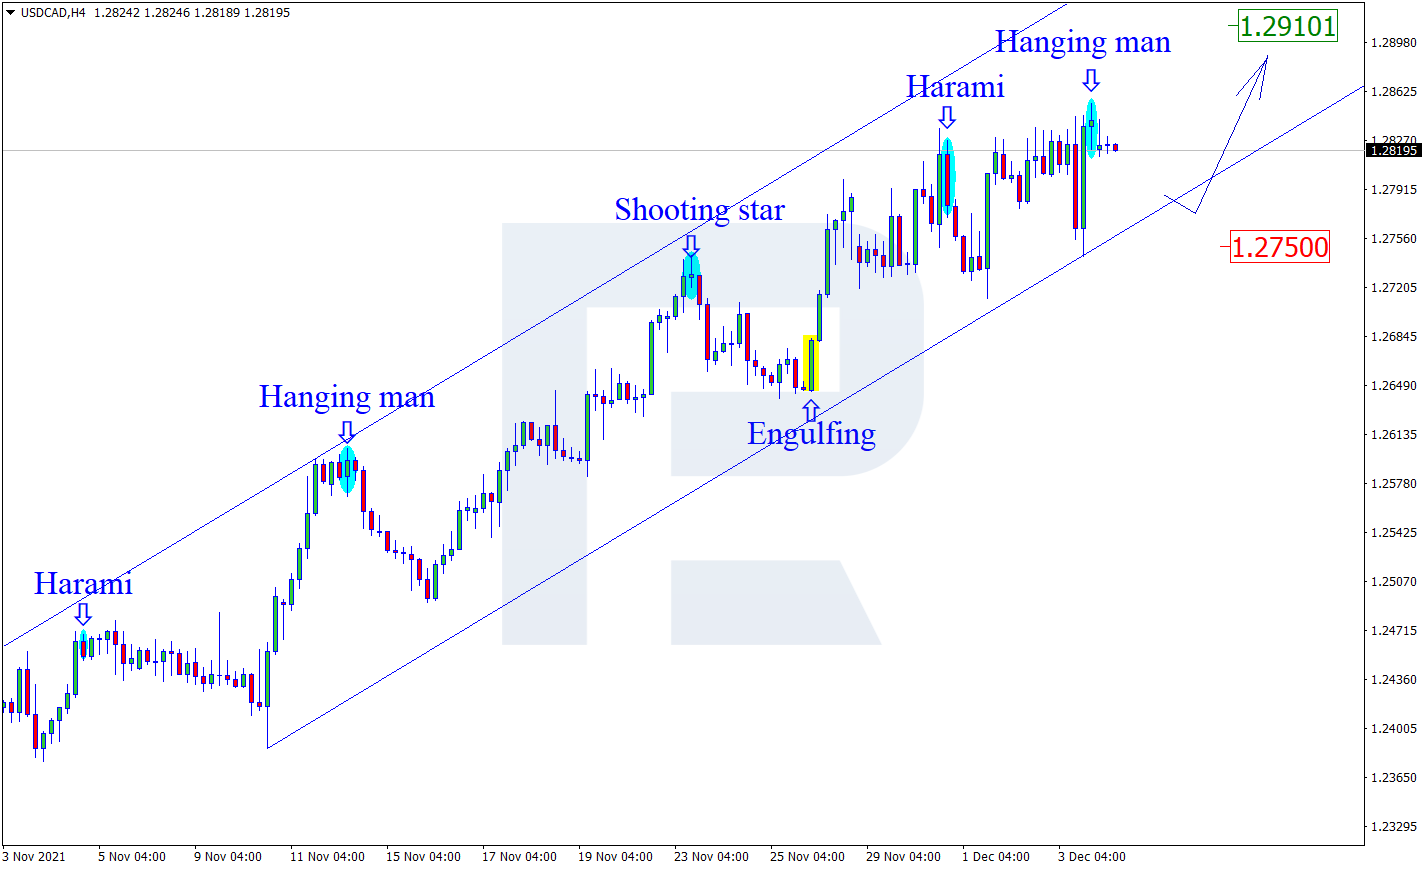
As we can see in the H4 chart, after forming a Hanging Man reversal pattern close to the resistance level, USDCAD is reversing in the form of another pullback. In this case, the downside correctional target may be the support area at 1.2750. However, an alternative scenario implies that the asset may continue growing to reach 1.2910 without testing the support area and forming any corrections.

USDCAD
Risk Warning: the result of previous trading operations do not guarantee the same results in the future

AUDUSD, “Australian Dollar vs US Dollar”

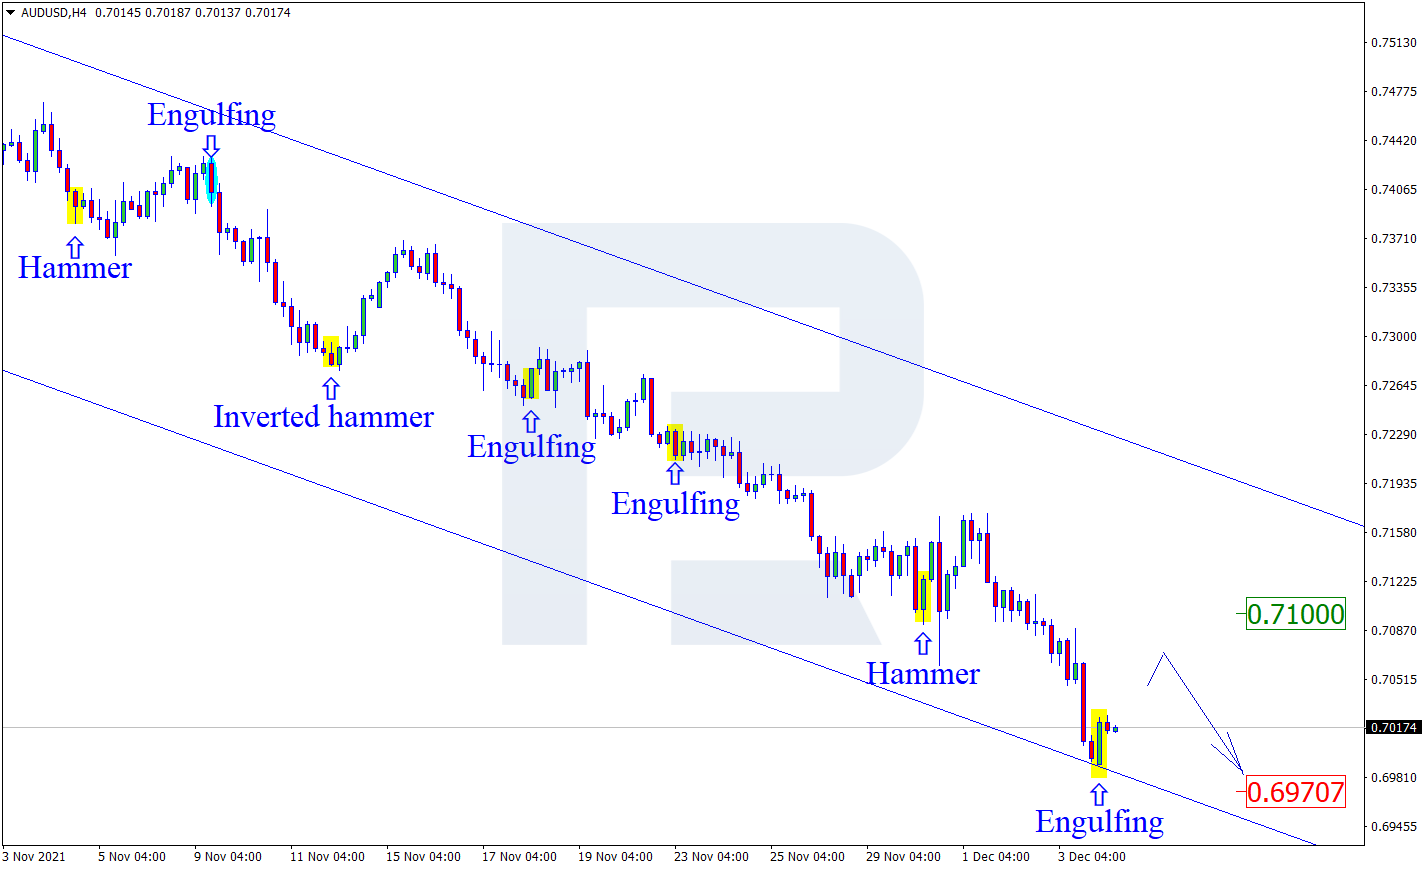
As we can see in the H4 chart, AUDUSD has formed several reversal patterns, such as Engulfing, near the channel’s downside border. At the moment, the asset may reverse in the form of another correctional impulse. In this case, the upside correctional target may be the resistance area at 0.7100. At the same time, an opposite scenario implies that the price may continue falling to reach 0.6970 without correcting towards the resistance area.

AUDUSD
Risk Warning: the result of previous trading operations do not guarantee the same results in the future

USDCHF, “US Dollar vs Swiss Franc”

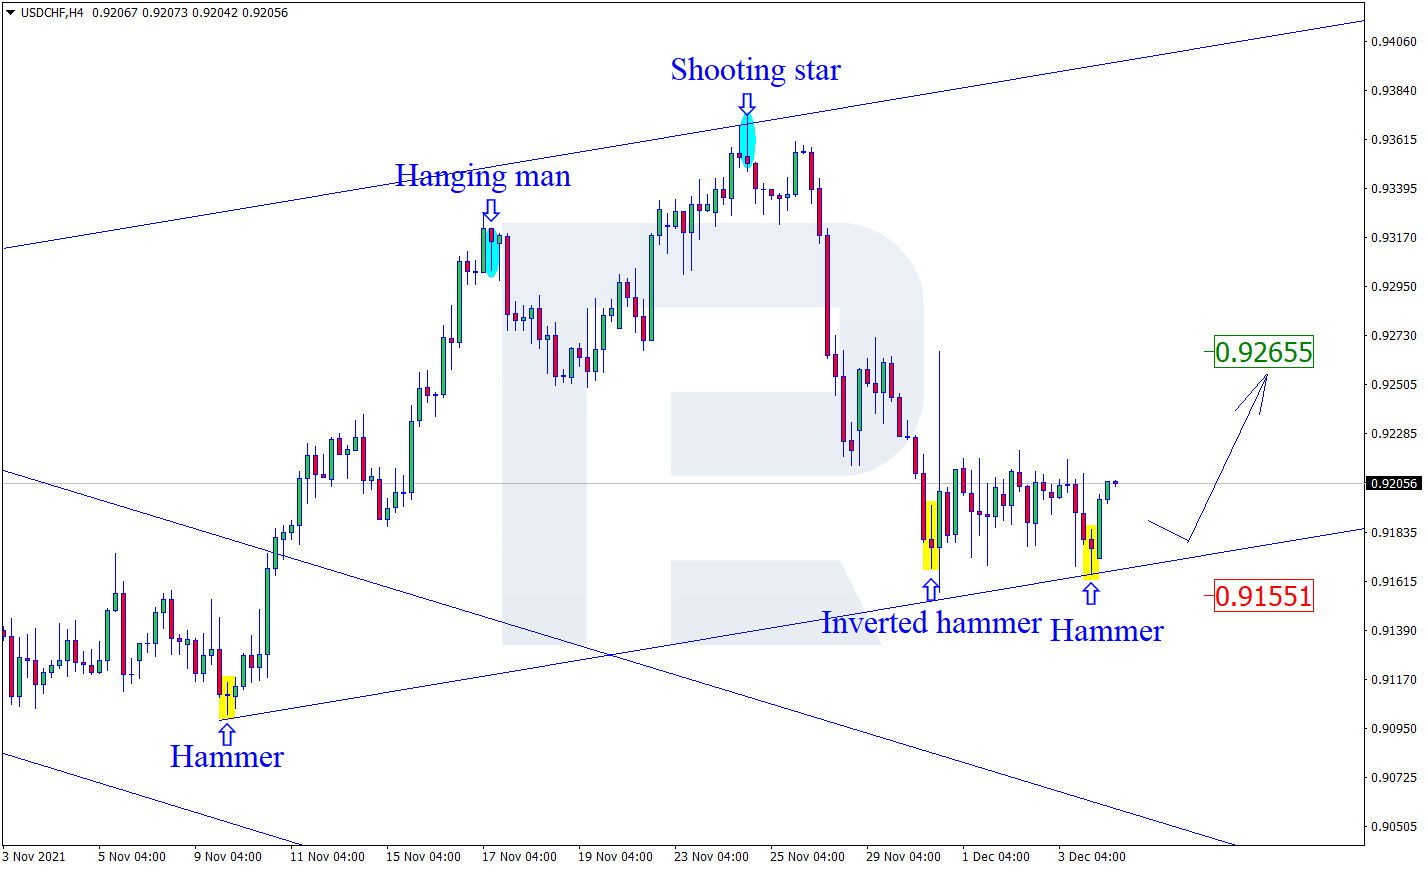
As we can see in the H4 chart, after testing the support area, the pair has formed several reversal patterns, for example, Hammer. At the moment, USDCHF is reversing in the form of a new rising wave towards the resistance level. In this case, the upside target may be at 0.9265. Still, there might be an alternative scenario, according to which the asset may continue falling to reach 0.9155 before resuming its ascending tendency towards the resistance level.

USDCHF

Article By RoboForex.com

Attention!
Forecasts presented in this section only reflect the author’s private opinion and should not be considered as guidance for trading. RoboForex LP bears no responsibility for trading results based on trading recommendations described in these analytical reviews.

US Dollar is Rising Again

By Dmitriy Gurkovskiy, Chief Analyst at RoboForex

EUR/USD is back to falling on Monday; it is currently trading at 1.1280.

Last Friday’s statistics on the US labour market for November were rather mixed. However, the ISM and PMI data may help the market to recapture the positive tendency.

The Unemployment Rate in the US dropped from 4.6% in October to 4.2% in November. At the same time, the Average Hourly Earnings added only 0.3% m/m, less than expected. The Non-Farm Employment Change was really disappointing and showed 210K after being 546K the month before and against the expected reading of 553K.

The numbers are very mixed: the labour market may have slowed down the job creation process, but only the December data will show whether it is accidental or regular.

These mixed signals from the labour market are quite unlikely to prevent the US Fed from deciding in favour of a more active QE program closure during its meeting scheduled for 15 December.

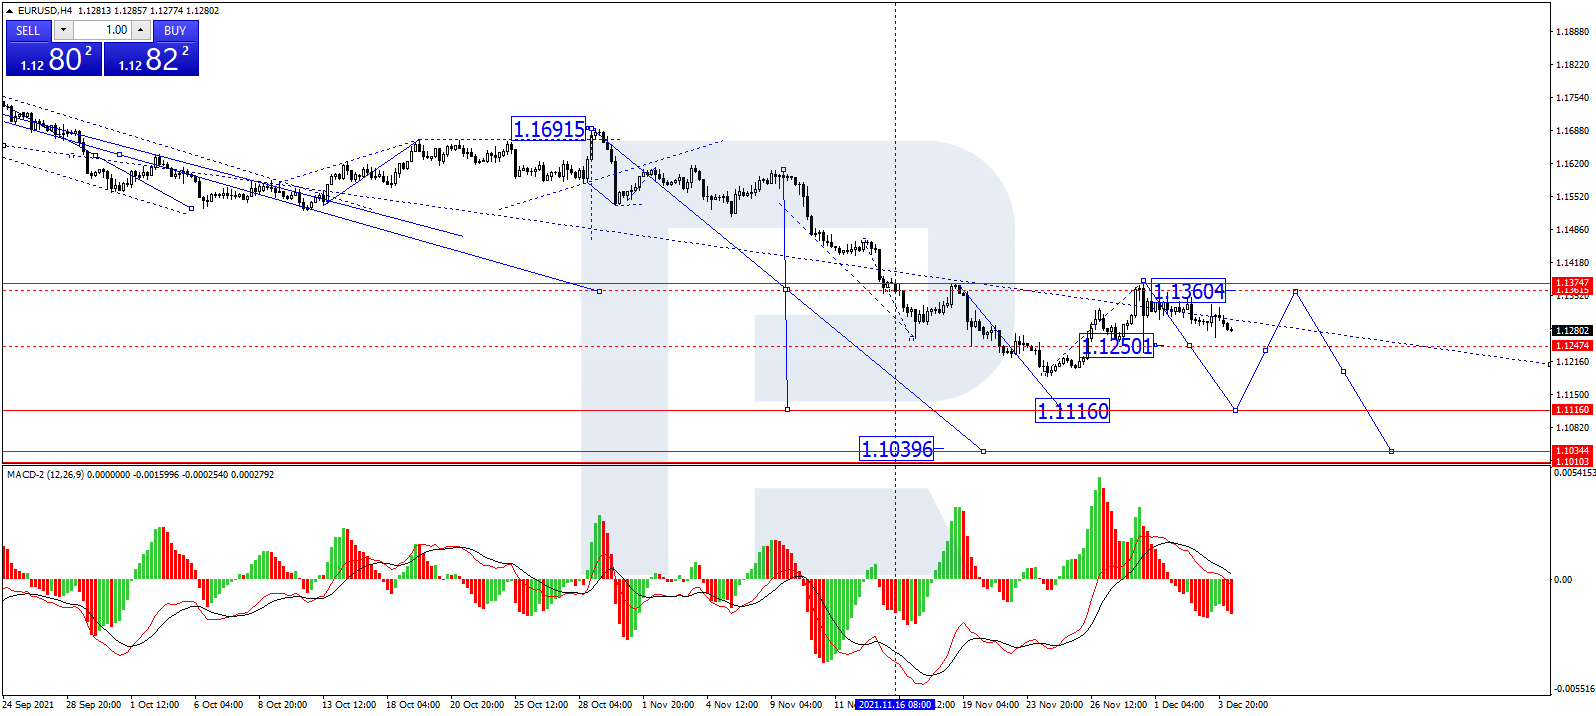
In the H4 chart, EUR/USD is trading downwards to reach 1.1247 and may later consolidate there. If later the price breaks the range to the downside, the market may resume falling towards 1.1116. After that, the instrument may start a new correction to return to 1.1247 and then resume falling with the target at 1.1110. From the technical point of view, this scenario is confirmed by MACD Oscillator: its signal line is moving to break 0 and may later continue falling towards new lows.

EURUSDH4 forex chart

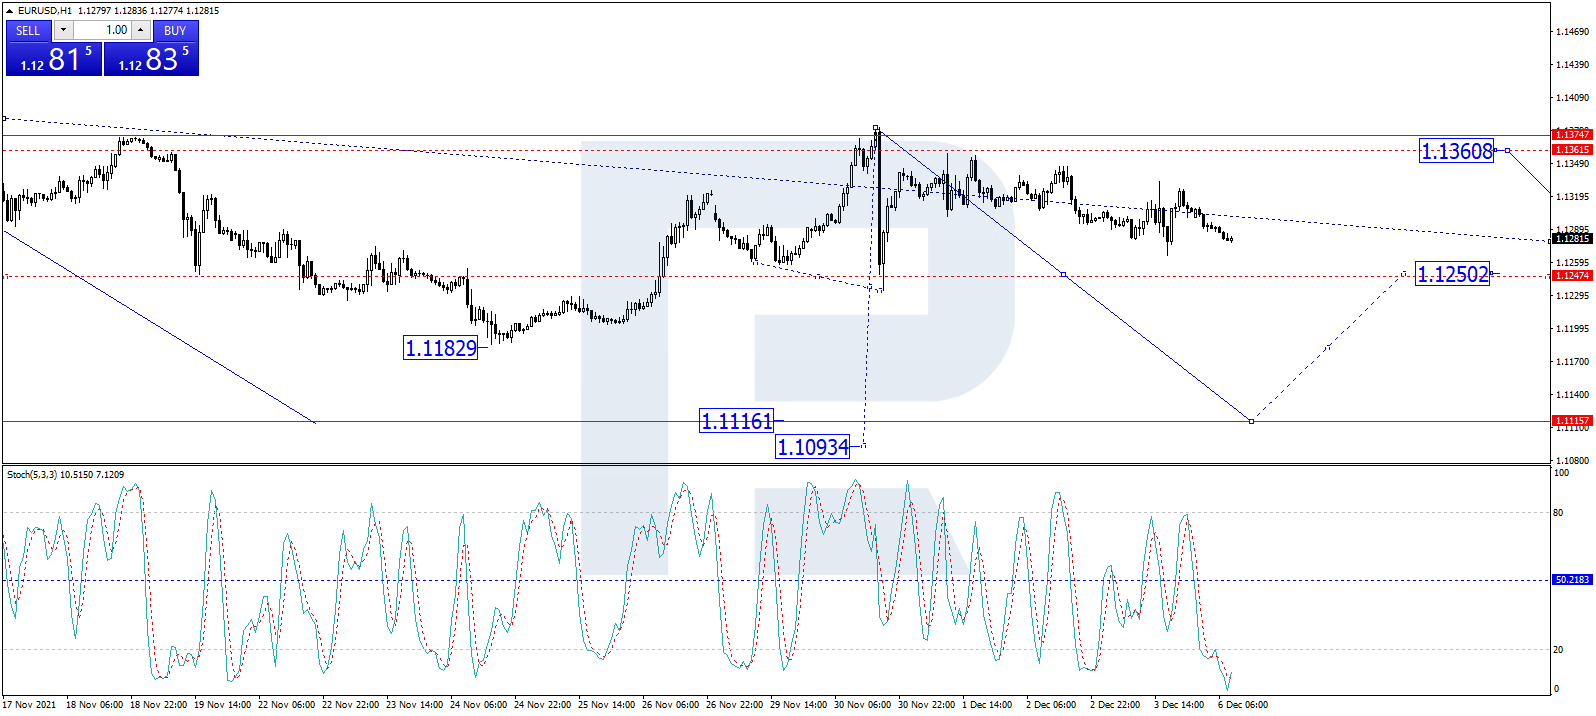
As we can see in the H1 chart, EUR/USD is forming the third descending wave; it has already completed the first wave at 1.1266 along with the correction towards 1.1326. At the moment, the asset is falling to reach 1.1250 and may later form a new consolidation range as a downside continuation pattern. If the price breaks the range to the downside, the market may resume falling with the short-term target at 1.1140 and then form one more descending structure to reach 1.1111. From the technical point of view, this idea is confirmed by the Stochastic Oscillator: its signal line is moving below 20, thus implying a furth

EURUSDH1 forex chart

Disclaimer

Any forecasts contained herein are based on the author’s particular opinion. This analysis may not be treated as trading advice. RoboForex bears no responsibility for trading results based on trading recommendations and reviews contained herein.

BABA Has The Primary Correction Ended?

By Orbex

BABA

The BABA formation suggests the construction of a large bullish Ⓐ-Ⓑ-Ⓒ zigzag of the primary degree.

Apparently, at the time of writing, we are in the final part of the primary correction Ⓑ. This correction can take the form of an intermediate triple zigzag (W)-(X)-(Y)-(X)-(Z).

It seems that the growth in the intervening wave (X) has ended, and now the formation of the initial part of the final actionary wave (Z) is taking place. This is likely to take a complex formation of a double zigzag W-X-Y. The collapse of prices in wave (Z) could reach the level of 50.65. At that price level, it will be equal to wave (Y).

After the completion of the primary correction Ⓑ, market participants will see an impulse growth significantly above the maximum of 246.55.

BABA

According to the alternative, the formation of the primary correction wave Ⓑ has already come to an end. Thus, in the near future, we can expect the formation of the initial part of the bullish impulse Ⓒ.

Wave Ⓒ could be a simple impulse consisting of intermediate waves (1)-(2)-(3)-(4)-(5). The end intermediate impulse (3) could end near 273.78. This is on the level of intervening wave (X).

If the market moves according to the second option, then it is possible to consider opening deals for purchases, in order to take profit at a maximum of 273.78.


Orbex-LogoArticle by Orbex

Orbex is a fully licensed broker that was established in 2011. Founded with a mission to serve its traders responsibly and provides traders with access to the world’s largest and most liquid financial markets. www.orbex.com

International Monetary Fund asks Fed to accelerate QE cuts

by JustForex

Last week on Friday, investors’ attention was focused on US nonfarm payrolls data. The labor market statistics were disappointing. The US economy added only 210,000 jobs in November (against 533,000 expected), while the unemployment rate decreased from 4.6% to 4.2%. Also, last week, Fed Chairman Jerome Powell said that the central bank will probably discuss reducing its stimulus program more quickly at its meeting later this month. A lot will depend on US inflation data due, which will be published later this week. Analysts are predicting a rise in inflation to 6.7% in annual terms. The acceleration of inflation may strengthen expectations of a faster reduction of QE by the Fed. The US stock market fell again on Friday. By the close of the stock market, Dow Jones Index (US30) decreased by 0.17% (-4.14% for the week), S&P500 (US500) decreased by 0.84% (-2.27% for the week), and NASDAQ Technology Index (US100) lost 1.92% (-4.14% for the week) and became the fall leader among the major US indices. Stocks sold off due to the twin uncertainties over the Omicron strain and the prospect of a faster reduction in the Federal Reserve’s stimulus program.

The International Monetary Fund warned Friday that it would likely lower its global economic growth estimates because of a new variant of the coronavirus. The number of countries reporting cases of Omicron continues to grow. However, scientists are still unsure whether it is more contagious than other variants, how serious the disease is, and what level of protection existing vaccines provide. The emergence of Omicron has already hit financial markets and undermined the global economic recovery.

Also, the International Monetary Fund has asked the Federal Reserve to tighten monetary policy with a faster pace because of rising inflation risks.

According to Bank of America’s weekly report, falling equity markets, rising volatility, and the prospect of higher rates are classic signs of a market top. Volatility indicators also signal caution. Despite the volatility indicators in the US and Europe rebounding from the 2021 highs earlier last week, they remain well above average.

European stock indices also closed Friday in the red area. British FTSE 100 (UK100) decreased by 0.097% on Friday (+1.11% for the week), French CAC 40 (FR40) decreased by 0.44% (-0.32% for the week), German DAX (DE40) decreased by 0.61% (-1.13% for the week) and Spanish IBEX 35 (ES35) lost 0.71% and became the leader of the fall for the week with -2.56%. Germany will publish inflation data this week. As inflation in the region is rising, there are more and more calls for the ECB to tighten its monetary policy. However, the ECB has always been famous for its conservatism. That’s why analysts are confident that it is not worth waiting for the ECB to change its policy before spring 2022 even if inflation in the region continues to rise. The UK will release October GDP data this week ahead of the Bank of England’s December meeting. Recent UK economic data showed that the Bank of England may start to raise interest rates, but due to new uncertainty surrounding the Omicron strain, policymakers may decide to wait until early 2022 at the December meeting.

Oil prices increased more than $1 a barrel on Monday after Saudi Arabia, the largest exporter, raised the price of its crude oil sold to Asia and the United States, and because US and Iranian negotiations over a renewed nuclear deal appear to have stalled. The analyst expects oil prices to rise to $75 a barrel.

Asian markets traded in positive territory on Friday. Japan’s Nikkei 225 (JP225) gained  1.00% (-1.44% for the week), Hong Kong’s Hang Seng (HK50) increased by 0.093% (-0.60% for the week), and Australia’s S&P/ASX 200 (AU200) added 0.22% (+0.37% for the week). The Japanese yen continues to strengthen as a safe haven currency as uncertainty in the markets is still high due to the spread of the Omicron option, which has led to renewed restrictions in various countries and increased fears over possible stronger action from the Federal Reserve to curb inflation.

In the commodities market, lumber futures (+18%), cocoa (+2.92%), WTI crude (+2.58%), and Brent crude (+2.39%) showed the biggest gains by the end of the week. Futures on natural gas (-6.92%), sugar (-2.89%), and orange juice (-2.22%) showed the biggest drop.

Main market quotes:

S&P 500 (F) (US500) 4,538.43 −38.67 (−0.84%)

Dow Jones (US30) 34,580.08 −59.71 (−0.17%)

DAX (DE40) 15,169.98 −93.13 (−0.61%)

FTSE 100 (UK100) 7,122.32 −6.89 (−0.097%)

USD Index 96.15 +0.01 (+0.01%)

Important events for today:
  • – UK Construction PMI (m/m) at 11:30 (GMT+2).

by JustForex


This article reflects a personal opinion and should not be interpreted as an investment advice, and/or offer, and/or a persistent request for carrying out financial transactions, and/or a guarantee, and/or a forecast of future events.
Intraday Market Analysis – USD Shows Weakness

By Orbex

USDCHF struggles to bounce

USDCHF

The US dollar softened after November’s nonfarm payrolls missed the mark.

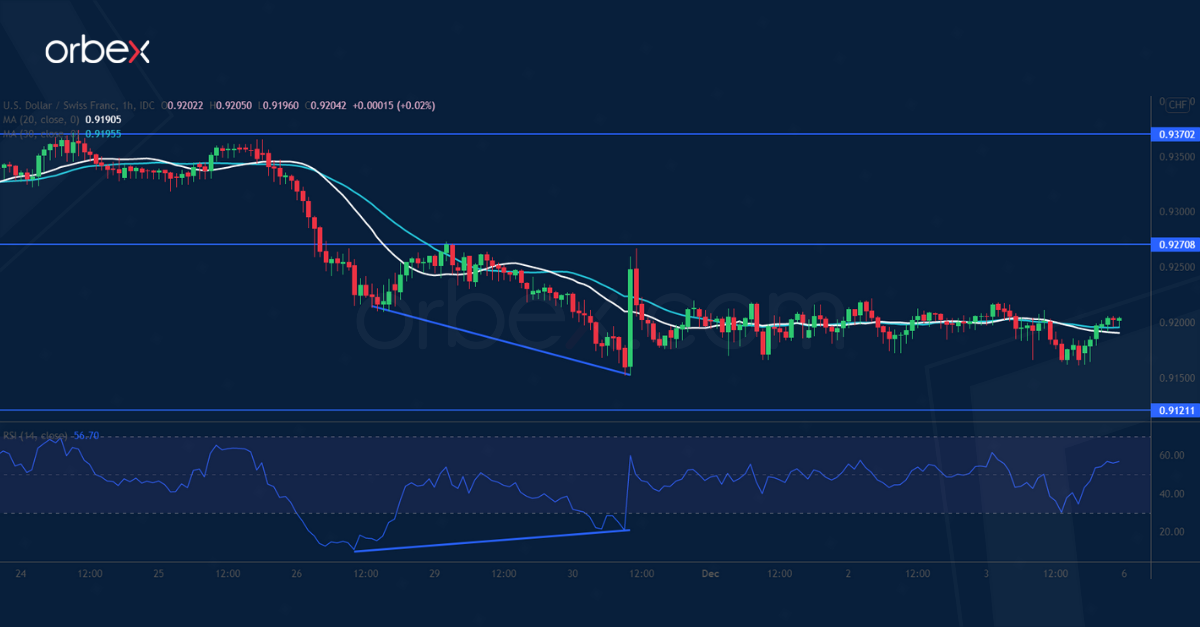
The pair has met stiff selling pressure at 0.9270, a former support that had turned into a resistance. The bullish RSI divergence suggests a slowdown in the sell-off though there is no confirmation yet for a sustainable bounce.

0.9120 is a key demand area on the daily timeframe and a bearish breakout would invalidate the November rebound. Buyers may switch sides as sentiment further deteriorates, exacerbating volatility to the downside.

CADJPY breaks higher

CADJPY

The Canadian dollar surged after November’s unemployment rate fell to 6%. A bearish MA cross on the daily chart still indicates a pessimistic mood.

An oversold RSI on the hourly chart caused a limited bounce as short-term traders took profit. Sellers are eager to fade rebounds with the latest being at 89.20. 87.20 at the base of the October rally would be the next support.

A deeper correction may send the loonie to 85.90. The bulls will need to lift said resistance before they could initiate a reversal.

UK 100 attempts to rebound

UK 100

The FTSE 100 recouped some losses bolstered by a weaker US jobs report. The index saw buying interest over the psychological level of 7000 which sits in the daily demand zone.

The RSI’s double-dip in the oversold area has attracted a ‘buying-the-dips’ crowd in this congestion area. A close above the immediate resistance at 7150 is an encouraging sign of a bullish attempt.

7310 is a major hurdle ahead, its breach could short circuit the correction. 7060 is the closest support in case of weakness in the rebound.


Orbex-LogoArticle by Orbex

Orbex is a fully licensed broker that was established in 2011. Founded with a mission to serve its traders responsibly and provides traders with access to the world’s largest and most liquid financial markets. www.orbex.com

Omicron volatility and hawkish Fed challenge investors

By The Market Research Team, ForexTime

Last week’s hawkish twist by Fed Chair Powell and the spreading new Covid variant, Omicron, will continue to exert uncertainty on the global economy. Both the growth and inflation outlook are set to be impacted, though severe social restrictions that could more forcefully derail activity are not being priced into markets just yet.

We may see more dizzying swings in global stock markets, underscoring how investors are trying to navigate an increasingly cloudy global outlook. Last Wednesday, the benchmark S&P500 US stock index recorded its biggest intraday swing in price since March, with the gauge suffering its worst two weeks of losses in more than a year. This volatility has also been rising in Europe too with a well-watched measure in 50 European blue-chip stocks hitting its highest level in a year.

With the VIX indicator closing above 30 last week, we should expect more whipsaws in the near term. The challenging trading conditions at this time of year, with lower volumes and trading desks winding down risk positions, may exacerbate whippy price action.

US CPI to inform on Fed’s next policy move

The main focus on the data front will be the US CPI for November. As the Fed’s Powell acknowledged last week, inflation is looking less “transitory” than originally expected and Friday’s consumer price data should give the world’s most important central bank further evidence to see if faster policy tightening is warranted.

The headline reading is set to rise 0.7% m/m with the core at 0.5%. This will likely take the annual reading close to 7% and the core above 5%. Notable increases in energy, housing and second-hand car prices are expected. Last month’s data had risen at the fastest pace in three decades and the persistent elevated prints should push the Fed into faster action and be supportive of the US Dollar.

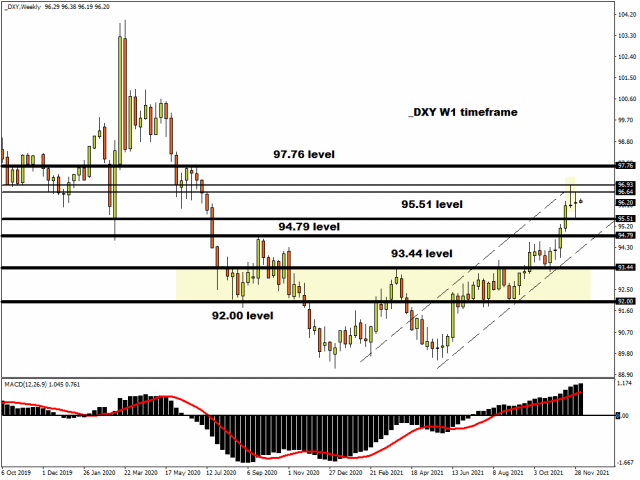
The DXY Index posted a weekly “doji” candle signifying obvious indecision, which is entirely understandable amid all the current uncertainty. Last week’s low at 95.51 should offer initial support while bulls will target 96.64 ahead of the recent high at 96.93. Falling US bond yields will be worth watching as they point to major concerns among investors about the growth outlook going forward.

We do get two G-10 central bank meetings this week, though policy settings are set to remain unchanged at both the RBA and the Bank of Canada. The current direction of travel will be of interest to traders, and whether the Omicron variant will impact the medium-term policy view.

Monday:

AUD: Australia inflation gauge, ANZ job advertisements
EUR: Germany factory orders, construction PMIs
GBP: UK construction PMIs
GBP: BOE’s Ben Broadbent speaks

Tuesday:

CNH: China trade data
JPY: Japan cash earnings, household spending, leading index
AUD: Reserve Bank of Australia policy decision, consumer confidence
EUR: Eurozone GDP, Germany ZEW survey expectations, industrial production
USD: U.S trade data

Wednesday:

CAD: Bank of Canada rate decision
EUR: ECB President Christine Lagarde speaks
JPY: Japan bank lending, BoP, GDP, bankruptcies
US crude: EIA weekly US crude oil inventory report

Thursday:

CNH: China CPI, PPI, money supply, new yuan loans
USD: US President Joe Biden holds summit for Democracy
USD: U.S. wholesale inventories, initial jobless claims

Friday:

JPY: Japan PPI
GBP: UK industrial production, GDP, BOE inflation attitudes survey
USD: US CPI, university Michigan consumer sentiment

Disclaimer: The content in this article comprises personal opinions and should not be construed as containing personal and/or other investment advice and/or an offer of and/or solicitation for any transactions in financial instruments and/or a guarantee and/or prediction of future performance. ForexTime (FXTM), its affiliates, agents, directors, officers or employees do not guarantee the accuracy, validity, timeliness or completeness, of any information or data made available and assume no liability as to any loss arising from any investment based on the same.


Forex-Time-LogoArticle by ForexTime

ForexTime Ltd (FXTM) is an award winning international online forex broker regulated by CySEC 185/12 www.forextime.com