
By Dmitriy Gurkovskiy, Chief Analyst at RoboForex
EUR/USD is back to falling on Monday; it is currently trading at 1.1280.
Last Friday’s statistics on the US labour market for November were rather mixed. However, the ISM and PMI data may help the market to recapture the positive tendency.
The Unemployment Rate in the US dropped from 4.6% in October to 4.2% in November. At the same time, the Average Hourly Earnings added only 0.3% m/m, less than expected. The Non-Farm Employment Change was really disappointing and showed 210K after being 546K the month before and against the expected reading of 553K.
The numbers are very mixed: the labour market may have slowed down the job creation process, but only the December data will show whether it is accidental or regular.
These mixed signals from the labour market are quite unlikely to prevent the US Fed from deciding in favour of a more active QE program closure during its meeting scheduled for 15 December.
Free Reports:
 Download Our Metatrader 4 Indicators – Put Our Free MetaTrader 4 Custom Indicators on your charts when you join our Weekly Newsletter
 Get our Weekly Commitment of Traders Reports - See where the biggest traders (Hedge Funds and Commercial Hedgers) are positioned in the futures markets on a weekly basis.
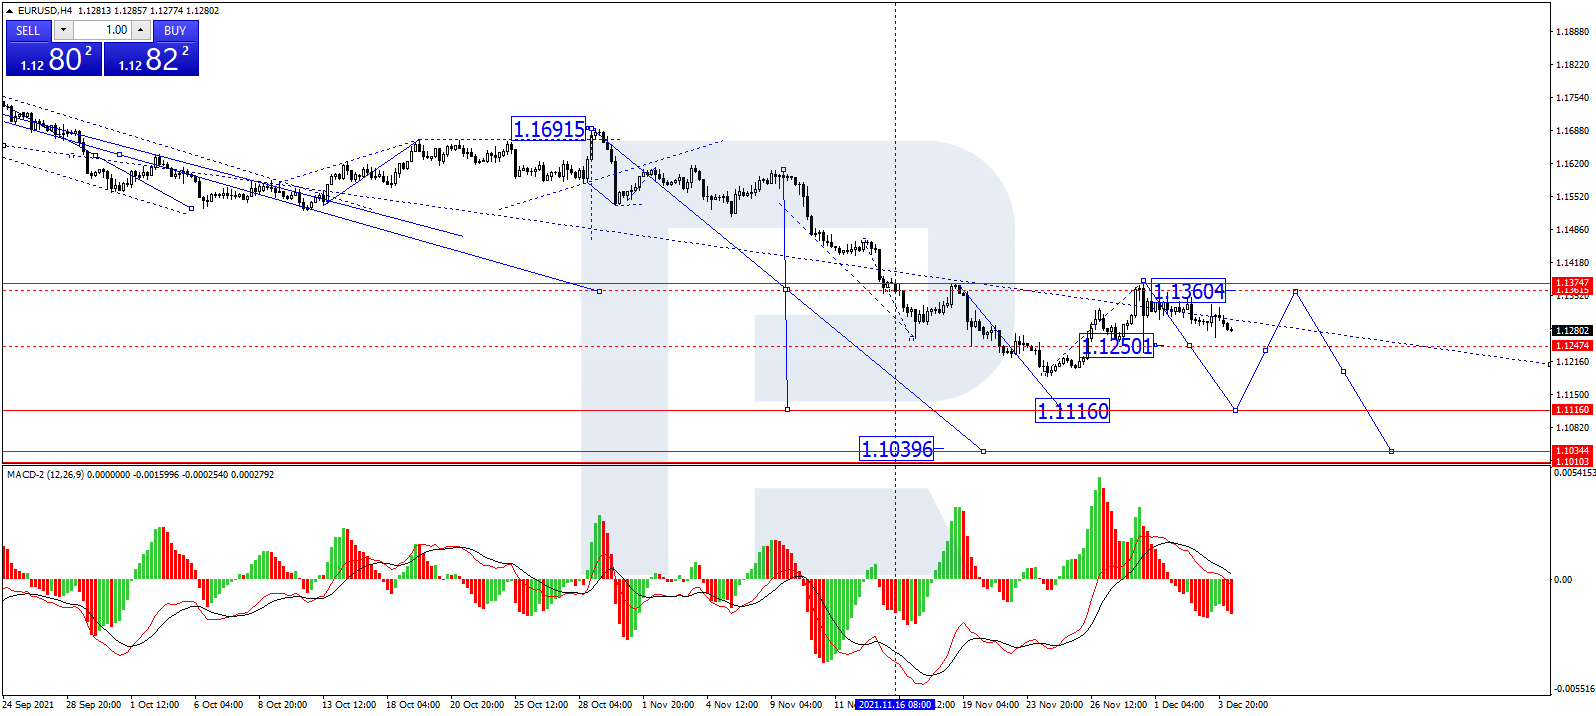
In the H4 chart, EUR/USD is trading downwards to reach 1.1247 and may later consolidate there. If later the price breaks the range to the downside, the market may resume falling towards 1.1116. After that, the instrument may start a new correction to return to 1.1247 and then resume falling with the target at 1.1110. From the technical point of view, this scenario is confirmed by MACD Oscillator: its signal line is moving to break 0 and may later continue falling towards new lows.
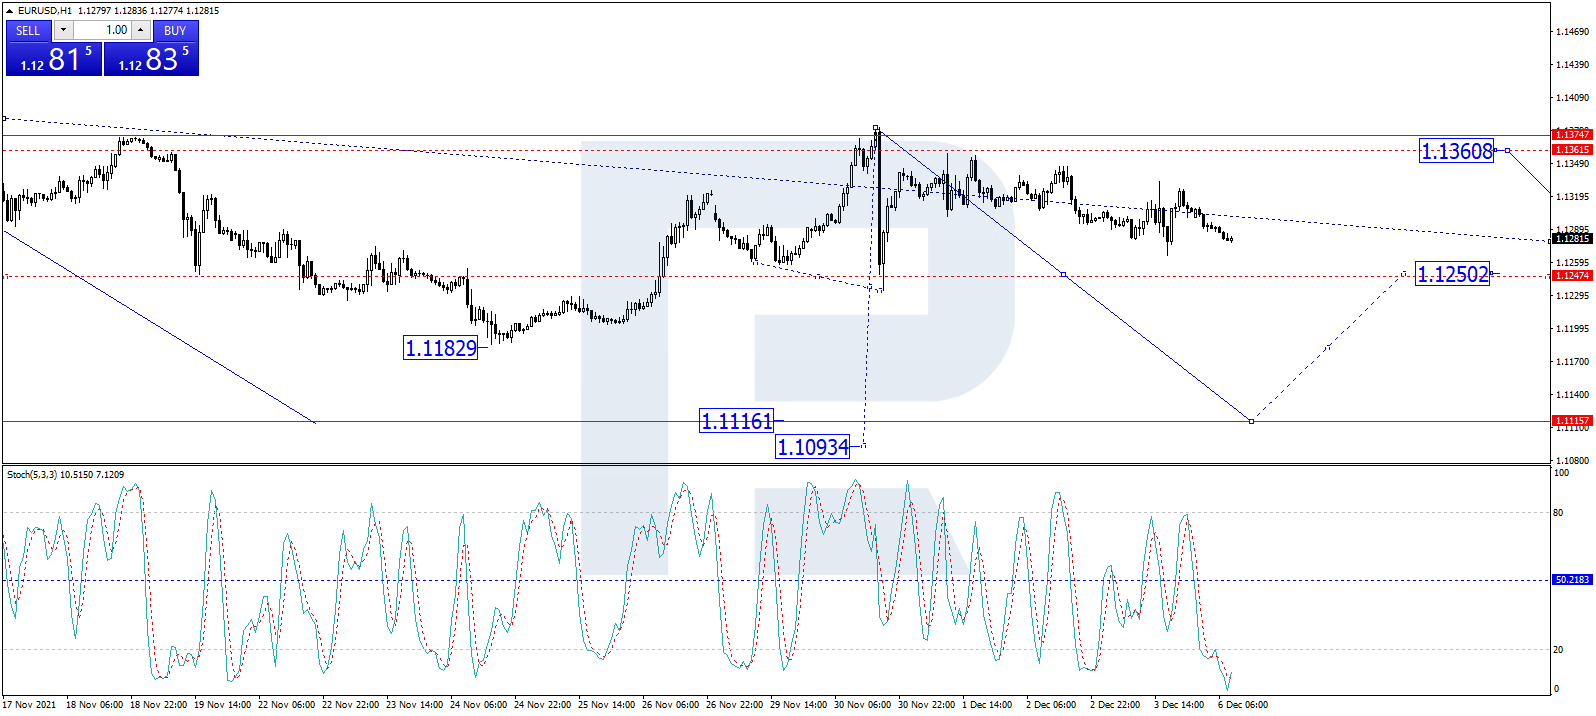
As we can see in the H1 chart, EUR/USD is forming the third descending wave; it has already completed the first wave at 1.1266 along with the correction towards 1.1326. At the moment, the asset is falling to reach 1.1250 and may later form a new consolidation range as a downside continuation pattern. If the price breaks the range to the downside, the market may resume falling with the short-term target at 1.1140 and then form one more descending structure to reach 1.1111. From the technical point of view, this idea is confirmed by the Stochastic Oscillator: its signal line is moving below 20, thus implying a furth
Disclaimer
Any forecasts contained herein are based on the author’s particular opinion. This analysis may not be treated as trading advice. RoboForex bears no responsibility for trading results based on trading recommendations and reviews contained herein.

- The Bank of Canada kept its interest rate unchanged. Platinum prices reached a three‑week high Jul 16, 2026
- Stock indices rose after the release of US inflation data. China’s GDP slowed sharply Jul 15, 2026
- GBP/USD Awaits Political News: What Will Happen Next Jul 15, 2026
- USD/JPY Holds at Highs: Pressure Lingers on Yen Jul 14, 2026
- Oil prices jumped 4% amid a new wave of escalation between the US and Iran Jul 13, 2026
- EUR/USD: US Inflation Will Determine Everything Jul 13, 2026
- COT Metals Charts: Weekly Speculator Bets see small gains for Silver & Gold Jul 12, 2026
- COT Bonds Charts: Speculator Bets led by SOFR 3-Months & 2-Year Bonds Jul 12, 2026
- COT Energy Charts: Weekly Speculator Changes led by Brent Oil Jul 12, 2026
- COT Soft Commodities Charts: Weekly Speculator Changes led by Sugar, Corn & Soybeans Jul 12, 2026