
By RoboForex Analytical Department
Early in the final April week, oil prices are declining; Brent has reached $103.40.
The key reason for this is a new coronavirus outbreak in Shanghai, China. Earlier, Shanghai authorities started slowly removing social restrictions – about 70% of the companies got back to their normal working routine. However, the population’s mobility is still very restricted because the rising tendency in the number of new cases returned last weekend. The Chinese lockdown limits the demand for fuel, thus having a serious impact on energy prices.
The influence of the lockdown in China on global oil prices is pretty strong but it’s early to assess how much time it might continue.
Last Friday’s report from Baker Hughes didn’t show anything positive. The Oil Rig Count in the US gained 1 unit, up to 549. At the same time, Canada’s indicator lost 1 unit. Market players can’t find signals that high energy prices boost the US shale industry, that’s why this aspect is moving to the back burner.
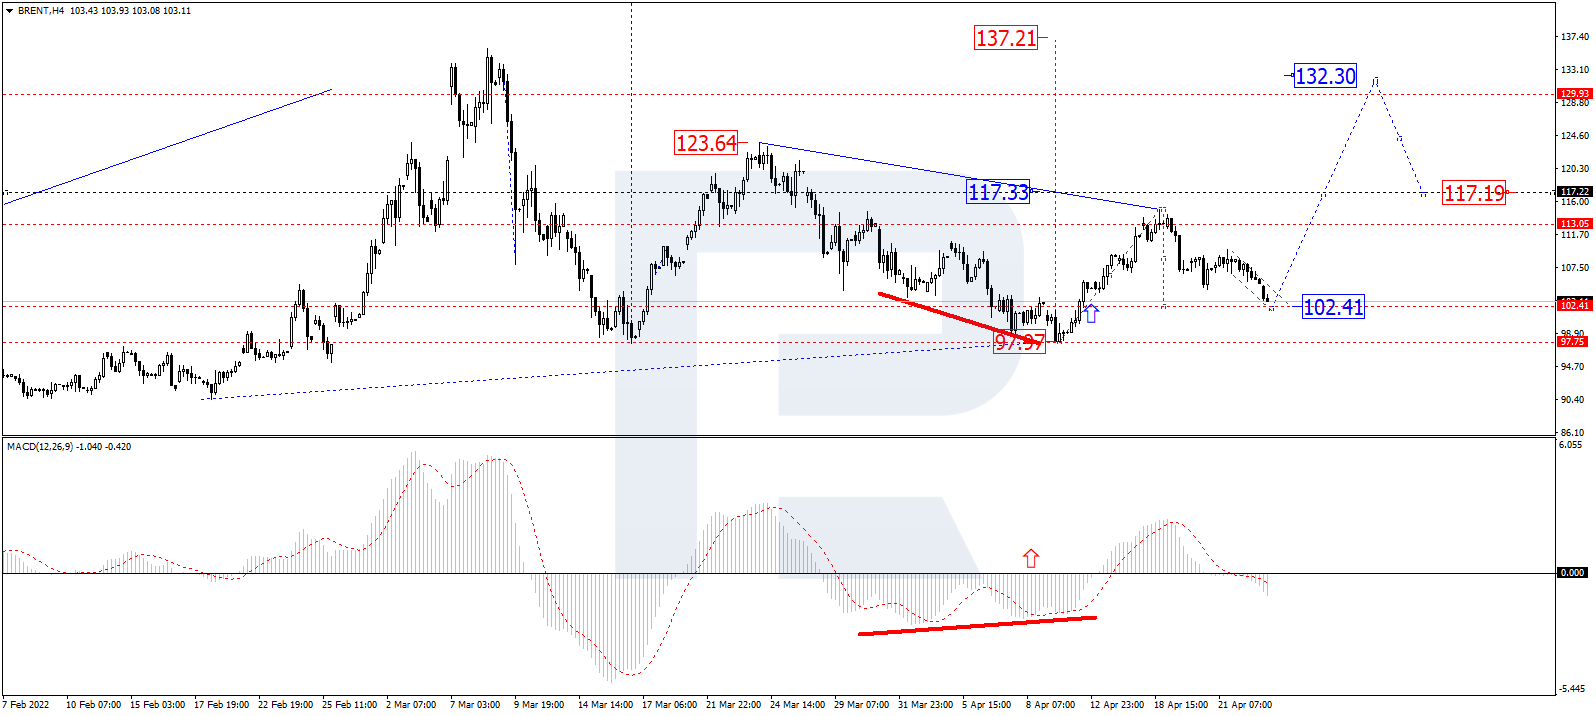
In the H4 chart, having completed the ascending impulse at 114.96, Brent is finishing the correction towards 102.40 and may later consolidate there. If the price breaks this range to the upside, the market may form one more ascending structure to break 117.22 and then continue moving within the uptrend with the short-term target at 132.30. From the technical point of view, this scenario is confirmed by MACD Oscillator: after breaking 0 to the downside, its signal line is falling within the histogram area, which means that the correction in the price chart may continue.
Free Reports:
 Get our Weekly Commitment of Traders Reports - See where the biggest traders (Hedge Funds and Commercial Hedgers) are positioned in the futures markets on a weekly basis.
 Sign Up for Our Stock Market Newsletter – Get updated on News, Charts & Rankings of Public Companies when you join our Stocks Newsletter
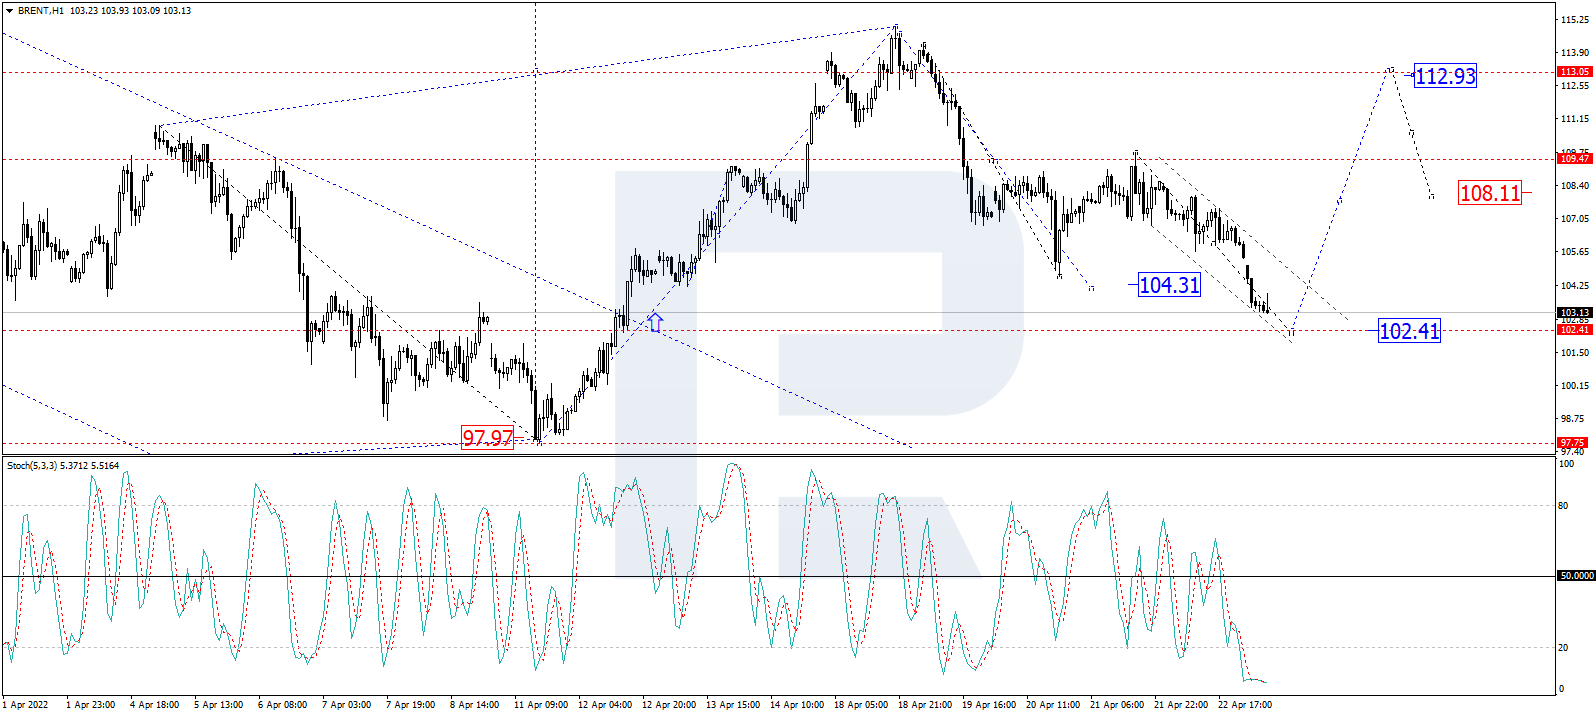
As we can see in the H1 chart, after reaching the correctional target at 104.30, Brent is expected to consolidate there. Later, the market may resume growing to break 114.80 and then continue trading upwards with the short-term target at 132.20. From the technical point of view, this idea is confirmed by the Stochastic Oscillator: its signal line is moving above 20 and may grow to break 50. After that, the line is expected to continue moving upwards and reach 80.
Disclaimer
Any forecasts contained herein are based on the author’s particular opinion. This analysis may not be treated as trading advice. RoboForex bears no responsibility for trading results based on trading recommendations and reviews contained herein.

- Oil prices jumped 4% amid a new wave of escalation between the US and Iran Jul 13, 2026
- EUR/USD: US Inflation Will Determine Everything Jul 13, 2026
- COT Metals Charts: Weekly Speculator Bets see small gains for Silver & Gold Jul 12, 2026
- COT Bonds Charts: Speculator Bets led by SOFR 3-Months & 2-Year Bonds Jul 12, 2026
- COT Energy Charts: Weekly Speculator Changes led by Brent Oil Jul 12, 2026
- COT Soft Commodities Charts: Weekly Speculator Changes led by Sugar, Corn & Soybeans Jul 12, 2026
- The US and European stock indices are rising again amid renewed investor interest in the AI industry. Jul 10, 2026
- USD/JPY Falls as Yen Recovers Weekly Losses Jul 10, 2026
- Crude oil prices surged sharply by 7% in reaction to the rapid escalation of the conflict in the Middle East Jul 9, 2026
- Middle East Tensions Weigh on Gold Jul 9, 2026