China’s escalating Covid crisis should prompt investors around the world to revise their portfolios as a matter of urgency to safeguard their wealth, warns the CEO and founder of one of the world’s largest independent financial advisory, asset management and fintech organizations.
The warning from deVere Group’s Nigel Green comes as authorities in Beijing have implemented mass testing in one area of the city following an outbreak of cases. There are concerns the capital could soon follow Shanghai – China’s most populous city and a key financial and trade hub – by enforcing a lockdown to contain the spread.
He comments: “As Covid continues to strengthen its grip on China, which is standing firm in its zero-tolerance policy, investors around the world need to ensure as a matter of urgency that their portfolios are best-positioned to mitigate the risks and fallout of the crisis there.
“The strict lockdowns in China have ramifications for the global economy. If they persist for this month alone, it could take an estimated 1% off the country’s economic growth for the year.
“The Chinese University of Hong Kong reports that said China’s lockdowns were expected to cost at least £35bn a month, or 3.1% of GDP in lost economic output and that full-scale lockdowns in major cities, such as Beijing or Shanghai, would slash the national real GDP by 4%.
“As the world’s second-largest economy, which has been one of the fastest-growing for the last few decades, this could have a dire ripple effect across the globe. There could be potentially considerable consequences for overseas trade, financial markets, and global economic growth.”
The deVere CEO continues: “China’s Covid crisis, and the so-far-failed attempts to halt it, also fuels red-hot global inflationary pressures by further disrupting supply chains in the ‘factory of the world’.
“Shanghai, as the world’s largest container port, is already snarled-up, and across the region there’s an estimated $22 trillion trade in global goods facing months of severe disruption.
“It’s likely that the tech and automotive industries will be hardest hit by the additional pressures on international supply chains.”
As the situation worsens in China, Nigel Green says that investors should review their portfolios “even if they had previously been adequately diversified across asset classes, sectors and regions.”
A properly diversified portfolio reduces overall risk because some asset classes will benefit regardless of what plays out. It’s almost universally regarded as an investor’s best weapon against any financial impact.
A good fund manager will help investors seek out the opportunities and mitigate potential risks as and when they are presented in order to build and protect their wealth.
“For instance, even with potential headwinds on the horizon for certain sectors such as tech, investors should be judicious. In short, other stocks might currently look more favorable, but does anyone suddenly seriously think Amazon, Microsoft, Apple and Tesla are not companies of the future also?”
He concludes: “I would urge investors, for their own peace of mind, to review their portfolios to ensure they’re on track amid growing concerns about the world’s second-biggest economy.”
About:
deVere Group is one of the world’s largest independent advisors of specialist global financial solutions to international, local mass affluent, and high-net-worth clients. It has a network of more than 70 offices across the world, over 80,000 clients and $12bn under advisement.
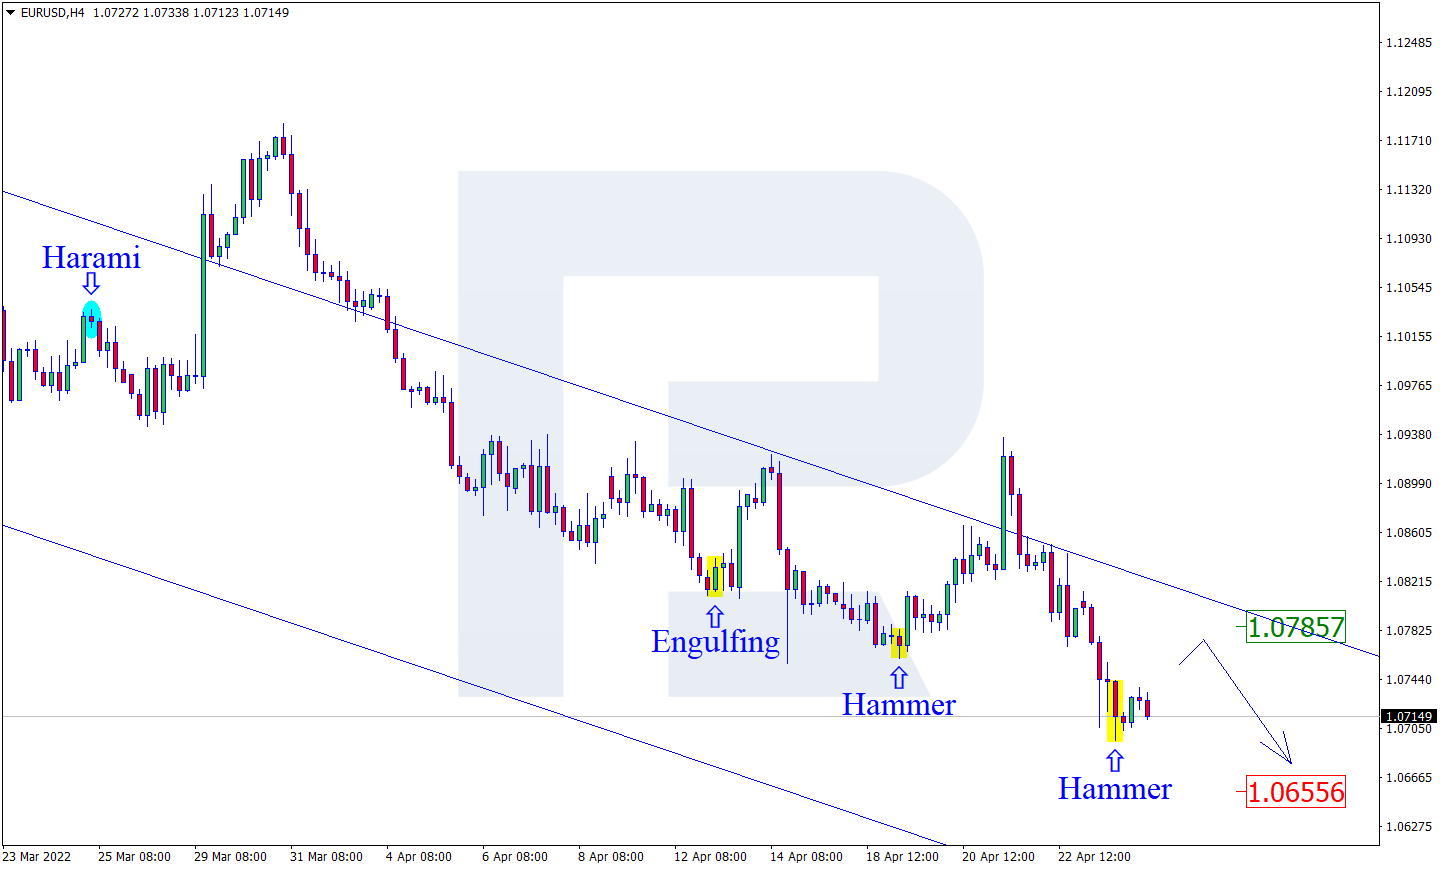
As we can see in the H4 chart, the asset has formed a Hammer reversal pattern close to the support area. At the moment, EURUSD is reversing in the form of a new correctional impulse. In this case, the upside correctional target may be at 1.0785. However, an alternative scenario implies that the price may fall to reach 1.0655 and continue the descending tendency without any corrections towards the resistance level.
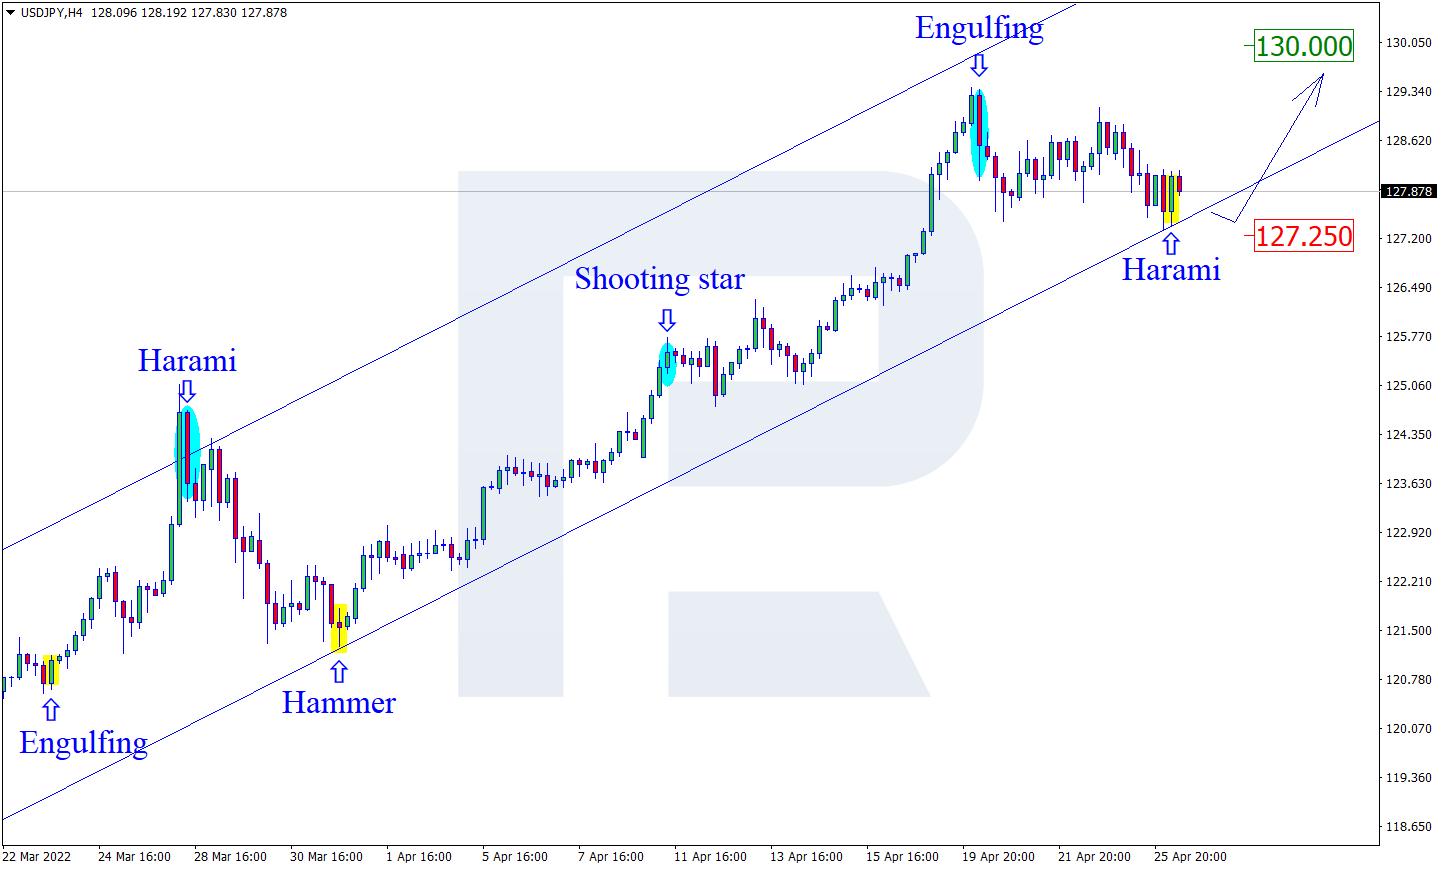
USDJPY, “US Dollar vs Japanese Yen”
As we can see in the H4 chart, USDJPY has formed a Harami pattern not far from the support level. At the moment, the asset is reversing in the form of a new rising impulse. In this case, the upside target may be at 130.00. At the same time, an opposite scenario implies that the price may correct to reach 127.25 first and then resume the uptrend.
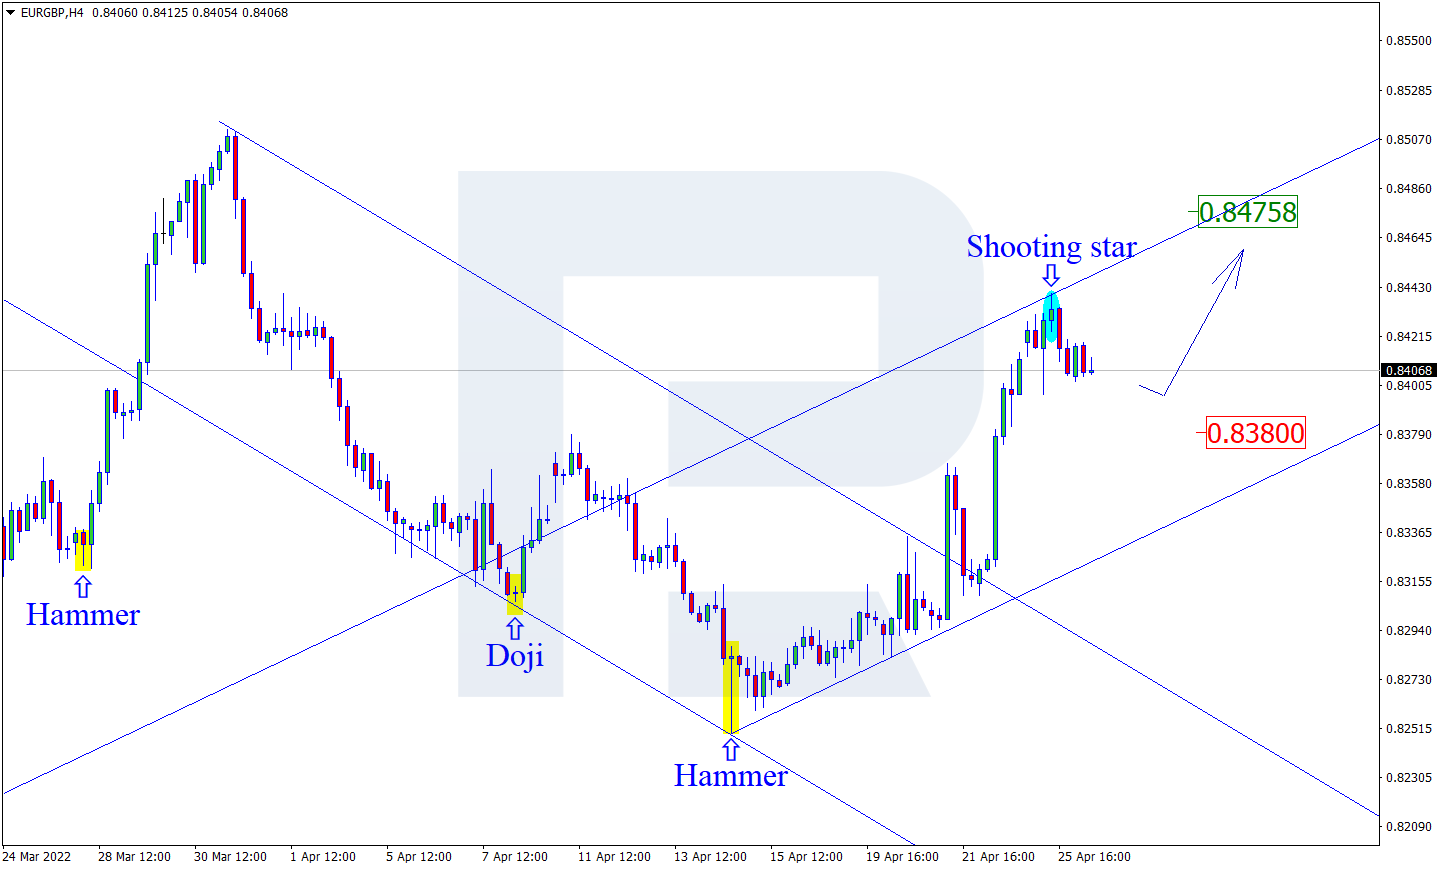
EURGBP, “Euro vs Great Britain Pound”
As we can see in the H4 chart, after forming a Shooting Star reversal pattern near the resistance area, EURGBP is reversing and correcting. In this case, the downside correctional target may be at 0.8380. Later, the market may test the support level, rebound from it, and resume the ascending impulse. Still, there might be an alternative scenario, according to which the asset may grow to reach 0.8475 and continue the uptrend without testing the support level.
Attention! Forecasts presented in this section only reflect the author’s private opinion and should not be considered as guidance for trading. RoboForex LP bears no responsibility for trading results based on trading recommendations described in these analytical reviews.
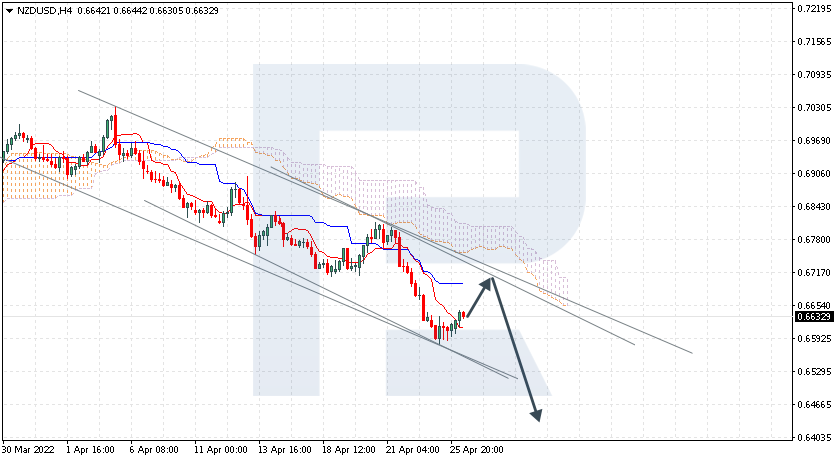
NZDUSD is still rebounding from Tenkan-Sen. The instrument is currently moving below Ichimoku Cloud, thus indicating a descending tendency. The markets could indicate that the price may test Kijun-Sen at 0.6665 and then resume moving downwards to reach 0.6450. Another signal in favour of a further downtrend will be a rebound from the descending channel’s upside border. However, the bearish scenario may no longer be valid if the price breaks the cloud’s upside border and fixes above 0.6845. In this case, the pair may continue growing towards 0.6935.
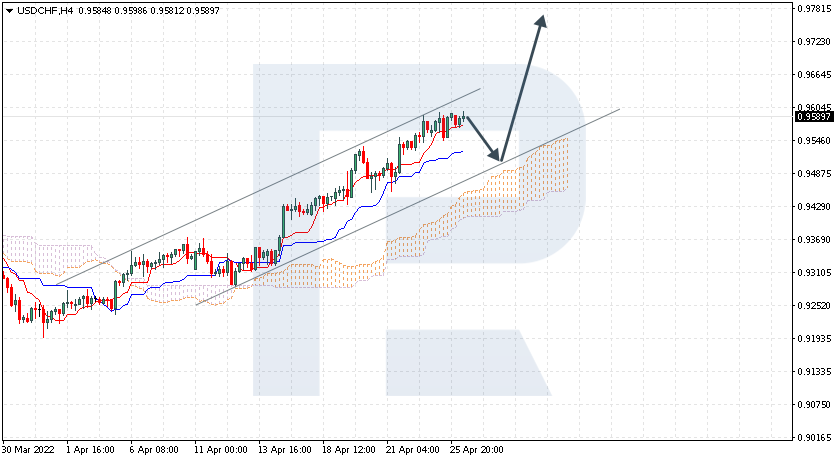
USDCHF, “US Dollar vs Swiss Franc”
USDCHF is rising within the bullish channel. In the daily chart, bulls have broken the high it reached early last year, so the next upside target is at 0.9900. The instrument is currently moving above Ichimoku Cloud, thus indicating an ascending tendency. The markets could indicate that the price may test the cloud’s upside border at 0.9490 and then resume moving upwards to reach 0.9785. Another signal in favour of a further uptrend will be a rebound from the rising channel’s downside border. However, the bullish scenario may no longer be valid if the price breaks the cloud’s downside border and fixes below 0.9375. In this case, the pair may continue falling towards 0.9285.
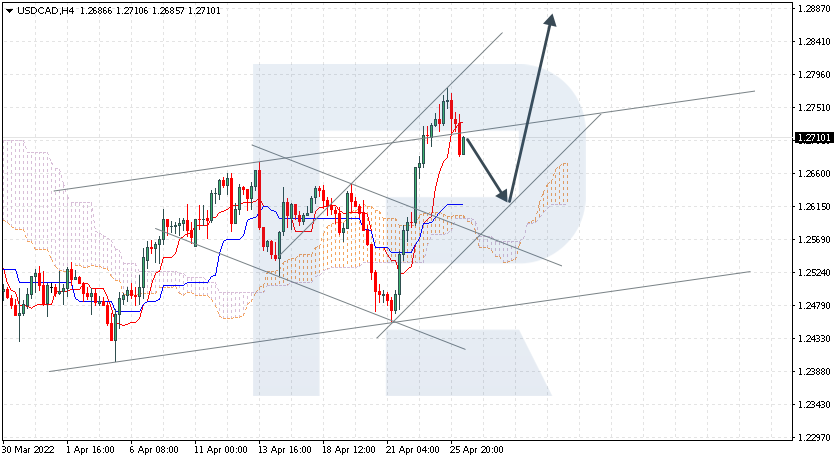
USDCAD, “US Dollar vs Canadian Dollar”
USDCAD is testing the bullish channel’s upside border. Bulls have been able to fix the price above the resistance at 1.2670, so they can continue pushing it up to 1.2900. The instrument is currently moving above Ichimoku Cloud, thus indicating an ascending tendency. The markets could indicate that the price may test Kijun-Sen at 1.2620 and then resume moving upwards to reach 1.2885. Another signal in favour of a further uptrend will be a rebound from the rising channel’s downside border. However, the bullish scenario may no longer be valid if the price breaks the cloud’s downside border and fixes below 1.2520. In this case, the pair may continue falling towards 1.2415. To confirm a further uptrend, the price must break the descending channel’s upside border and fix above 1.2795 – bulls’ previous attempt to break it failed.
Attention! Forecasts presented in this section only reflect the author’s private opinion and should not be considered as guidance for trading. RoboForex LP bears no responsibility for trading results based on trading recommendations described in these analytical reviews.
Last week, hawkish comments from various politicians increased the risks of aggressive policy tightening by global central banks. Analysts expect the US Federal Reserve to raise interest rates by half a point at its next three meetings and the European Central Bank to raise interest rates by 25 basis points in July.
From the technical point of view, the trend on the EUR/USD currency pair on the hourly time frame is bearish. Growth in the dollar index led to the fall of the European currency. The MACD indicator has become negative, the selling pressure remains, but the price has reached the support level. Under such market conditions, it is possible to look for buy trades on intraday timeframes from the support level of 1.0699, but only with short targets and confirmation. Sell trades should be considered from the resistance level of 1.0770, but only after the additional confirmation.
Alternative scenario: if the price breaks out through the 1.0936 resistance level and fixes above, the uptrend will likely resume.
News feed for 2022.04.26:
– US Core Durable Goods Orders (m/m) at 15:30 (GMT+2);
– US New Home Sales (m/m) at 17:00 (GMT+2);
– US CB Consumer Confidence (m/m) at 17:00 (GMT+2).
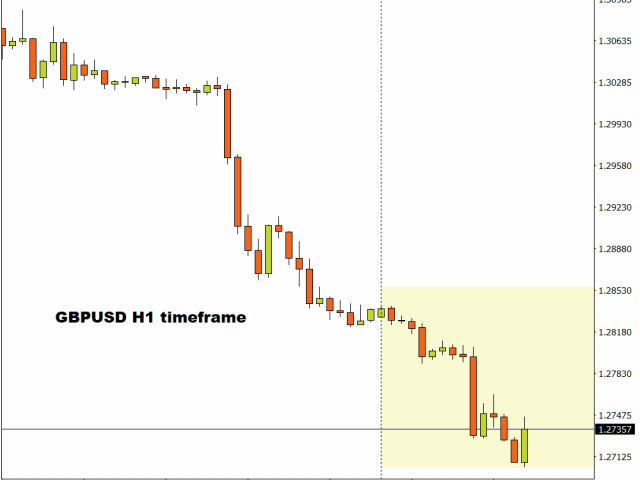
The GBP/USD currency pair
Technical indicators of the currency pair:
Prev Open: 1.2830
Prev Close: 1.2741
% chg. over the last day: -0.69%
The UK economy faces rising commodity prices and declining exports, leading to lower profits for British corporations. The Bank of England must find a middle ground to counter inflation and not put the economy into stagflation. As a result, the fundamental background for the British pound is extremely contradictory. On the one hand, the probability of a stagflation scenario puts pressure on the national rate. On the other hand, the Bank of England has already raised the interest rate three times and plans to tighten monetary policy in the future, which will positively affect the pound.
On the hourly time frame, the GBP/USD currency pair trend is still bearish. The MACD indicator is in the negative zone, but there are the first signs of sellers’ weakness in the form of divergence. Under such market conditions, sell trades should be looked for from the resistance level 1.2792 or 1.2863, but with confirmation. For buy deals, traders may consider the level of 1.2719, but only after the appearance of a bullish initiative and with short targets.
Alternative scenario: if the price breaks down through the 1.3083 resistance level and fixes above, the mid-term uptrend will likely be resumed.
There is no news feed for today.
The USD/JPY currency pair
Technical indicators of the currency pair:
Prev Open: 128.53
Prev Close: 128.12
% chg. over the last day: -0.32%
The monetary policy of the Bank of Japan remains unchanged. The central bank uses an ultra-soft approach to push the inflation rate closer to the 2% target. The Bank of Japan will hold its next monetary policy meeting this week, but analysts do not expect changes. Thus, fundamentally, USD/JPY quotes tend to rise as the Fed tightens monetary policy, which leads to a rise in the dollar index. But traders should not forget that the Bank of Japan will enter the debt market and sell government bonds to prevent a significant depreciation of the yen in a short period of time. Therefore, a correction might occur soon.
Trading recommendations
Support levels: 126.69, 125.48, 124.66, 122.97
Resistance levels: 129.36
The medium-term trend on the USD/JPY currency pair is bullish. The MACD indicator has become negative. The price has taken a more flat structure. Under such market conditions, it is best to look for buy deals, expecting the continuation of the uptrend, but after the price makes a pullback to the nearest support levels. First of all, it is worth considering the support level of 126.69, but with additional confirmation. A resistance level of 129.36 may be considered for sell deals, but only with short targets.
Alternative scenario: If the price fixes below 125.55, the uptrend will likely be broken.
News feed for 2022.04.26:
– Japan Unemployment Rate (m/m) at 02:30 (GMT+2).
The USD/CAD currency pair
Technical indicators of the currency pair:
Prev Open: 1.2711
Prev Close: 1.2735
% chg. over the last day: +0.20%
The Canadian dollar is a commodity currency, highly dependent on oil price dynamics and the dollar index. The dollar index continued to rise yesterday, while oil prices finished the day at the opening level. As a result, the USD/CAD currency pair traded particularly unchanged. Fundamentally, there are currently no prerequisites for a medium-term trend in USD/CAD.
Trading recommendations
Support levels: 1.2644, 1.2607, 1.2521
Resistance levels: 1.2776, 1.2849
In terms of technical analysis, the USD/CAD currency pair is bullish. Buying pressure has decreased, but the MACD indicator remains positive. Trade is worth it only with short targets. Under such market conditions, it is better to look for buy trades on the lower timeframes from the support level of 1.2644 or 1.2607, but it is better with additional confirmation. For sell deals, it is better to consider the resistance level of 1.2776, but it is also better with confirmation and short targets.
Alternative scenario: if the price breaks through and consolidates below 1.2521, the downtrend will likely be resumed.
This article reflects a personal opinion and should not be interpreted as an investment advice, and/or offer, and/or a persistent request for carrying out financial transactions, and/or a guarantee, and/or a forecast of future events.
Despite concerns about a slowdown in the global economy, US indices increased on Monday as investors are optimistic ahead of a crucial week of the quarterly results of major tech companies. Large tech companies caused a broader market reversal, driven by Alphabet and Microsoft’s gains ahead of today’s quarterly earnings. At the stock market’s close, the Dow Jones Index (US30) added 0.71%, and the S&P 500 Index (US500) increased by 0.58%. The NASDAQ Technology Index (US100) jumped by 1.29% yesterday. But despite the rebound, some Wall Street analysts say there are more declines ahead as the selling conditions are not yet at an extreme level.
Elon Musk buys Twitter. The company confirmed that it had reached an agreement for Musk to buy a share for $54.20 in cash under a deal worth about $44 billion.
Major European indices traded lower yesterday. Germany’s DAX (DE30) fell by 1.54%, France’s CAC 40 (FR 40) lost 2.01%, Spain’s IBEX 35 (ES35) decreased by 0.90%, and Britain’s FTSE 100 (UK100) lost 1.88%. Natural gas shortages caused the first phase of the global energy crisis in Europe; now, according to analysts, the coal crisis is coming. In Germany and Italy, coal-fired power plants that were once decommissioned are already being considered for a second life.
Oil fell to its lowest level in two weeks amid growing concerns about the prospects for global energy demand due to long-term quarantine measures in Shanghai. The prospect of slowing economic growth this year amid higher interest rates in the US has already led to a downward revision of oil demand forecasts. The longer the war in Ukraine last and restrictions persist in China, the greater the risk that demand growth will be even weaker. Analysts of Eurasia Group consulting company stated this.
Gold continues to decline, although yields on 10-year US Treasury bonds are falling for the third day in a row. As a rule, these instruments have an inverse correlation. But it should be noted that gold also depends on the dollar index. The rising dollar index negatively affects precious metals.
Asian markets traded lower yesterday. Japan’s Nikkei 225 (JP225) decreased by 1.90%, Hong Kong’s Hang Seng (HK50) fell by 3.73%, and Australia’s S&P/ASX 200 (AU200) ended the day down by 0.08%. With the start of the third month of the war in Ukraine and growing fears about the COVID-19 outbreak in China, which caused Chinese stocks to collapse, investors are getting rid of currencies such as the Australian dollar and the Chinese yuan.
Main market quotes:
S&P 500 (F) (US500) 4,296.43 +24.65 (+0.58%)
Dow Jones (US30) 34,052.03 +240.63 (+0.71%)
DAX (DE40) 13,924.17 −217.92 (−1.54%)
FTSE 100 (UK100) 7,380.54 −141.14 (−1.88%)
USD Index 101.71 +0.49 (+0.48%)
Important events for today:
– Japan Unemployment Rate (m/m) at 02:30 (GMT+2);
– US Core Durable Goods Orders (m/m) at 15:30 (GMT+2);
– US New Home Sales (m/m) at 17:00 (GMT+2);
– US CB Consumer Confidence (m/m) at 17:00 (GMT+2).
This article reflects a personal opinion and should not be interpreted as an investment advice, and/or offer, and/or a persistent request for carrying out financial transactions, and/or a guarantee, and/or a forecast of future events.
Asian markets were wrapped in caution on Tuesday as investors nursed the nasty hangover from the previous day’s rout as fears over the impact of China’s new lockdowns lingered in the air.
Overnight, Wall Street was thrown a lifeline later in the session after Twitter agreed to be bought by billionaire Elon Musk. In the currency space, the mighty dollar climbed to its highest level since March 2020 thanks to risk aversion and expectations over the Fed raising rates by 50 basis points next month. There was no love for gold despite the risk-off mood, with the precious metal securing a daily close below $1900, while oil tumbled below $100 amid worries about the global energy demand outlook.
Caution is likely to remain the name of the game this week with sentiment fragile as strict lockdowns in China, concerns around a global slowdown, Fed rate hike fears and geopolitical risks leave investors on edge. On the data front, there are a couple of key economic data releases from major economies, especially in the United States. Tech titans will be publishing their earnings this week with Microsoft and Google’s parent company Alphabet announcing their results on Tuesday after the market close. With so much going on, this promises to be another eventful and potentially volatile week for financial markets. Yesterday’s wild movements across the FX, commodity and equity space are testament to this.
The dollar kicked off the week by appreciating against almost every single G10 currency as concerns over the economic impact of China’s strict lockdown sent investors rushing towards safety.
Market expectations over the Federal Reserve aggressively raising interest rates also empowered dollar bulls, propelling the dollar index (DXY) to a fresh two-year high. There are several key economic data points over the next few days which are likely to inject the currency with renewed vigour. US consumer confidence, Q1 GDP, and the PCE deflator will all be published, ahead of the key FOMC meeting next week. Should the data further reinforce market expectations over the Fed aggressively raising interest rates, the dollar could be set to appreciate further.
Oil benchmarks wobbled below $100 this morning after experiencing a sharp selloff in the previous session, due to fears that lockdowns in China will hit energy demand in the world’s second largest economy. On top of this, an appreciating dollar is adding extra pressure on the global commodity with Brent shedding roughly 1.5% this month. That said, geopolitical risks may limit downside losses, especially if the United States and its allies consider expanding sanctions on Russian oil imports.
On the data front, it may be wise to keep a close eye on the Energy Information Administration (EIA) report published on Wednesday. Another weekly drawdown in crude inventories could lend oil bulls a helping hand.
After trading within a range for many weeks, gold finally experienced a solid breakdown below $1920 support with bears securing a daily close beneath the psychological $1900 level. The precious metal struggled to shine against a mighty dollar and aggressive Fed rate hike bets. With the greenback on a tear and potentially receiving further support in the week ahead, this could spell more trouble for gold despite the market caution and risk aversion.
Looking at the technical picture, sustained weakness below $1920 could signal a decline towards $1880 and $1850. Should $1900 prove to be reliable support, prices could retest $1920. A move back above this level will send prices into the prior range with the first level of resistance at $1960.
Disclaimer: The content in this article comprises personal opinions and should not be construed as containing personal and/or other investment advice and/or an offer of and/or solicitation for any transactions in financial instruments and/or a guarantee and/or prediction of future performance. ForexTime (FXTM), its affiliates, agents, directors, officers or employees do not guarantee the accuracy, validity, timeliness or completeness, of any information or data made available and assume no liability as to any loss arising from any investment based on the same.
Sterling hijacked our attention last Friday after collapsing like a house of cards!
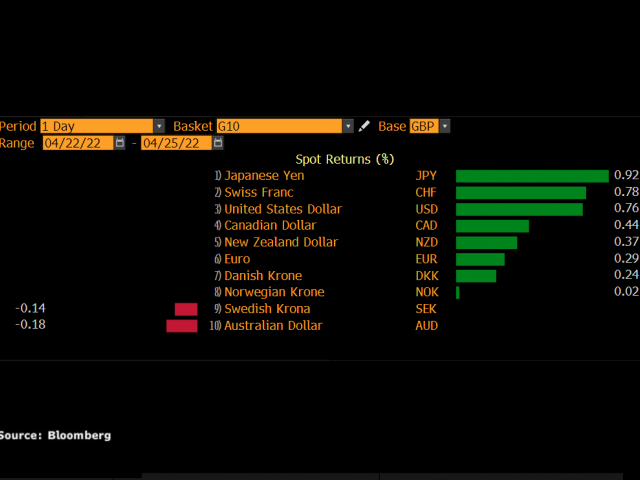
It has stumbled into the new week under renewed pressure, struggling to nurse deep wounds inflicted by the dismal retail sales and consumer confidence data. Mounting concerns over the cost-of-living crisis dragging the UK economy into a recession continue to hammer the pound, which is currently trading at levels not seen since September 2020. Disappointing economic data may fuel speculation over the BoE slowing interest rate rises while political noise from Westminster regarding the post-Brexit trade deal is likely to compound the currency’s woes. Since the start of April, sterling has weakened against most G10 currencies, shedding over 3% versus the dollar of writing.
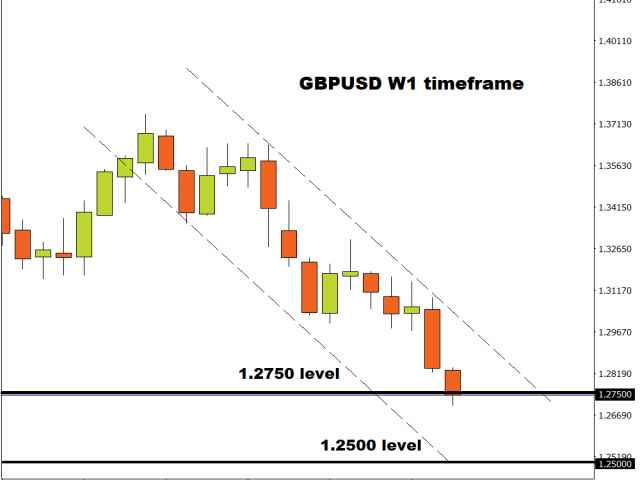
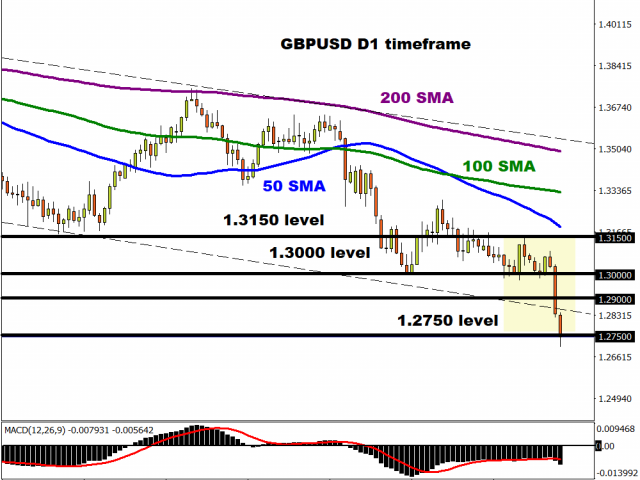
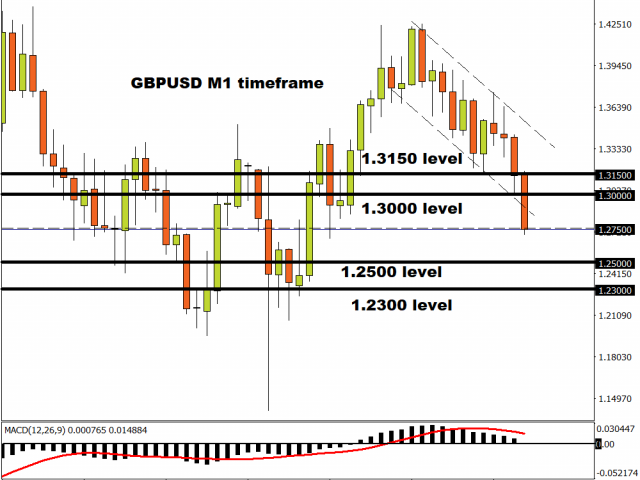
Taking a quick peek at the technicals, prices look heavily bearish on the weekly timeframe with support at 1.2750. A solid breakdown below this point could drag the GBPUSD to levels not seen since mid-2020 around 1.2500.
More pain on the horizon for sterling?
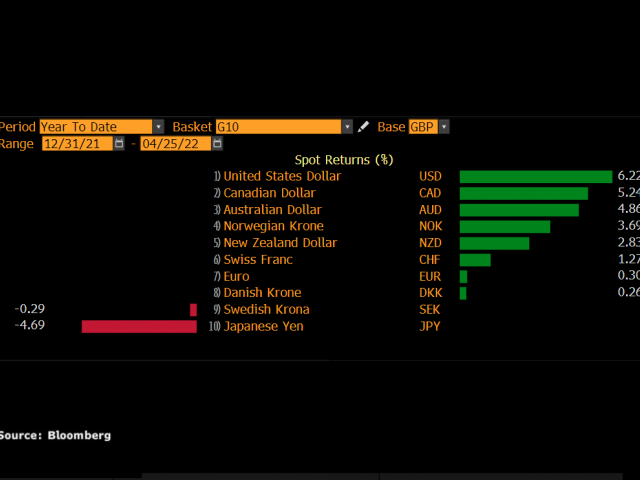
Since the start of 2022, the pound has weakened against almost every single G10 currency. It’s is down over 6% versus the dollar and more than 5% against the Canadian dollar.
The pound has the potential to weaken further if disappointing economic data forces the Bank of England to adopt a cautious approach towards rate hikes. In fact, Andrew Bailey, BoE governor recently hinted that the UK interest rates may be increased less aggressively amid recession fears.
Indeed, retail sales fell by an unexpected 1.4% in March as the rising cost of living hit consumer spending. Consumer confidence plunged to its lowest level since the 2008 recession while PMIs decline in April, signalling that the economy is slowing considerably. But with inflation hitting a 30 year high of 7% which is more than triple the target of 2%, the BoE is certainly in a tricky position.
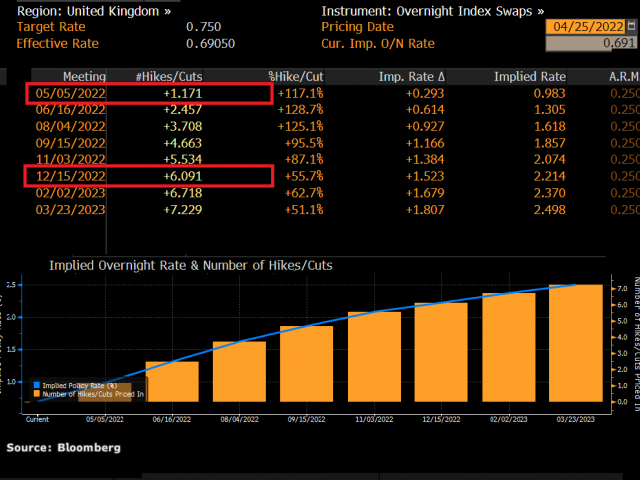
The central bank is widely expected to raise interest rates by 0.25bp in May, with a total of 6 hikes expected by the end of 2022.
However, repeatedly weak economic data and post-Brexit related uncertainty could throw a spanner in the works for BoE hawks – resulting in a weaker pound. This weakness is likely to be intensified by an increasingly aggressive and hawkish U.S Federal Reserve.
The week ahead…
It’s a relatively quiet week on the UK economic calendar. However, this does not mean it will be a quiet week for the British pound.
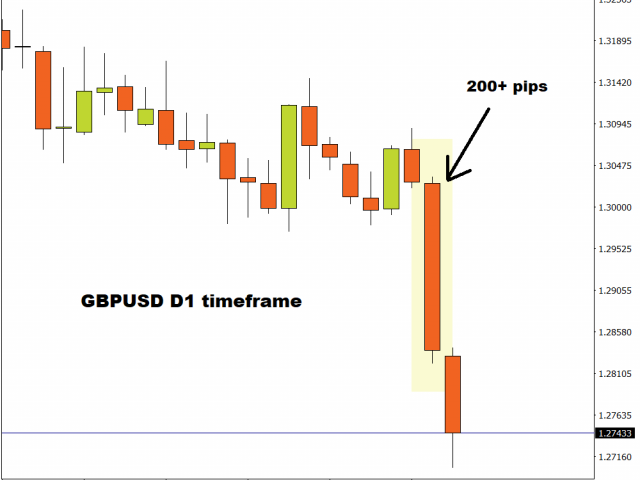
The GBPUSD has already dropped over 100 pips this morning, with weakness being seeing across the board.
There is a lot going on with the dollar with key economic data likely to inject the currency with renewed vigour. Over the next few days, US consumer confidence data, Q1 GDP, consumer sentiment and the PCE deflator among other key reports will be published. Should they reinforce market expectations over the Federal Reserve aggressively raising interest rates, the dollar is set to appreciate further – dragging the GBPUSD lower.
GBPUSD bears step into higher gear
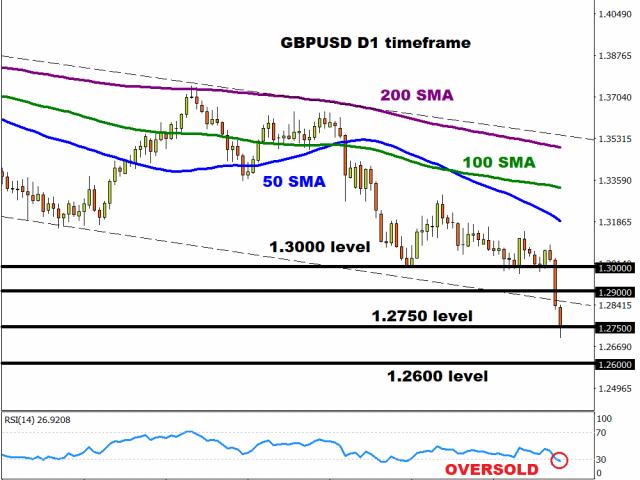
The GBPUSD is heavily bearish on the daily timeframe as there have been consistently lower lows and lower highs. Prices are trading well below the 50, 100 and 200-day Simple Moving Average while the MACD trades below zero. Interestingly, the RSI has fallen below 30 which suggests that the GBPUSD could be oversold.
A solid daily close below the 1.2750 support level could see the currency pair sink towards 1.2600 before experiencing a technical bounce. Alternatively, should 1.2750 prove to be reliable support, the GBPUSD could rebound back towards 1.2900 before resuming the downtrend.
On the monthly timeframe, the GBPUSD is respecting a monthly bearish trend. A solid monthly close below 1.2750 could open the doors towards 1.2500 and 1.2300. If bears run out of steam, a move towards 1.3000 and 1.3150, respectively.
Disclaimer: The content in this article comprises personal opinions and should not be construed as containing personal and/or other investment advice and/or an offer of and/or solicitation for any transactions in financial instruments and/or a guarantee and/or prediction of future performance. ForexTime (FXTM), its affiliates, agents, directors, officers or employees do not guarantee the accuracy, validity, timeliness or completeness, of any information or data made available and assume no liability as to any loss arising from any investment based on the same.
Even during times of conflict on the ground, space has historically been an arena of collaboration among nations. But trends in the past decade suggest that the nature of cooperation in space is shifting, and fallout from Russia’s invasion of Ukraine has highlighted these changes.
But I believe that the future may be different. In the past few years, groups of nations with similar strategic interests on Earth have come together to further their interests in space, forming what I call “space blocs.”
The International Space Station is the quintessential example of international collaboration in space. NASA via WikimediaCommons
In 1975, 10 European nations founded the European Space Agency. In 1998 the U.S. and Russia joined efforts to build the International Space Station, which is now supported by 15 countries.
These multinational ventures were primarily focused on scientific collaboration and data exchange.
The emergence of space blocs
The European Space Agency, which now includes 22 nations, could be considered among the first space blocs. But a more pronounced shift toward this type of power structure can be seen after the end of the Cold War. Countries that shared interests on the ground began coming together to pursue specific mission objectives in space, forming space blocs.
These groups allow for nations to collaborate closely with others in their blocs, but the blocs also compete with one another. Two recent space blocs – the Artemis Accords and the Sino-Russian lunar agreement – are an example of such competition.
No human has been on the Moon in 50 years, but in the next decade, both the U.S.-led Artemis Accords and a Chinese-Russian mission aim to establish Moon bases. NASA/Neil Armstrong via WikimediaCommons
Race to the Moon
The Artemis Accords were launched in October 2020. They are led by the U.S. and currently include 18 country members. The group’s goal is to return people to the Moon by 2025 and establish a governing framework for exploring and mining on the Moon, Mars and beyond. The mission aims to build a research station on the south pole of the Moon with a supporting lunar space station called the Gateway.
Similarly, in 2019, Russia and China agreed to collaborate on a mission to send people to the south pole of the Moon by 2026. This joint Sino-Russian mission also aims to eventually build a Moon base and place a space station in lunar orbit.
That these blocs do not collaborate to accomplish similar missions on the Moon indicates that strategic interests and rivalries on the ground have been transposed to space.
Similarly, Russia and China plan to open their future lunar research station to all interested parties, but no Artemis country has expressed interest. The European Space Agency has even discontinued several joint projects it had planned with Russia and is instead expanding its partnerships with the U.S. and Japan.
The impact of space blocs on the ground
In addition to seeking power in space, countries are also using space blocs to strengthen their spheres of influence on the ground.
While its broad goal is the development and launch of satellites, the organization’s major aim is to expand and normalize the use of the Chinese BeiDou navigation system – the Chinese version of GPS. Countries that use the system could become dependent on China, as is the case of Iran.
The role of private space companies
There has been tremendous growth of commercial activities in space in the past decade. As a result, some scholars see a future of space cooperation defined by shared commercial interests. In this scenario, commercial entities act as intermediaries between states, uniting them behind specific commercial projects in space.
The dominance of states over companies in space affairs has been starkly exemplified through the Ukraine crisis. As a result of state-imposed sanctions, many commercial space companies have stopped collaborating with Russia.
Given the current legal framework, it seems most likely that states – not commercial entities – will continue to dictate the rules in space.
Space blocs for collaboration or conflict
I believe that going forward, state formations – such as space blocs – will serve as the major means through which states further their national interests in space and on the ground. There are many benefits when nations come together and form space blocs. Space is hard, so pooling resources, manpower and know-how makes sense. However, such a system also comes with inherent dangers.
History offers many examples showing that the more rigid alliances become, the more likely conflict is to ensue. The growing rigidity of two alliances – the Triple Entente and the Triple Alliance – at the end of 19th century is often cited as the key trigger of World War I.
A key lesson therein is that as long as existing space blocs remain flexible and open to all, cooperation will flourish and the world may yet avoid an open conflict in space. Maintaining the focus on scientific goals and exchanges between and within space blocs – while keeping political rivalries at bay – will help to ensure the future of international cooperation in space.
America’s electric power system is undergoing radical change as it transitions from fossil fuels to renewable energy. While the first decade of the 2000s saw huge growth in natural gas generation, and the 2010s were the decade of wind and solar, early signs suggest the innovation of the 2020s may be a boom in “hybrid” power plants.
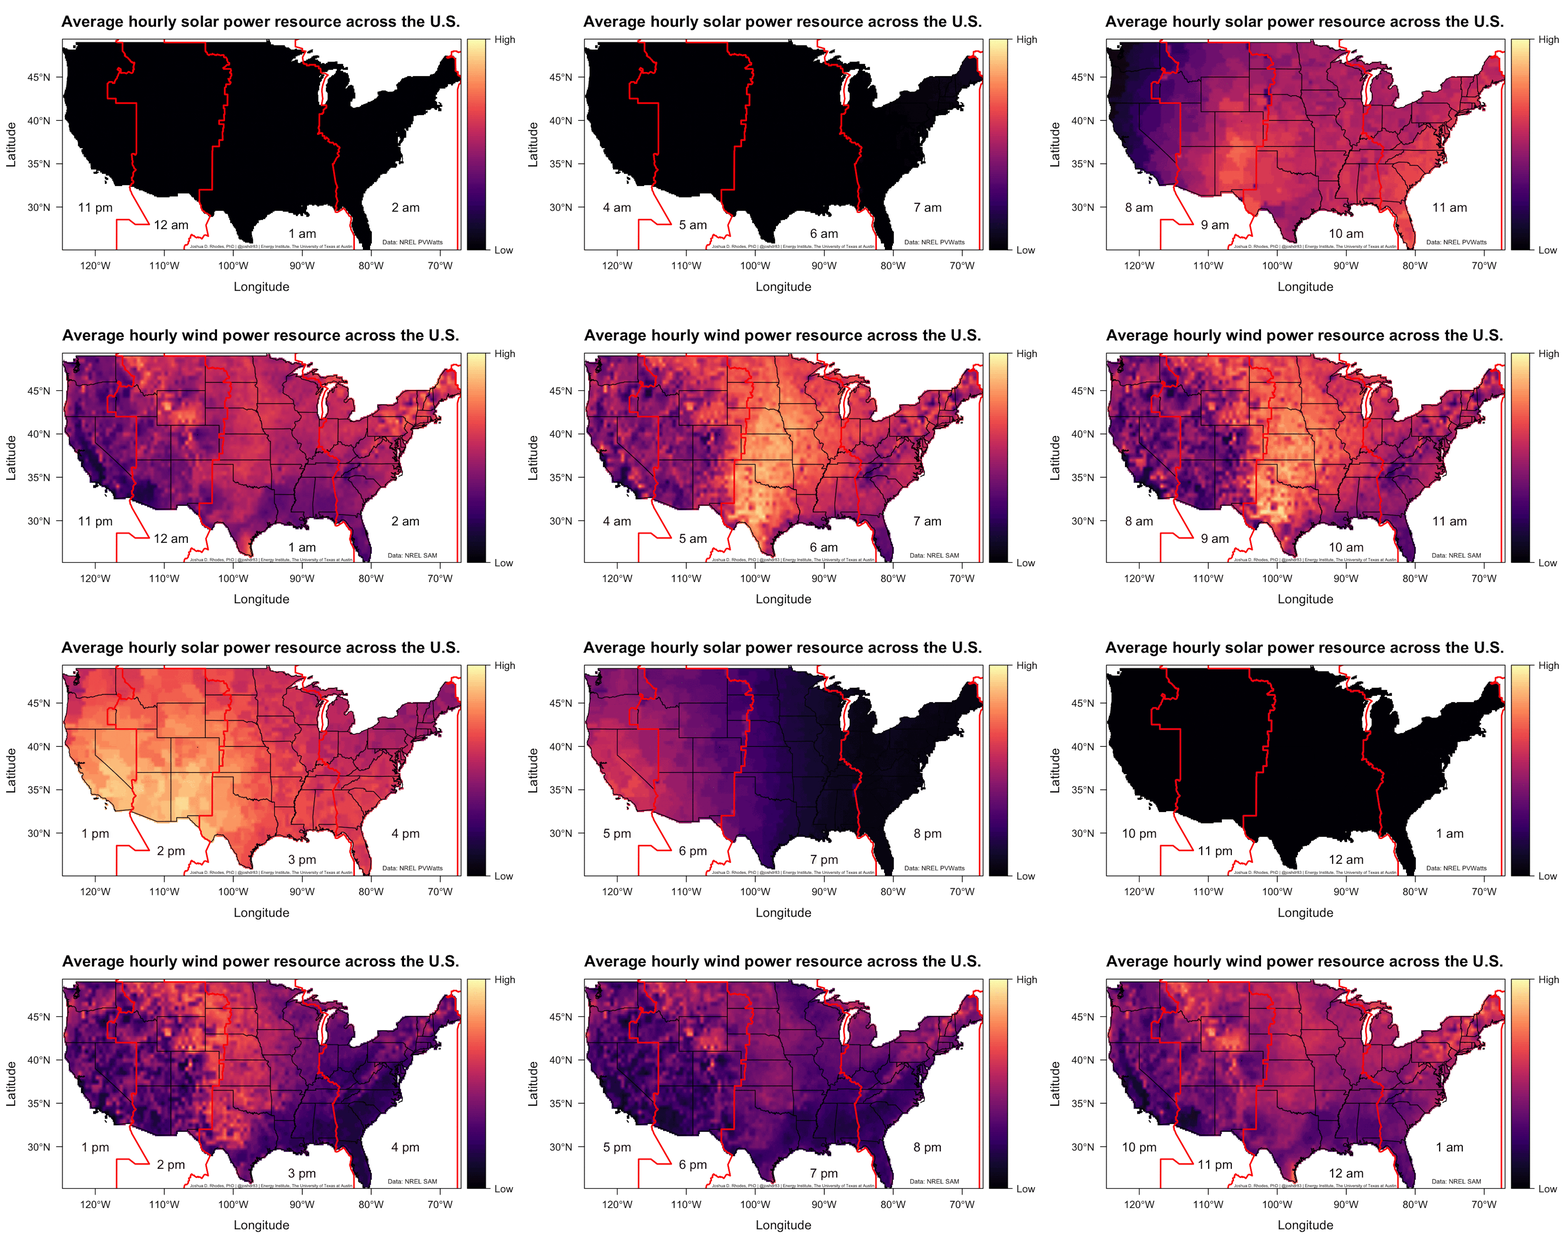
A typical hybrid power plant combines electricity generation with battery storage at the same location. That often means a solar or wind farm paired with large-scale batteries. Working together, solar panels and battery storage can generate renewable power when solar energy is at its peak during the day and then release it as needed after the sun goes down.
A look at the power and storage projects in the development pipeline offers a glimpse of hybrid power’s future.
Our team at Lawrence Berkeley National Laboratory found that a staggering 1,400 gigawatts of proposed generation and storage projects have applied to connect to the grid – more than all existing U.S. power plants combined. A third of these projects involve hybrid solar plus storage plants.
While these power plants of the future offer many benefits, they also raise questions about how the electric grid should best be operated.
Why hybrids are hot
As wind and solar grow, they are starting to have big impacts on the grid.
Solar power already exceeds 25% of annual power generation in California and is spreading rapidly in other states such as Texas, Florida and Georgia. The “wind belt” states, from the Dakotas to Texas, have seen massive deployment of wind turbines, with Iowa now getting a majority of its power from the wind.
This high percentage of renewable power raises a question: How do we integrate renewable sources that produce large but varying amounts of power throughout the day?
Joshua Rhodes/University of Texas at Austin.
That’s where storage comes in. Lithium-ion battery prices have rapidly fallen as production has scaled up for the electric vehicle market in recent years. While there are concerns about future supply chain challenges, battery design is also likely to evolve.
The combination of solar and batteries allows hybrid plant operators to provide power through the most valuable hours when demand is strongest, such as summer afternoons and evenings when air conditioners are running on high. Batteries also help smooth out production from wind and solar power, store excess power that would otherwise be curtailed, and reduce congestion on the grid.
Hybrids dominate the project pipeline
At the end of 2020, there were 73 solar and 16 wind hybrid projects operating in the U.S., amounting to 2.5 gigawatts of generation and 0.45 gigawatts of storage.
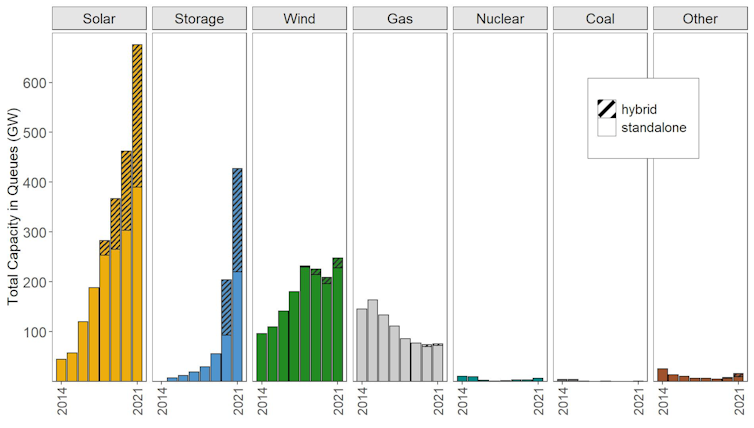
Today, solar and hybrids dominate the development pipeline. By the end of 2021, more than 675 gigawatts of proposed solar plants had applied for grid connection approval, with over a third of them paired with storage. Another 247 gigawatts of wind farms were in line, with 19 gigawatts, or about 8% of those, as hybrids.
The amount of proposed solar, storage and wind power waiting to hook up to the grid has grown dramatically in recent years, while coal, gas and nuclear have faded. Lawrence Berkeley National Laboratory
Of course, applying for a connection is only one step in developing a power plant. A developer also needs land and community agreements, a sales contract, financing and permits. Only about one in four new plants proposed between 2010 and 2016 made it to commercial operation. But the depth of interest in hybrid plants portends strong growth.
In markets like California, batteries are essentially obligatory for new solar developers. Since solar often accounts for the majority of power in the daytime market, building more adds little value. Currently 95% of all proposed large-scale solar capacity in the California queue comes with batteries.
5 lessons on hybrids and questions for the future
The opportunity for growth in renewable hybrids is clearly large, but it raises some questions that our group at Berkeley Lab has been investigating.
The investment pays off in many regions. We found that while adding batteries to a solar power plant increases the price, it also increases the value of the power. Putting generation and storage in the same location can capture benefits from tax credits, construction cost savings and operational flexibility. Looking at the revenue potential over recent years, and with the help of federal tax credits, the added value appears to justify the higher price.
Co-location also means tradeoffs. Wind and solar perform best where the wind and solar resources are strongest, but batteries provide the most value where they can deliver the greatest grid benefits, like relieving congestion. That means there are trade-offs when determining the best location with the highest value. Federal tax credits that can be earned only when batteries are co-located with solar may be encouraging suboptimal decisions in some cases.
Hybrid power has become standard in Hawaii as solar power saturates the grid. Dennis Schroeder/NREL
There is no one best combination. The value of a hybrid plant is determined in part by the configuration of the equipment. For example, the size of the battery relative to a solar generator can determine how late into the evening the plant can deliver power. But the value of nighttime power depends on local market conditions, which change throughout the year.
Power market rules need to evolve. Hybrids can participate in the power market as a single unit or as separate entities, with the solar and storage bidding independently. Hybrids can also be either sellers or buyers of power, or both. That can get complicated. Market participation rules for hybrids are still evolving, leaving plant operators to experiment with how they sell their services.
Small hybrids create new opportunities: Hybrid power plants can also be small, such as solar and batteries in a home or business. Such hybrids have become standard in Hawaii as solar power saturates the grid. In California, customers who are subject to power shutoffs to prevent wildfires are increasingly adding storage to their solar systems. These “behind-the-meter” hybrids raise questions about how they should be valued, and how they can contribute to grid operations.
Hybrids are just beginning, but a lot more are on the way. More research is needed on the technologies, market designs and regulations to ensure the grid and grid pricing evolve with them.
While questions remain, it’s clear that hybrids are redefining power plants. And they may remake the U.S. power system in the process.
Emmanuel Macron’s historic win in the French elections will be met by only a modest relief rally amid heightening geopolitical and economic issues, warns the CEO of one of the world’s largest independent financial advisory, asset management and fintech organizations.
The warning from Nigel Green of deVere Group follows the re-election of Macron to a second term as French president on Sunday evening with 58.8% of the vote, according to an estimate from the Ipsos polling institute. His far-right challenger Marine Le Pen won 41.2% of the vote in an election.
He comments: “Markets have been spared the shock and uncertainty that would have sent them into a tail-spin should Le Pen have won, as she would have put France on a very different course.
“European markets and the euro are likely to experience a relief rally on Macron’s re-election and his pro-business, pro-Europe agenda.
“But this could be short-lived, especially as his win was largely already priced-in by the markets.
“As the news sinks in, attention will move to other pressing geopolitical matters that will weigh on global markets.
“Investors will focus on the worsening Covid situation in China, the world’s second-largest economy. The Asian powerhouse is facing its worst Covid outbreak since the start of the pandemic in late 2019, as it locked down major cities like Shanghai.
“Surprisingly, the People’s Bank (PBOC) recently rejected the opportunity to lower its policy rates today – despite the sharp economic downturn and recent calls from Beijing for monetary support.”
Nigel Green continues: “Other triggers for low market sentiment include ongoing red-hot inflation, interest rate hike expectations from most key central banks, and the continuing global uncertainty created by the Russian-Ukrainian war.”
Against such a turbulent background, the markets will breathe a collective sigh of relief – albeit briefly – with the likely outcome of the presidential elections in France.
“The election is of major importance beyond France’s border and the outcome has international implications. The country is the second-biggest economy in the European Union, the only one with a UN Security Council veto, and its sole nuclear power,” says Nigel Green.
“In addition, as the new German Chancellor is facing increasing scrutiny over the handling of the Russian-Ukraine war, amongst other issues, Macron is arguably the most powerful leader in Europe currently.”
“As he can’t run again so his legacy will be set in the next five years and his agenda will likely be bolder.”
He concludes: “Markets have avoided the upset of a Le Pen win, but investors must not become complacent. There remain major global headwinds that could negatively impact returns. That said, volatility always brings enhanced investment opportunities.
“Investors should review their portfolios sooner rather than later to ensure they remain on track to reach their long-term financial goals.”
About:
deVere Group is one of the world’s largest independent advisors of specialist global financial solutions to international, local mass affluent, and high-net-worth clients. It has a network of more than 70 offices across the world, over 80,000 clients and $12bn under advisement.








 Article by