COT Week 25 Charts: Bond Market Speculator bets rose this week led by 5-Year & 2-Year Bonds

By InvestMacro | COT | Data Tables | COT Leaders | Downloads | COT Newsletter
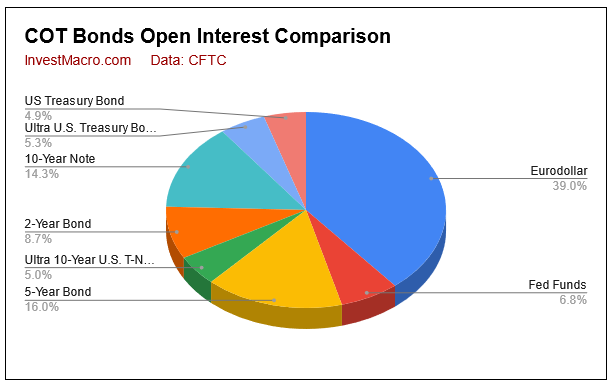
bonds-oi open interest analysis comparison futures

Here are the latest charts and statistics for the Commitment of Traders (COT) data published by the Commodities Futures Trading Commission (CFTC).

The latest COT data is updated through Tuesday June 21st and shows a quick view of how large traders (for-profit speculators and commercial entities) were positioned in the futures markets.

COT bond market speculator bets were overall higher this week as five out of the eight bond markets we cover had higher positioning this week while three markets had lower contracts.

Leading the gains for the bond markets was the 5-Year Bond (86,980 contracts) and the 2-Year Bond (41,139 contracts) with the Ultra 10-Year Bond (17,501 contracts), Fed Funds (13,490 contracts) and the Long US Bond (10,078 contracts) also showing higher speculator bets for the week. Meanwhile, leading the declines in speculator bets this week were the Eurodollar (-143,197 contracts) and the 10-Year Bond (-22,655 contracts) with the Ultra US Bond (-3,455 contracts) also seeing lower speculator bets on the week.
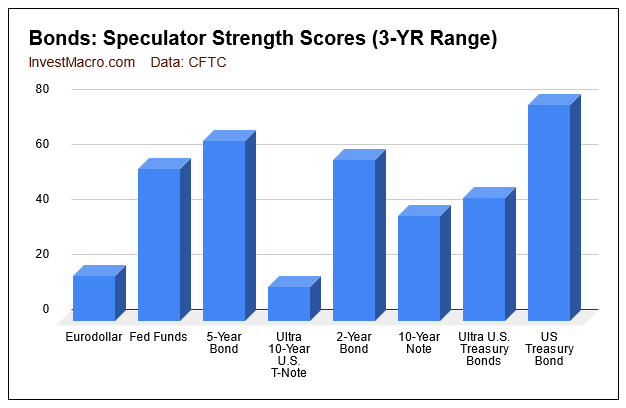

Strength scores (3-Year range of Speculator positions, from 0 to 100 where above 80 is extreme bullish and below 20 is extreme bearish) show that the US Treasury Bond (78.3 percent) is at the highest level of the bonds markets currently with the 5-Year Bond (65 percent), 2-Year Bond (58.2 percent), and Fed Funds (55 percent) following. The Ultra 10-Year Bonds (12.2 percent) and 3-Month Eurodollars (16.2 percent) continue to remain in bearish-extreme levels and have the weakest speculator strength scores at the moment.
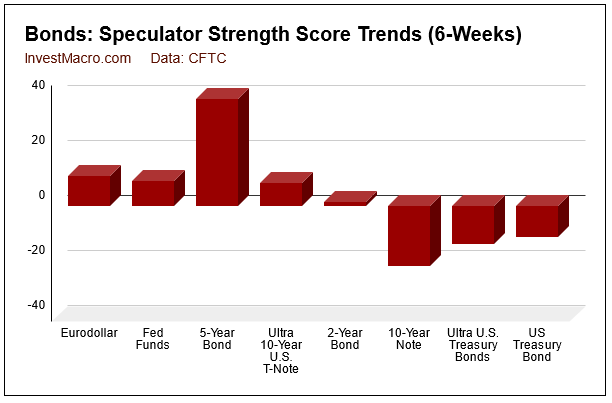
Strength score trends (or move index, that calculate 6-week changes in strength scores) shows that the 5-Year Bond (38.9 percent) continues to lead the strength trends. Next up is Eurodollars (11.1 percent) and then Fed Funds with a 9.3 percent strength change over the past six weeks. The 10-Year Bonds (-21.6 percent) leads the falling speculator trends over the past six weeks followed by the Ultra US Treasury Bonds (-13.7 percent) and then the US Treasury Bond (-11.3 percent).


Data Snapshot of Bond Market Traders | Columns Legend
Jun-21-2022OIOI-IndexSpec-NetSpec-IndexCom-NetCOM-IndexSmalls-NetSmalls-Index
Eurodollar9,411,17311-1,997,889162,355,14383-357,25426
FedFunds1,646,30350124,42155-125,477451,05662
2-Year2,086,91713-119,28358205,59965-86,31613
Long T-Bond1,177,79145-19,3227837,92126-18,59938
10-Year3,440,08525-228,18438404,75470-176,57038
5-Year3,854,22843-104,09165289,49349-185,40230


3-Month Eurodollars Futures:

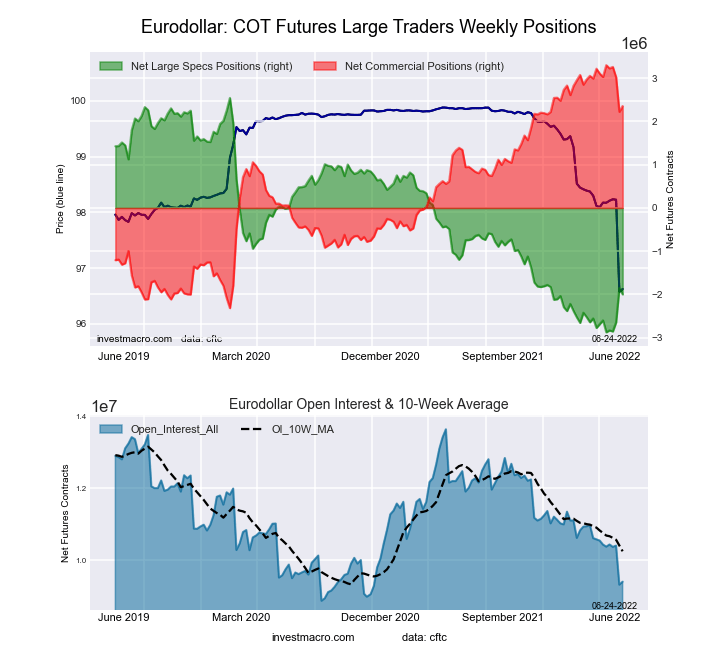
Eurodollar Bonds Futures COT ChartThe 3-Month Eurodollars large speculator standing this week was a net position of -1,997,889 contracts in the data reported through Tuesday. This was a weekly reduction of -143,197 contracts from the previous week which had a total of -1,854,692 net contracts.

This week’s current strength score (the trader positioning range over the past three years, measured from 0 to 100) shows the speculators are currently Bearish-Extreme with a score of 16.2 percent. The commercials are Bullish-Extreme with a score of 83.2 percent and the small traders (not shown in chart) are Bearish with a score of 25.8 percent.

3-Month Eurodollars StatisticsSPECULATORSCOMMERCIALSSMALL TRADERS
– Percent of Open Interest Longs:6.569.64.3
– Percent of Open Interest Shorts:27.844.68.1
– Net Position:-1,997,8892,355,143-357,254
– Gross Longs:614,9346,554,406400,504
– Gross Shorts:2,612,8234,199,263757,758
– Long to Short Ratio:0.2 to 11.6 to 10.5 to 1
NET POSITION TREND:
– Strength Index Score (3 Year Range Pct):16.283.225.8
– Strength Index Reading (3 Year Range):Bearish-ExtremeBullish-ExtremeBearish
NET POSITION MOVEMENT INDEX:
– 6-Week Change in Strength Index:11.1-12.016.0


30-Day Federal Funds Futures:

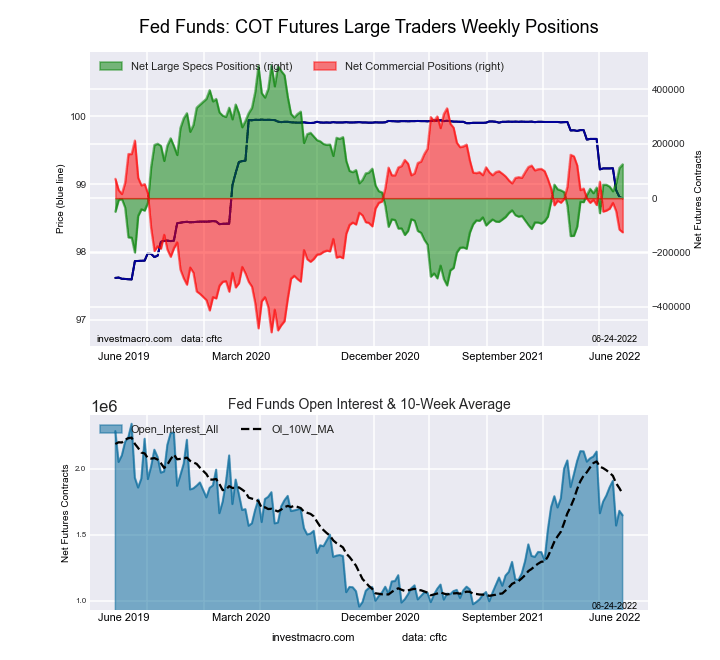
Federal Funds 30-Day Bonds Futures COT ChartThe 30-Day Federal Funds large speculator standing this week was a net position of 124,421 contracts in the data reported through Tuesday. This was a weekly advance of 13,490 contracts from the previous week which had a total of 110,931 net contracts.

This week’s current strength score (the trader positioning range over the past three years, measured from 0 to 100) shows the speculators are currently Bullish with a score of 55.0 percent. The commercials are Bearish with a score of 44.7 percent and the small traders (not shown in chart) are Bullish with a score of 62.4 percent.

30-Day Federal Funds StatisticsSPECULATORSCOMMERCIALSSMALL TRADERS
– Percent of Open Interest Longs:14.170.02.6
– Percent of Open Interest Shorts:6.577.62.6
– Net Position:124,421-125,4771,056
– Gross Longs:231,3441,151,99743,549
– Gross Shorts:106,9231,277,47442,493
– Long to Short Ratio:2.2 to 10.9 to 11.0 to 1
NET POSITION TREND:
– Strength Index Score (3 Year Range Pct):55.044.762.4
– Strength Index Reading (3 Year Range):BullishBearishBullish
NET POSITION MOVEMENT INDEX:
– 6-Week Change in Strength Index:9.3-9.32.4


2-Year Treasury Note Futures:

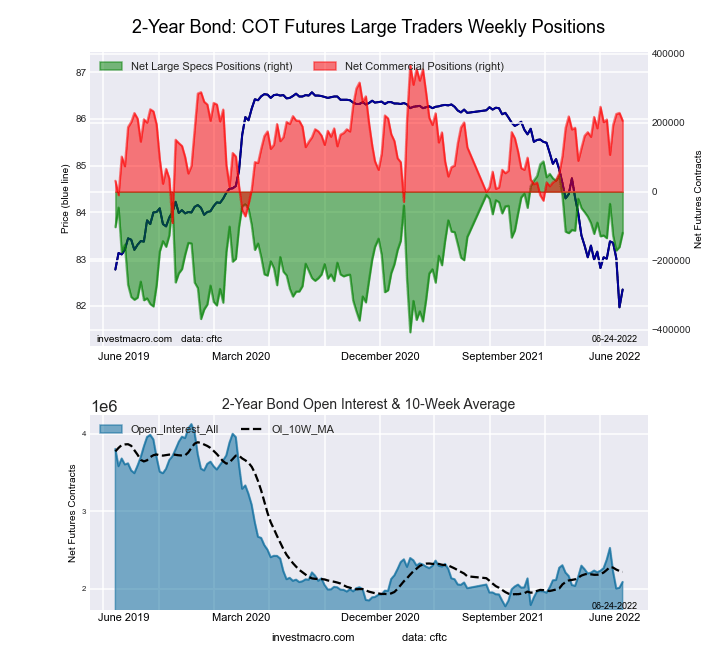
2-Year Treasury Bonds Futures COT ChartThe 2-Year Treasury Note large speculator standing this week was a net position of -119,283 contracts in the data reported through Tuesday. This was a weekly gain of 41,139 contracts from the previous week which had a total of -160,422 net contracts.

This week’s current strength score (the trader positioning range over the past three years, measured from 0 to 100) shows the speculators are currently Bullish with a score of 58.2 percent. The commercials are Bullish with a score of 64.8 percent and the small traders (not shown in chart) are Bearish-Extreme with a score of 12.6 percent.

2-Year Treasury Note StatisticsSPECULATORSCOMMERCIALSSMALL TRADERS
– Percent of Open Interest Longs:12.376.86.4
– Percent of Open Interest Shorts:18.067.010.6
– Net Position:-119,283205,599-86,316
– Gross Longs:257,3751,603,236134,031
– Gross Shorts:376,6581,397,637220,347
– Long to Short Ratio:0.7 to 11.1 to 10.6 to 1
NET POSITION TREND:
– Strength Index Score (3 Year Range Pct):58.264.812.6
– Strength Index Reading (3 Year Range):BullishBullishBearish-Extreme
NET POSITION MOVEMENT INDEX:
– 6-Week Change in Strength Index:1.50.9-4.8


5-Year Treasury Note Futures:

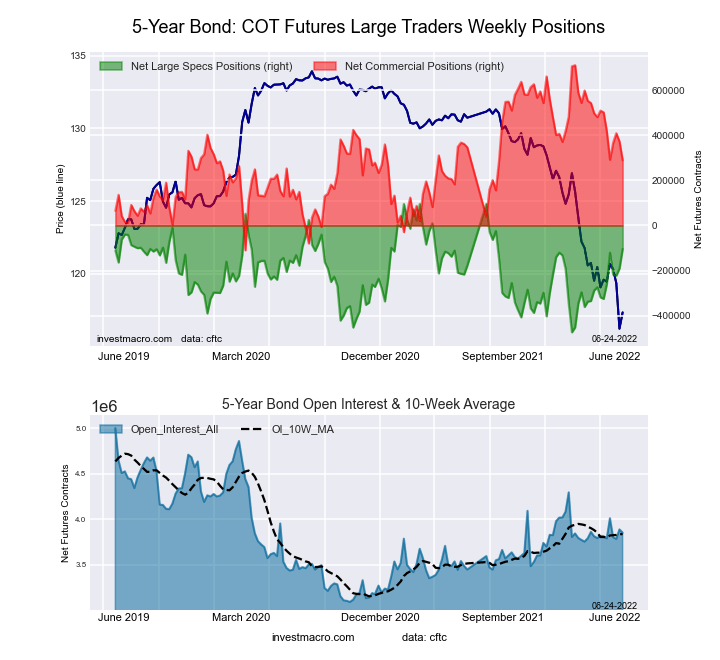
5-Year Treasury Bonds Futures COT ChartThe 5-Year Treasury Note large speculator standing this week was a net position of -104,091 contracts in the data reported through Tuesday. This was a weekly lift of 86,980 contracts from the previous week which had a total of -191,071 net contracts.

This week’s current strength score (the trader positioning range over the past three years, measured from 0 to 100) shows the speculators are currently Bullish with a score of 65.0 percent. The commercials are Bearish with a score of 48.6 percent and the small traders (not shown in chart) are Bearish with a score of 30.1 percent.

5-Year Treasury Note StatisticsSPECULATORSCOMMERCIALSSMALL TRADERS
– Percent of Open Interest Longs:9.780.97.6
– Percent of Open Interest Shorts:12.473.412.4
– Net Position:-104,091289,493-185,402
– Gross Longs:373,8073,119,594292,913
– Gross Shorts:477,8982,830,101478,315
– Long to Short Ratio:0.8 to 11.1 to 10.6 to 1
NET POSITION TREND:
– Strength Index Score (3 Year Range Pct):65.048.630.1
– Strength Index Reading (3 Year Range):BullishBearishBearish
NET POSITION MOVEMENT INDEX:
– 6-Week Change in Strength Index:38.9-25.9-2.4


10-Year Treasury Note Futures:

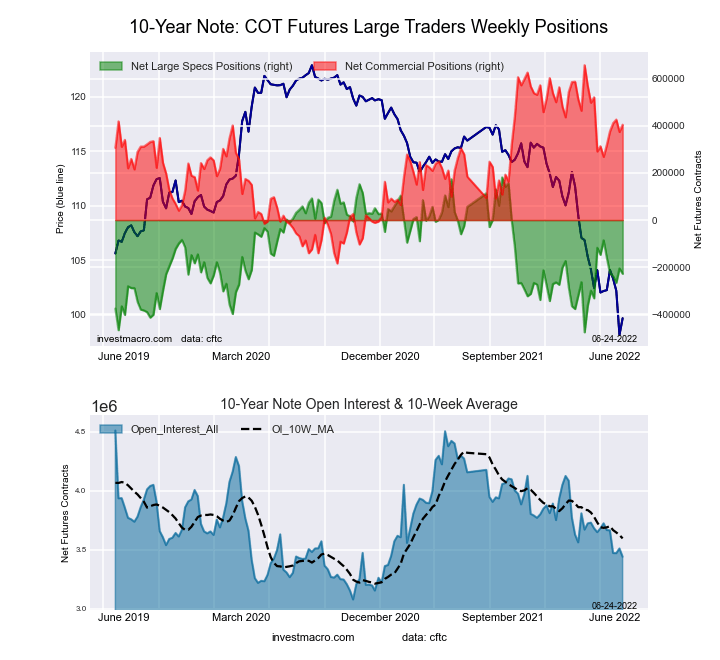
10-Year Treasury Notes Bonds Futures COT ChartThe 10-Year Treasury Note large speculator standing this week was a net position of -228,184 contracts in the data reported through Tuesday. This was a weekly fall of -22,655 contracts from the previous week which had a total of -205,529 net contracts.

This week’s current strength score (the trader positioning range over the past three years, measured from 0 to 100) shows the speculators are currently Bearish with a score of 37.8 percent. The commercials are Bullish with a score of 70.0 percent and the small traders (not shown in chart) are Bearish with a score of 37.9 percent.

10-Year Treasury Note StatisticsSPECULATORSCOMMERCIALSSMALL TRADERS
– Percent of Open Interest Longs:7.880.38.4
– Percent of Open Interest Shorts:14.568.513.5
– Net Position:-228,184404,754-176,570
– Gross Longs:269,6852,760,756287,654
– Gross Shorts:497,8692,356,002464,224
– Long to Short Ratio:0.5 to 11.2 to 10.6 to 1
NET POSITION TREND:
– Strength Index Score (3 Year Range Pct):37.870.037.9
– Strength Index Reading (3 Year Range):BearishBullishBearish
NET POSITION MOVEMENT INDEX:
– 6-Week Change in Strength Index:-21.616.21.4


Ultra 10-Year Notes Futures:

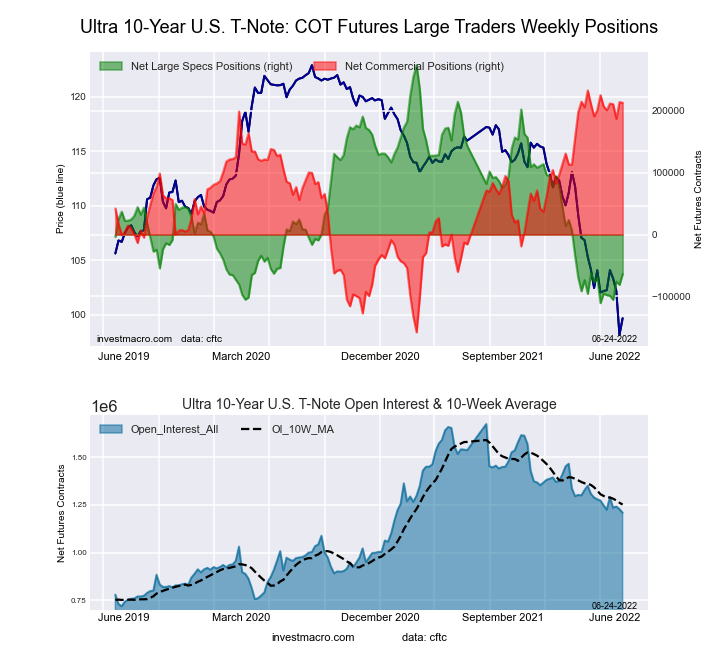
Ultra 10-Year Treasury Notes Bonds Futures COT ChartThe Ultra 10-Year Notes large speculator standing this week was a net position of -63,706 contracts in the data reported through Tuesday. This was a weekly boost of 17,501 contracts from the previous week which had a total of -81,207 net contracts.

This week’s current strength score (the trader positioning range over the past three years, measured from 0 to 100) shows the speculators are currently Bearish-Extreme with a score of 12.2 percent. The commercials are Bullish-Extreme with a score of 94.9 percent and the small traders (not shown in chart) are Bearish with a score of 26.5 percent.

Ultra 10-Year Notes StatisticsSPECULATORSCOMMERCIALSSMALL TRADERS
– Percent of Open Interest Longs:4.685.68.9
– Percent of Open Interest Shorts:9.868.021.2
– Net Position:-63,706212,999-149,293
– Gross Longs:55,0611,035,003107,499
– Gross Shorts:118,767822,004256,792
– Long to Short Ratio:0.5 to 11.3 to 10.4 to 1
NET POSITION TREND:
– Strength Index Score (3 Year Range Pct):12.294.926.5
– Strength Index Reading (3 Year Range):Bearish-ExtremeBullish-ExtremeBearish
NET POSITION MOVEMENT INDEX:
– 6-Week Change in Strength Index:8.31.5-23.2


US Treasury Bonds Futures:

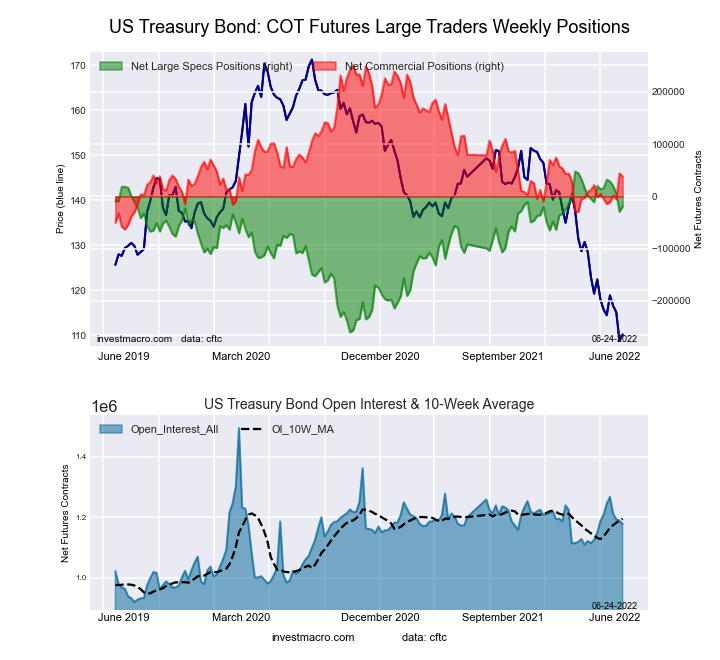
US Year Treasury Notes Long Bonds Futures COT ChartThe US Treasury Bonds large speculator standing this week was a net position of -19,322 contracts in the data reported through Tuesday. This was a weekly rise of 10,078 contracts from the previous week which had a total of -29,400 net contracts.

This week’s current strength score (the trader positioning range over the past three years, measured from 0 to 100) shows the speculators are currently Bullish with a score of 78.3 percent. The commercials are Bearish with a score of 26.5 percent and the small traders (not shown in chart) are Bearish with a score of 37.8 percent.

US Treasury Bonds StatisticsSPECULATORSCOMMERCIALSSMALL TRADERS
– Percent of Open Interest Longs:8.477.113.2
– Percent of Open Interest Shorts:10.173.914.7
– Net Position:-19,32237,921-18,599
– Gross Longs:99,282907,963154,938
– Gross Shorts:118,604870,042173,537
– Long to Short Ratio:0.8 to 11.0 to 10.9 to 1
NET POSITION TREND:
– Strength Index Score (3 Year Range Pct):78.326.537.8
– Strength Index Reading (3 Year Range):BullishBearishBearish
NET POSITION MOVEMENT INDEX:
– 6-Week Change in Strength Index:-11.314.8-6.5


Ultra US Treasury Bonds Futures:

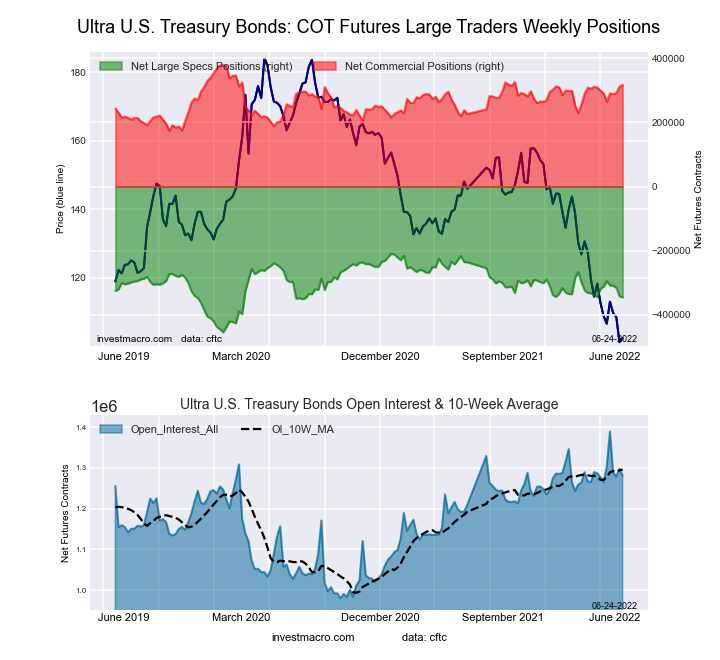
Ultra US Year Treasury Notes Long Bonds Futures COT ChartThe Ultra US Treasury Bonds large speculator standing this week was a net position of -345,056 contracts in the data reported through Tuesday. This was a weekly reduction of -3,455 contracts from the previous week which had a total of -341,601 net contracts.

This week’s current strength score (the trader positioning range over the past three years, measured from 0 to 100) shows the speculators are currently Bearish with a score of 44.4 percent. The commercials are Bullish with a score of 70.0 percent and the small traders (not shown in chart) are Bearish with a score of 48.5 percent.

Ultra US Treasury Bonds StatisticsSPECULATORSCOMMERCIALSSMALL TRADERS
– Percent of Open Interest Longs:3.385.111.4
– Percent of Open Interest Shorts:30.360.39.2
– Net Position:-345,056316,83628,220
– Gross Longs:42,4281,089,411145,784
– Gross Shorts:387,484772,575117,564
– Long to Short Ratio:0.1 to 11.4 to 11.2 to 1
NET POSITION TREND:
– Strength Index Score (3 Year Range Pct):44.470.048.5
– Strength Index Reading (3 Year Range):BearishBullishBearish
NET POSITION MOVEMENT INDEX:
– 6-Week Change in Strength Index:-13.712.85.3


Article By InvestMacroReceive our weekly COT Reports by Email

*COT Report: The COT data, released weekly to the public each Friday, is updated through the most recent Tuesday (data is 3 days old) and shows a quick view of how large speculators or non-commercials (for-profit traders) were positioned in the futures markets.

The CFTC categorizes trader positions according to commercial hedgers (traders who use futures contracts for hedging as part of the business), non-commercials (large traders who speculate to realize trading profits) and nonreportable traders (usually small traders/speculators) as well as their open interest (contracts open in the market at time of reporting).See CFTC criteria here.

COT Week 25 Charts: Soft Commodity Speculator bets slightly lower led by Corn & Sugar

By InvestMacro | COT | Data Tables | COT Leaders | Downloads | COT Newsletter

Here are the latest charts and statistics for the Commitment of Traders (COT) data published by the Commodities Futures Trading Commission (CFTC).

The latest COT data is updated through Tuesday June 21st and shows a quick view of how large traders (for-profit speculators and commercial entities) were positioned in the futures markets.

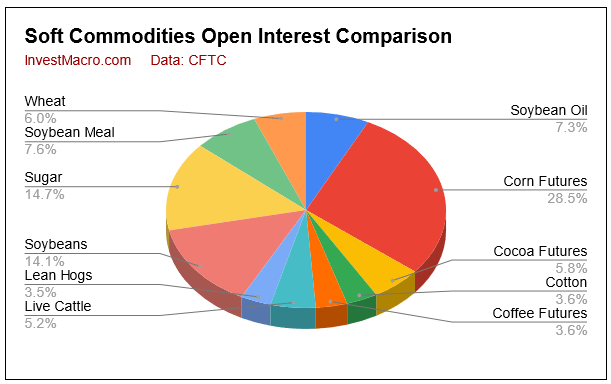
The soft commodities market speculator bets were mostly lower this week as six out of the eleven soft commodities markets we cover had higher positioning this week while five markets had lower contracts.

Leading the gains for soft commodities markets was Live Cattle (7,378 contracts) and Cocoa (6,674 contracts) with Soybean Meal (6,540 contracts), Lean Hogs (4,673 contracts) and Coffee (2,486 contracts) also showing positive speculator contract changes for the week. Meanwhile, leading the declines in speculator bets this week were Corn (-19,606 contracts) and Sugar (-7,372 contracts) with Soybean Oil (-5,868 contracts), Soybeans (-4,288 contracts), Wheat (-1,368 contracts) and Cotton (-210 contracts) also registering lower bets on the week.


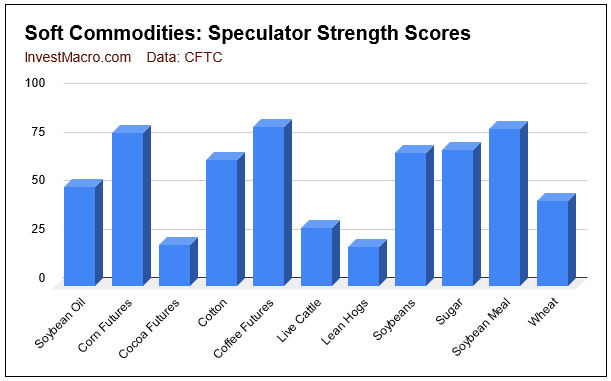
Strength scores (3-Year range of Speculator positions, from 0 to 100 where above 80 is extreme bullish and below 20 is extreme bearish) show that Coffee (81 percent) and Soybean Meal (80.6 percent) are in extreme bullish positions as of the latest data release. On the downside for strength scores is Lean Hogs (19.9 percent) which is just on the edge of being in a bearish extreme position and then Cocoa (20.9 percent) which is the next lowest.

Strength score trends (or move index, that calculate 6-week changes in strength scores) shows that Coffee (14.5 percent) and Soybean Meal (6.3 percent) have the highest trends as of the latest data. The overall effect of this chart shows how most of the soft commodities markets have really cooled off after really strong speculator sentiment since the start of the year.


Data Snapshot of Commodity Market Traders | Columns Legend
Jun-21-2022OIOI-IndexSpec-NetSpec-IndexCom-NetCOM-IndexSmalls-NetSmalls-Index
WTI Crude1,658,6360289,5020-323,91510034,41364
Gold500,27614163,2874-186,9299623,64214
Silver145,3561218,4197-27,250938,8314
Copper187,17017-20,9382718,928722,01037
Palladium7,6416-4,04604,511100-46517
Platinum64,946301,4916-6,397964,90630
Natural Gas1,030,9710-130,8693985,9775844,89286
Brent173,09818-38,0104736,052531,95836
Heating Oil268,818239,56456-28,2044118,64063
Soybeans745,49432178,37968-152,96838-25,41128
Corn1,512,15223380,16979-326,47425-53,69512
Coffee192,832049,37181-52,348222,97720
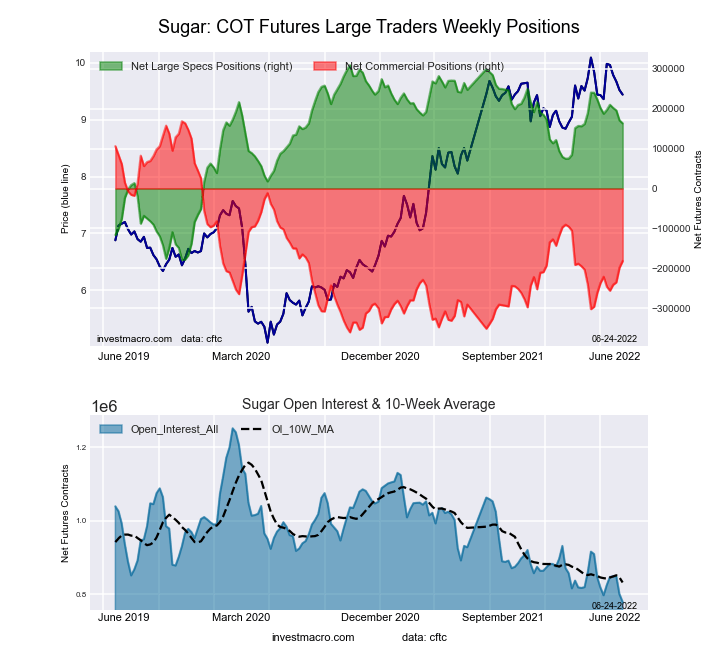
Sugar779,7730163,11170-181,2803418,16930
Wheat320,326619,06744-15,40738-3,66091


CORN Futures:

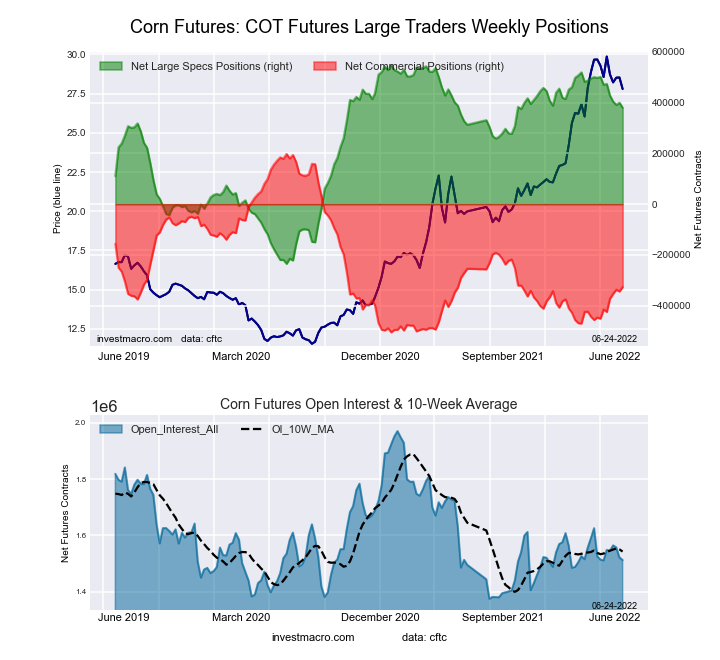
CORN Futures COT ChartThe CORN large speculator standing this week reached a net position of 380,169 contracts in the data reported through Tuesday. This was a weekly fall of -19,606 contracts from the previous week which had a total of 399,775 net contracts.

This week’s current strength score (the trader positioning range over the past three years, measured from 0 to 100) shows the speculators are currently Bullish with a score of 78.6 percent. The commercials are Bearish with a score of 25.4 percent and the small traders (not shown in chart) are Bearish-Extreme with a score of 12.1 percent.

CORN Futures StatisticsSPECULATORSCOMMERCIALSSMALL TRADERS
– Percent of Open Interest Longs:33.344.79.3
– Percent of Open Interest Shorts:8.266.312.9
– Net Position:380,169-326,474-53,695
– Gross Longs:504,174675,580140,912
– Gross Shorts:124,0051,002,054194,607
– Long to Short Ratio:4.1 to 10.7 to 10.7 to 1
NET POSITION TREND:
– Strength Index Score (3 Year Range Pct):78.625.412.1
– Strength Index Reading (3 Year Range):BullishBearishBearish-Extreme
NET POSITION MOVEMENT INDEX:
– 6-Week Change in Strength Index:-11.612.61.1


SUGAR Futures:

SUGAR Futures COT ChartThe SUGAR large speculator standing this week reached a net position of 163,111 contracts in the data reported through Tuesday. This was a weekly fall of -7,372 contracts from the previous week which had a total of 170,483 net contracts.

This week’s current strength score (the trader positioning range over the past three years, measured from 0 to 100) shows the speculators are currently Bullish with a score of 70.1 percent. The commercials are Bearish with a score of 33.8 percent and the small traders (not shown in chart) are Bearish with a score of 30.3 percent.

SUGAR Futures StatisticsSPECULATORSCOMMERCIALSSMALL TRADERS
– Percent of Open Interest Longs:29.149.29.0
– Percent of Open Interest Shorts:8.272.46.7
– Net Position:163,111-181,28018,169
– Gross Longs:227,142383,64670,240
– Gross Shorts:64,031564,92652,071
– Long to Short Ratio:3.5 to 10.7 to 11.3 to 1
NET POSITION TREND:
– Strength Index Score (3 Year Range Pct):70.133.830.3
– Strength Index Reading (3 Year Range):BullishBearishBearish
NET POSITION MOVEMENT INDEX:
– 6-Week Change in Strength Index:-4.97.5-18.9


COFFEE Futures:

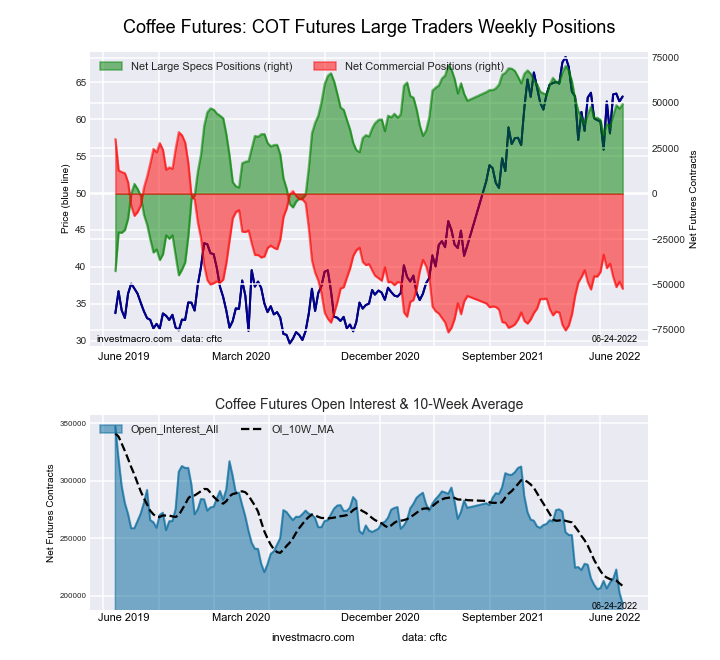
COFFEE Futures COT ChartThe COFFEE large speculator standing this week reached a net position of 49,371 contracts in the data reported through Tuesday. This was a weekly gain of 2,486 contracts from the previous week which had a total of 46,885 net contracts.

This week’s current strength score (the trader positioning range over the past three years, measured from 0 to 100) shows the speculators are currently Bullish-Extreme with a score of 81.5 percent. The commercials are Bearish with a score of 21.7 percent and the small traders (not shown in chart) are Bearish-Extreme with a score of 19.8 percent.

COFFEE Futures StatisticsSPECULATORSCOMMERCIALSSMALL TRADERS
– Percent of Open Interest Longs:30.347.64.4
– Percent of Open Interest Shorts:4.774.72.8
– Net Position:49,371-52,3482,977
– Gross Longs:58,44291,7898,425
– Gross Shorts:9,071144,1375,448
– Long to Short Ratio:6.4 to 10.6 to 11.5 to 1
NET POSITION TREND:
– Strength Index Score (3 Year Range Pct):81.521.719.8
– Strength Index Reading (3 Year Range):Bullish-ExtremeBearishBearish-Extreme
NET POSITION MOVEMENT INDEX:
– 6-Week Change in Strength Index:14.5-17.019.8


SOYBEANS Futures:

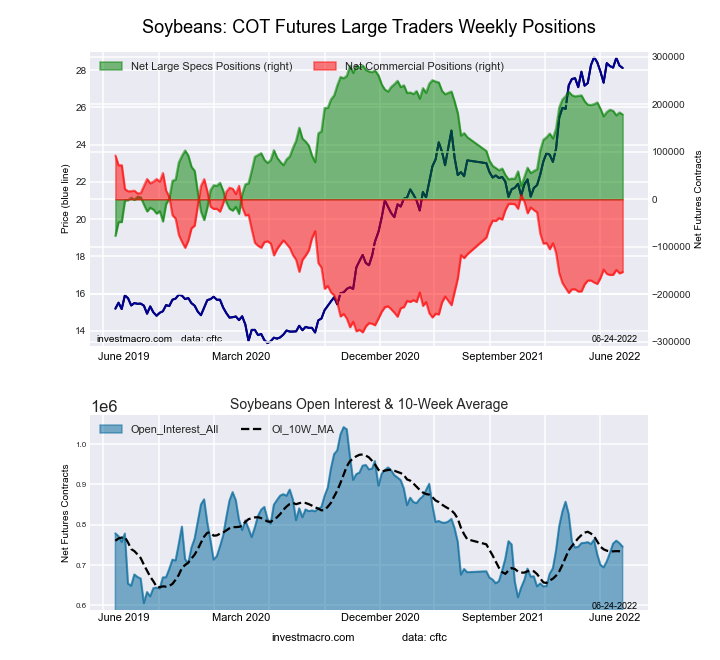
SOYBEANS Futures COT ChartThe SOYBEANS large speculator standing this week reached a net position of 178,379 contracts in the data reported through Tuesday. This was a weekly decrease of -4,288 contracts from the previous week which had a total of 182,667 net contracts.

This week’s current strength score (the trader positioning range over the past three years, measured from 0 to 100) shows the speculators are currently Bullish with a score of 68.5 percent. The commercials are Bearish with a score of 37.9 percent and the small traders (not shown in chart) are Bearish with a score of 28.1 percent.

SOYBEANS Futures StatisticsSPECULATORSCOMMERCIALSSMALL TRADERS
– Percent of Open Interest Longs:30.350.56.6
– Percent of Open Interest Shorts:6.471.010.0
– Net Position:178,379-152,968-25,411
– Gross Longs:226,191376,15549,215
– Gross Shorts:47,812529,12374,626
– Long to Short Ratio:4.7 to 10.7 to 10.7 to 1
NET POSITION TREND:
– Strength Index Score (3 Year Range Pct):68.537.928.1
– Strength Index Reading (3 Year Range):BullishBearishBearish
NET POSITION MOVEMENT INDEX:
– 6-Week Change in Strength Index:1.1-1.62.5


SOYBEAN OIL Futures:

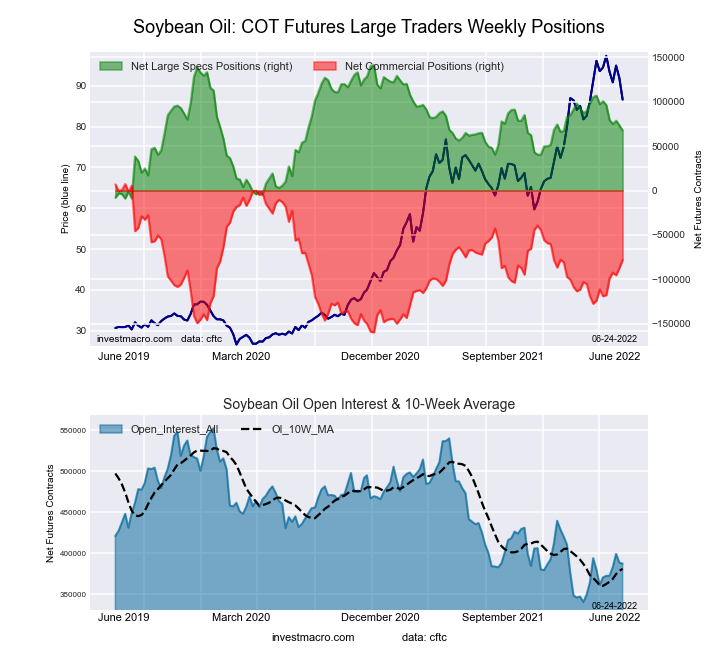
SOYBEAN OIL Futures COT ChartThe SOYBEAN OIL large speculator standing this week reached a net position of 67,530 contracts in the data reported through Tuesday. This was a weekly reduction of -5,868 contracts from the previous week which had a total of 73,398 net contracts.

This week’s current strength score (the trader positioning range over the past three years, measured from 0 to 100) shows the speculators are currently Bullish with a score of 50.9 percent. The commercials are Bearish with a score of 48.9 percent and the small traders (not shown in chart) are Bullish with a score of 52.0 percent.

SOYBEAN OIL Futures StatisticsSPECULATORSCOMMERCIALSSMALL TRADERS
– Percent of Open Interest Longs:25.052.98.4
– Percent of Open Interest Shorts:7.673.05.7
– Net Position:67,530-77,86910,339
– Gross Longs:96,861205,00732,564
– Gross Shorts:29,331282,87622,225
– Long to Short Ratio:3.3 to 10.7 to 11.5 to 1
NET POSITION TREND:
– Strength Index Score (3 Year Range Pct):50.948.952.0
– Strength Index Reading (3 Year Range):BullishBearishBullish
NET POSITION MOVEMENT INDEX:
– 6-Week Change in Strength Index:-22.024.5-29.5


SOYBEAN MEAL Futures:

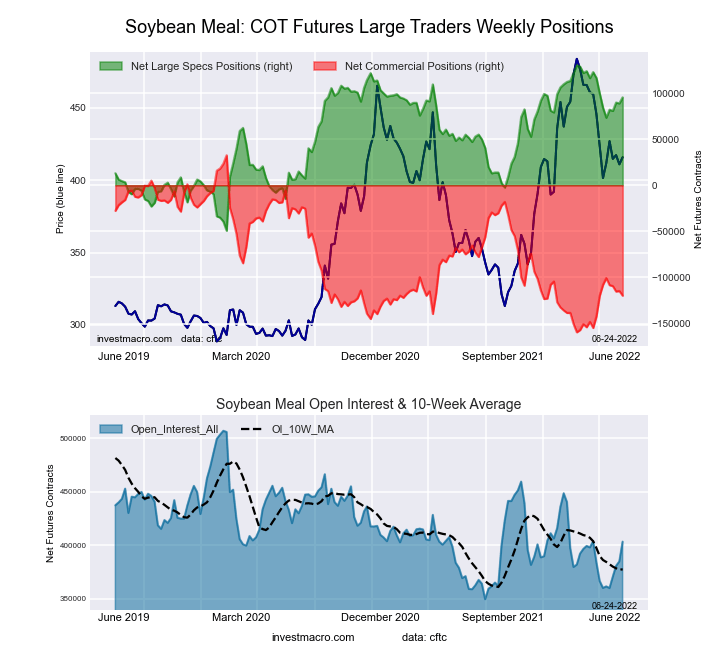
SOYBEAN MEAL Futures COT ChartThe SOYBEAN MEAL large speculator standing this week reached a net position of 95,371 contracts in the data reported through Tuesday. This was a weekly advance of 6,540 contracts from the previous week which had a total of 88,831 net contracts.

This week’s current strength score (the trader positioning range over the past three years, measured from 0 to 100) shows the speculators are currently Bullish-Extreme with a score of 80.6 percent. The commercials are Bearish with a score of 20.7 percent and the small traders (not shown in chart) are Bullish with a score of 60.0 percent.

SOYBEAN MEAL Futures StatisticsSPECULATORSCOMMERCIALSSMALL TRADERS
– Percent of Open Interest Longs:27.542.811.8
– Percent of Open Interest Shorts:3.972.65.7
– Net Position:95,371-119,79924,428
– Gross Longs:110,934172,82347,533
– Gross Shorts:15,563292,62223,105
– Long to Short Ratio:7.1 to 10.6 to 12.1 to 1
NET POSITION TREND:
– Strength Index Score (3 Year Range Pct):80.620.760.0
– Strength Index Reading (3 Year Range):Bullish-ExtremeBearishBullish
NET POSITION MOVEMENT INDEX:
– 6-Week Change in Strength Index:6.3-6.12.6


LIVE CATTLE Futures:

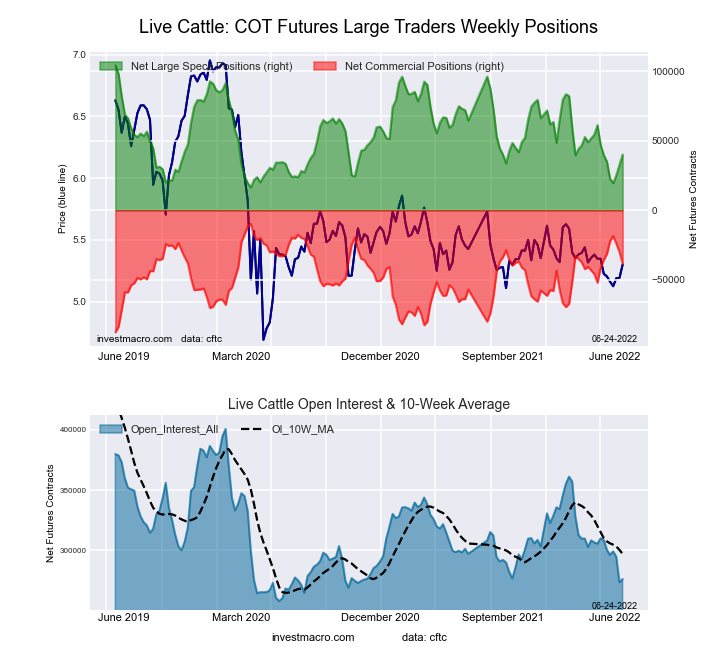
LIVE CATTLE Futures COT ChartThe LIVE CATTLE large speculator standing this week reached a net position of 40,122 contracts in the data reported through Tuesday. This was a weekly advance of 7,378 contracts from the previous week which had a total of 32,744 net contracts.

This week’s current strength score (the trader positioning range over the past three years, measured from 0 to 100) shows the speculators are currently Bearish with a score of 29.7 percent. The commercials are Bullish with a score of 60.4 percent and the small traders (not shown in chart) are Bullish with a score of 76.7 percent.

LIVE CATTLE Futures StatisticsSPECULATORSCOMMERCIALSSMALL TRADERS
– Percent of Open Interest Longs:37.139.711.4
– Percent of Open Interest Shorts:22.653.612.0
– Net Position:40,122-38,641-1,481
– Gross Longs:102,557109,56131,589
– Gross Shorts:62,435148,20233,070
– Long to Short Ratio:1.6 to 10.7 to 11.0 to 1
NET POSITION TREND:
– Strength Index Score (3 Year Range Pct):29.760.476.7
– Strength Index Reading (3 Year Range):BearishBullishBullish
NET POSITION MOVEMENT INDEX:
– 6-Week Change in Strength Index:0.4-3.98.8


LEAN HOGS Futures:

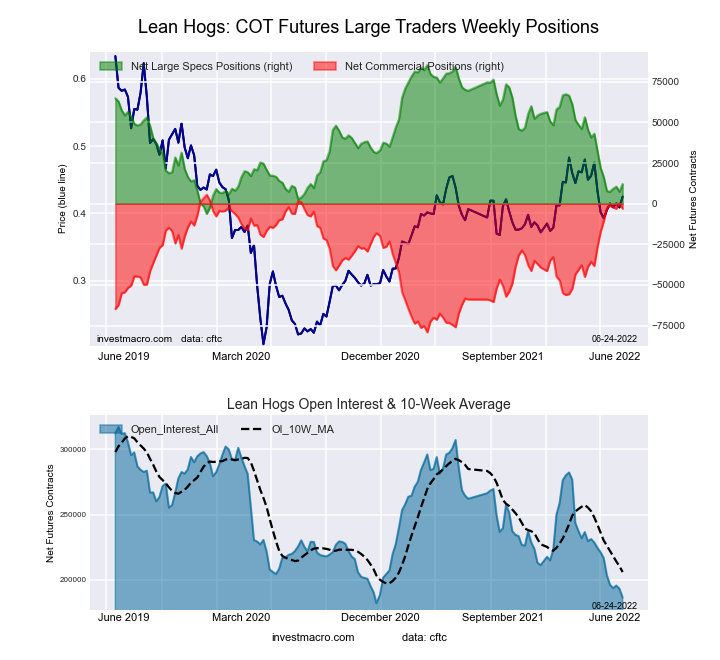
LEAN HOGS Futures COT ChartThe LEAN HOGS large speculator standing this week reached a net position of 12,059 contracts in the data reported through Tuesday. This was a weekly lift of 4,673 contracts from the previous week which had a total of 7,386 net contracts.

This week’s current strength score (the trader positioning range over the past three years, measured from 0 to 100) shows the speculators are currently Bearish-Extreme with a score of 19.9 percent. The commercials are Bullish-Extreme with a score of 89.9 percent and the small traders (not shown in chart) are Bearish with a score of 49.7 percent.

LEAN HOGS Futures StatisticsSPECULATORSCOMMERCIALSSMALL TRADERS
– Percent of Open Interest Longs:31.643.410.2
– Percent of Open Interest Shorts:25.245.015.0
– Net Position:12,059-3,041-9,018
– Gross Longs:59,03180,95518,981
– Gross Shorts:46,97283,99627,999
– Long to Short Ratio:1.3 to 11.0 to 10.7 to 1
NET POSITION TREND:
– Strength Index Score (3 Year Range Pct):19.989.949.7
– Strength Index Reading (3 Year Range):Bearish-ExtremeBullish-ExtremeBearish
NET POSITION MOVEMENT INDEX:
– 6-Week Change in Strength Index:-4.79.2-18.1


COTTON Futures:

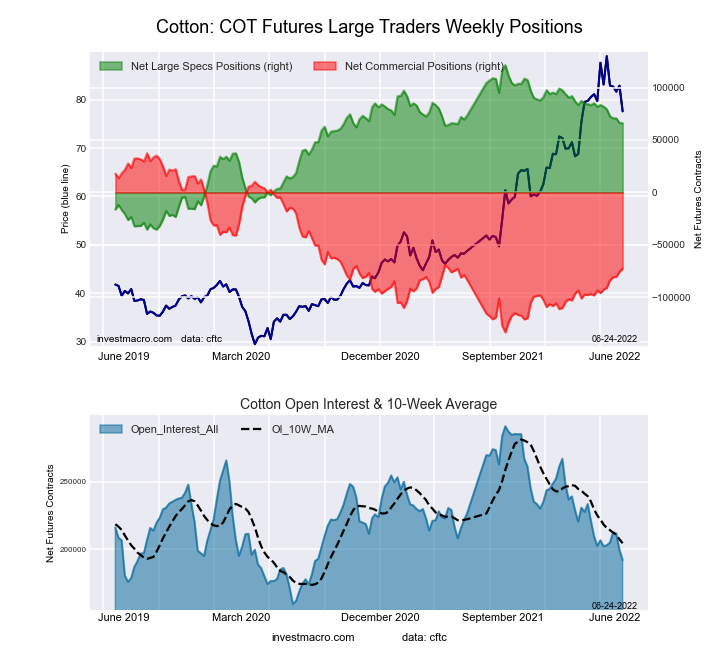
COTTON Futures COT ChartThe COTTON large speculator standing this week reached a net position of 66,045 contracts in the data reported through Tuesday. This was a weekly decrease of -210 contracts from the previous week which had a total of 66,255 net contracts.

This week’s current strength score (the trader positioning range over the past three years, measured from 0 to 100) shows the speculators are currently Bullish with a score of 64.7 percent. The commercials are Bearish with a score of 35.5 percent and the small traders (not shown in chart) are Bullish with a score of 54.2 percent.

COTTON Futures StatisticsSPECULATORSCOMMERCIALSSMALL TRADERS
– Percent of Open Interest Longs:42.439.78.3
– Percent of Open Interest Shorts:8.077.64.8
– Net Position:66,045-72,6816,636
– Gross Longs:81,41076,25115,830
– Gross Shorts:15,365148,9329,194
– Long to Short Ratio:5.3 to 10.5 to 11.7 to 1
NET POSITION TREND:
– Strength Index Score (3 Year Range Pct):64.735.554.2
– Strength Index Reading (3 Year Range):BullishBearishBullish
NET POSITION MOVEMENT INDEX:
– 6-Week Change in Strength Index:-10.011.7-26.7


COCOA Futures:

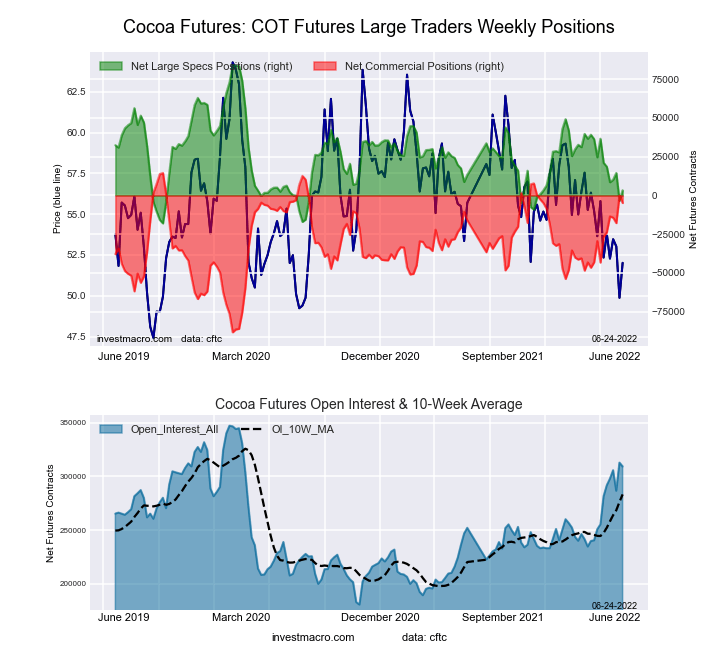
COCOA Futures COT ChartThe COCOA large speculator standing this week reached a net position of 3,305 contracts in the data reported through Tuesday. This was a weekly boost of 6,674 contracts from the previous week which had a total of -3,369 net contracts.

This week’s current strength score (the trader positioning range over the past three years, measured from 0 to 100) shows the speculators are currently Bearish with a score of 20.9 percent. The commercials are Bullish-Extreme with a score of 81.2 percent and the small traders (not shown in chart) are Bearish-Extreme with a score of 12.0 percent.

COCOA Futures StatisticsSPECULATORSCOMMERCIALSSMALL TRADERS
– Percent of Open Interest Longs:30.343.94.2
– Percent of Open Interest Shorts:29.245.53.7
– Net Position:3,305-4,8561,551
– Gross Longs:93,606135,95812,977
– Gross Shorts:90,301140,81411,426
– Long to Short Ratio:1.0 to 11.0 to 11.1 to 1
NET POSITION TREND:
– Strength Index Score (3 Year Range Pct):20.981.212.0
– Strength Index Reading (3 Year Range):BearishBullish-ExtremeBearish-Extreme
NET POSITION MOVEMENT INDEX:
– 6-Week Change in Strength Index:-17.421.3-41.9


WHEAT Futures:

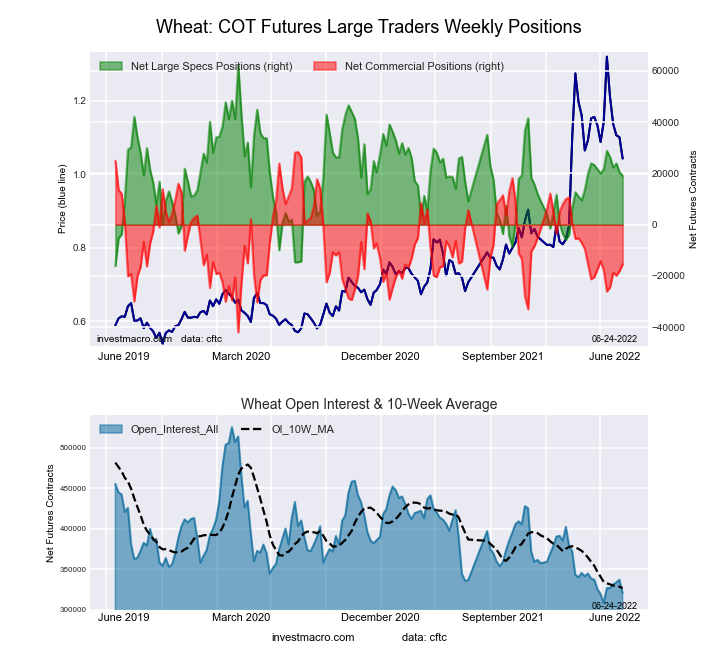
WHEAT Futures COT ChartThe WHEAT large speculator standing this week reached a net position of 19,067 contracts in the data reported through Tuesday. This was a weekly reduction of -1,368 contracts from the previous week which had a total of 20,435 net contracts.

This week’s current strength score (the trader positioning range over the past three years, measured from 0 to 100) shows the speculators are currently Bearish with a score of 43.9 percent. The commercials are Bearish with a score of 37.8 percent and the small traders (not shown in chart) are Bullish-Extreme with a score of 91.4 percent.

WHEAT Futures StatisticsSPECULATORSCOMMERCIALSSMALL TRADERS
– Percent of Open Interest Longs:32.139.110.4
– Percent of Open Interest Shorts:26.244.011.5
– Net Position:19,067-15,407-3,660
– Gross Longs:102,924125,39933,167
– Gross Shorts:83,857140,80636,827
– Long to Short Ratio:1.2 to 10.9 to 10.9 to 1
NET POSITION TREND:
– Strength Index Score (3 Year Range Pct):43.937.891.4
– Strength Index Reading (3 Year Range):BearishBearishBullish-Extreme
NET POSITION MOVEMENT INDEX:
– 6-Week Change in Strength Index:-3.43.41.3


Article By InvestMacroReceive our weekly COT Reports by Email

*COT Report: The COT data, released weekly to the public each Friday, is updated through the most recent Tuesday (data is 3 days old) and shows a quick view of how large speculators or non-commercials (for-profit traders) were positioned in the futures markets.

The CFTC categorizes trader positions according to commercial hedgers (traders who use futures contracts for hedging as part of the business), non-commercials (large traders who speculate to realize trading profits) and nonreportable traders (usually small traders/speculators) as well as their open interest (contracts open in the market at time of reporting).See CFTC criteria here.
COT Week 25 Charts: Energy Speculator bets on defensive led by WTI Crude Oil & Natural Gas

By InvestMacro | COT | Data Tables | COT Leaders | Downloads | COT Newsletter

energy_oi

Here are the latest charts and statistics for the Commitment of Traders (COT) data published by the Commodities Futures Trading Commission (CFTC).

The latest COT data is updated through Tuesday June 21st and shows a quick view of how large traders (for-profit speculators and commercial entities) were positioned in the futures markets.

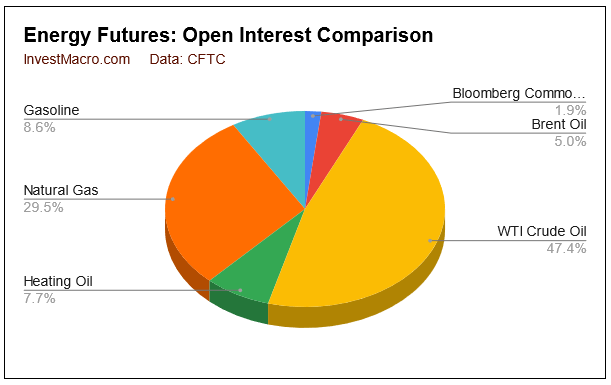
Energy markets speculator bets were lower on the week as just two out of the six energy markets we cover had higher positioning this week while four markets had lower contracts.

Leading the gains for energy markets was Heating Oil (1,089 contracts) with the Bloomberg Commodity Index (259 contracts) also showing a small positive week. Meanwhile, leading the declines in speculator bets this week was WTI Crude Oil (-13,444 contracts) with Natural Gas (-7,384 contracts), Brent Crude Oil (-1,621 contracts) and Gasoline (-49 contracts) also registering lower bets on the week.


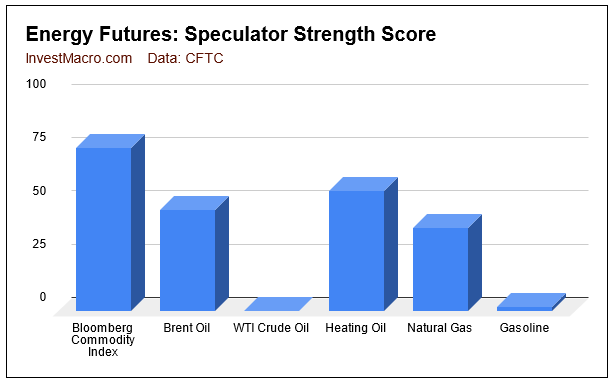
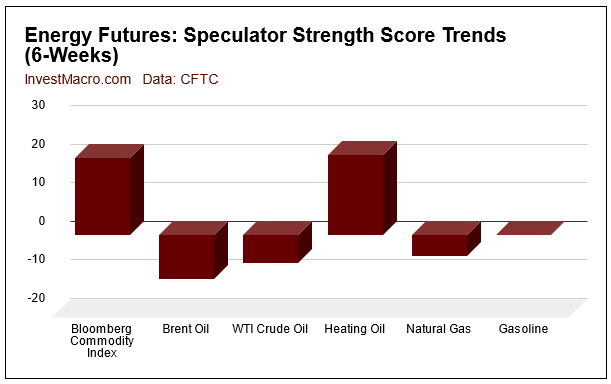
Strength scores (3-Year range of Speculator positions, from 0 to 100 where above 80 is extreme bullish and below 20 is extreme bearish) show that the Bloomberg Commodity Index and the Heating Oil are both in bullish levels at the moment. All other energy markets are below the midpoint of the past 3-years and have bearish or extreme bearish readings.

Strength score trends (or move index, that calculate 6-week changes in strength scores) shows that the Bloomberg Commodity Index and the Heating Oil are again leading the six week trends with 19.9 percent and 20.8 percent, respectively. Brent Oil leads the downside trends with -11.4 percent over the past six weeks.


Data Snapshot of Commodity Market Traders | Columns Legend
Jun-21-2022OIOI-IndexSpec-NetSpec-IndexCom-NetCOM-IndexSmalls-NetSmalls-Index
WTI Crude1,658,6360289,5020-323,91510034,41364
Gold500,27614163,2874-186,9299623,64214
Silver145,3561218,4197-27,250938,8314
Copper187,17017-20,9382718,928722,01037
Palladium7,6416-4,04604,511100-46517
Platinum64,946301,4916-6,397964,90630
Natural Gas1,030,9710-130,8693985,9775844,89286
Brent173,09818-38,0104736,052531,95836
Heating Oil268,818239,56456-28,2044118,64063
Soybeans745,49432178,37968-152,96838-25,41128
Corn1,512,15223380,16979-326,47425-53,69512
Coffee192,832049,37181-52,348222,97720
Sugar779,7730163,11170-181,2803418,16930
Wheat320,326619,06744-15,40738-3,66091


WTI Crude Oil Futures:

WTI Crude Oil Futures COT ChartThe WTI Crude Oil Futures large speculator standing this week was a net position of 289,502 contracts in the data reported through Tuesday. This was a weekly decline of -13,444 contracts from the previous week which had a total of 302,946 net contracts.

This week’s current strength score (the trader positioning range over the past three years, measured from 0 to 100) shows the speculators are currently Bearish-Extreme with a score of 0.0 percent. The commercials are Bullish-Extreme with a score of 100.0 percent and the small traders (not shown in chart) are Bullish with a score of 63.5 percent.

WTI Crude Oil Futures StatisticsSPECULATORSCOMMERCIALSSMALL TRADERS
– Percent of Open Interest Longs:23.435.95.2
– Percent of Open Interest Shorts:6.055.43.2
– Net Position:289,502-323,91534,413
– Gross Longs:388,496594,86086,668
– Gross Shorts:98,994918,77552,255
– Long to Short Ratio:3.9 to 10.6 to 11.7 to 1
NET POSITION TREND:
– Strength Index Score (3 Year Range Pct):0.0100.063.5
– Strength Index Reading (3 Year Range):Bearish-ExtremeBullish-ExtremeBullish
NET POSITION MOVEMENT INDEX:
– 6-Week Change in Strength Index:-7.110.7-13.1


Brent Crude Oil Futures:

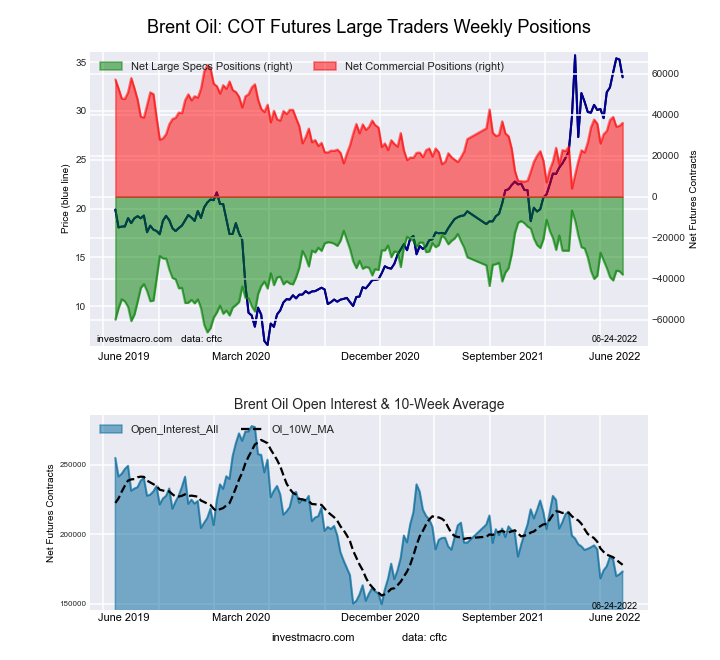
Brent Last Day Crude Oil Futures COT ChartThe Brent Crude Oil Futures large speculator standing this week was a net position of -38,010 contracts in the data reported through Tuesday. This was a weekly decline of -1,621 contracts from the previous week which had a total of -36,389 net contracts.

This week’s current strength score (the trader positioning range over the past three years, measured from 0 to 100) shows the speculators are currently Bearish with a score of 47.4 percent. The commercials are Bullish with a score of 53.2 percent and the small traders (not shown in chart) are Bearish with a score of 35.7 percent.

Brent Crude Oil Futures StatisticsSPECULATORSCOMMERCIALSSMALL TRADERS
– Percent of Open Interest Longs:15.251.54.0
– Percent of Open Interest Shorts:37.130.72.8
– Net Position:-38,01036,0521,958
– Gross Longs:26,22589,1956,865
– Gross Shorts:64,23553,1434,907
– Long to Short Ratio:0.4 to 11.7 to 11.4 to 1
NET POSITION TREND:
– Strength Index Score (3 Year Range Pct):47.453.235.7
– Strength Index Reading (3 Year Range):BearishBullishBearish
NET POSITION MOVEMENT INDEX:
– 6-Week Change in Strength Index:-11.49.117.7


Natural Gas Futures:

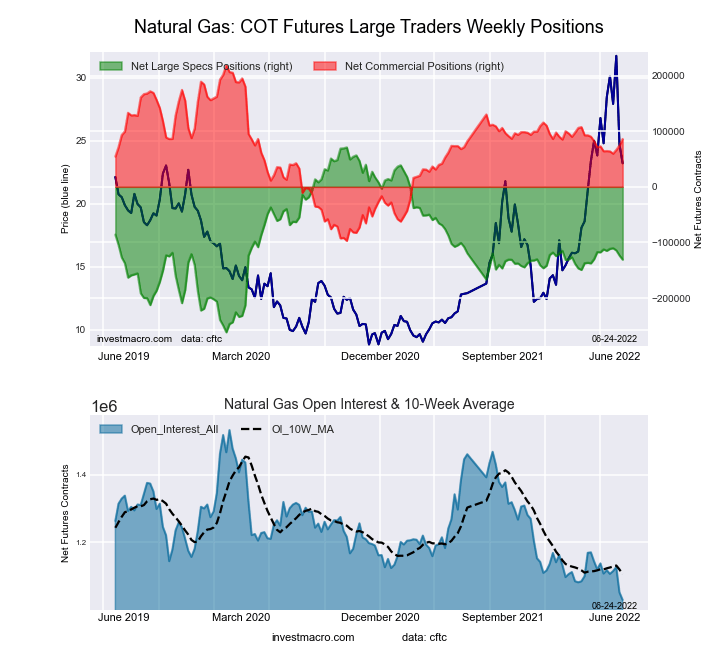
Natural Gas Futures COT ChartThe Natural Gas Futures large speculator standing this week was a net position of -130,869 contracts in the data reported through Tuesday. This was a weekly lowering of -7,384 contracts from the previous week which had a total of -123,485 net contracts.

This week’s current strength score (the trader positioning range over the past three years, measured from 0 to 100) shows the speculators are currently Bearish with a score of 39.3 percent. The commercials are Bullish with a score of 58.0 percent and the small traders (not shown in chart) are Bullish-Extreme with a score of 86.3 percent.

Natural Gas Futures StatisticsSPECULATORSCOMMERCIALSSMALL TRADERS
– Percent of Open Interest Longs:20.739.87.0
– Percent of Open Interest Shorts:33.431.52.7
– Net Position:-130,86985,97744,892
– Gross Longs:213,487410,45772,315
– Gross Shorts:344,356324,48027,423
– Long to Short Ratio:0.6 to 11.3 to 12.6 to 1
NET POSITION TREND:
– Strength Index Score (3 Year Range Pct):39.358.086.3
– Strength Index Reading (3 Year Range):BearishBullishBullish-Extreme
NET POSITION MOVEMENT INDEX:
– 6-Week Change in Strength Index:-5.57.0-8.6


Gasoline Blendstock Futures:

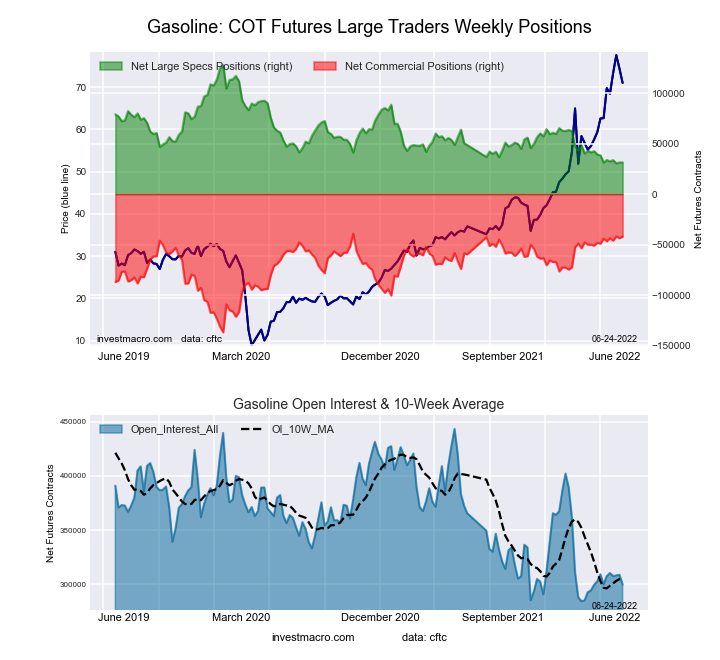
RBOB Gasoline Energy Futures COT ChartThe Gasoline Blendstock Futures large speculator standing this week was a net position of 31,407 contracts in the data reported through Tuesday. This was a weekly lowering of -49 contracts from the previous week which had a total of 31,456 net contracts.

This week’s current strength score (the trader positioning range over the past three years, measured from 0 to 100) shows the speculators are currently Bearish-Extreme with a score of 2.1 percent. The commercials are Bullish-Extreme with a score of 95.0 percent and the small traders (not shown in chart) are Bullish-Extreme with a score of 83.8 percent.

Nasdaq Mini Futures StatisticsSPECULATORSCOMMERCIALSSMALL TRADERS
– Percent of Open Interest Longs:25.354.37.8
– Percent of Open Interest Shorts:14.868.34.3
– Net Position:31,407-42,08010,673
– Gross Longs:75,835162,81623,491
– Gross Shorts:44,428204,89612,818
– Long to Short Ratio:1.7 to 10.8 to 11.8 to 1
NET POSITION TREND:
– Strength Index Score (3 Year Range Pct):2.195.083.8
– Strength Index Reading (3 Year Range):Bearish-ExtremeBullish-ExtremeBullish-Extreme
NET POSITION MOVEMENT INDEX:
– 6-Week Change in Strength Index:0.02.0-13.5


#2 Heating Oil NY-Harbor Futures:

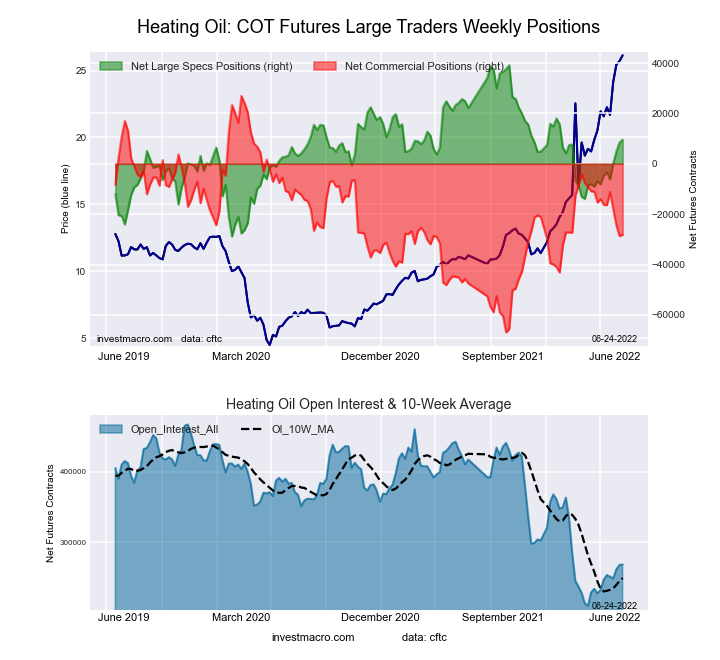
NY Harbor Heating Oil Energy Futures COT ChartThe #2 Heating Oil NY-Harbor Futures large speculator standing this week was a net position of 9,564 contracts in the data reported through Tuesday. This was a weekly lift of 1,089 contracts from the previous week which had a total of 8,475 net contracts.

This week’s current strength score (the trader positioning range over the past three years, measured from 0 to 100) shows the speculators are currently Bullish with a score of 56.5 percent. The commercials are Bearish with a score of 41.2 percent and the small traders (not shown in chart) are Bullish with a score of 62.9 percent.

Heating Oil Futures StatisticsSPECULATORSCOMMERCIALSSMALL TRADERS
– Percent of Open Interest Longs:17.151.016.7
– Percent of Open Interest Shorts:13.561.59.8
– Net Position:9,564-28,20418,640
– Gross Longs:45,955137,16644,894
– Gross Shorts:36,391165,37026,254
– Long to Short Ratio:1.3 to 10.8 to 11.7 to 1
NET POSITION TREND:
– Strength Index Score (3 Year Range Pct):56.541.262.9
– Strength Index Reading (3 Year Range):BullishBearishBullish
NET POSITION MOVEMENT INDEX:
– 6-Week Change in Strength Index:20.8-12.7-7.7


Bloomberg Commodity Index Futures:

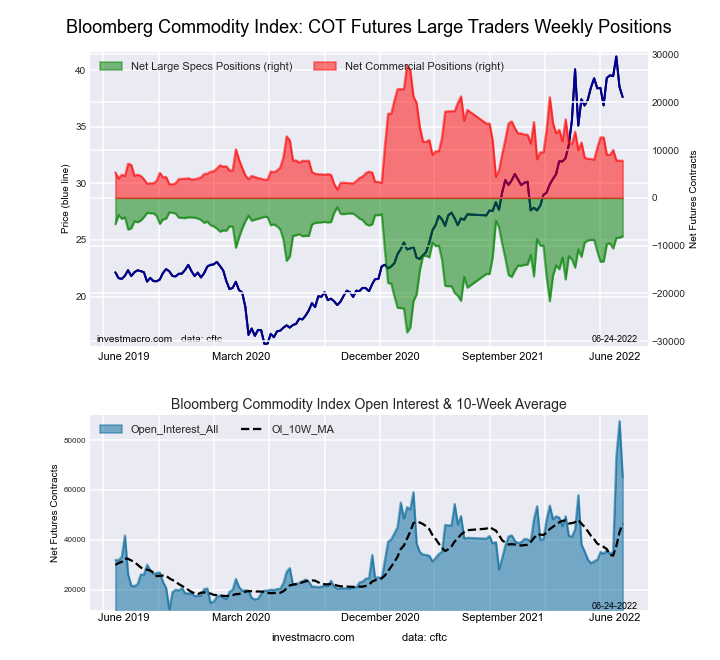
Bloomberg Commodity Index Futures COT ChartThe Bloomberg Commodity Index Futures large speculator standing this week was a net position of -8,052 contracts in the data reported through Tuesday. This was a weekly boost of 259 contracts from the previous week which had a total of -8,311 net contracts.

This week’s current strength score (the trader positioning range over the past three years, measured from 0 to 100) shows the speculators are currently Bullish with a score of 76.7 percent. The commercials are Bearish with a score of 23.2 percent and the small traders (not shown in chart) are Bearish with a score of 29.7 percent.

Bloomberg Index Futures StatisticsSPECULATORSCOMMERCIALSSMALL TRADERS
– Percent of Open Interest Longs:26.869.50.7
– Percent of Open Interest Shorts:39.157.50.2
– Net Position:-8,0527,764288
– Gross Longs:17,43445,267447
– Gross Shorts:25,48637,503159
– Long to Short Ratio:0.7 to 11.2 to 12.8 to 1
NET POSITION TREND:
– Strength Index Score (3 Year Range Pct):76.723.229.7
– Strength Index Reading (3 Year Range):BullishBearishBearish
NET POSITION MOVEMENT INDEX:
– 6-Week Change in Strength Index:19.9-18.8-11.7


Article By InvestMacroReceive our weekly COT Reports by Email

*COT Report: The COT data, released weekly to the public each Friday, is updated through the most recent Tuesday (data is 3 days old) and shows a quick view of how large speculators or non-commercials (for-profit traders) were positioned in the futures markets.

The CFTC categorizes trader positions according to commercial hedgers (traders who use futures contracts for hedging as part of the business), non-commercials (large traders who speculate to realize trading profits) and nonreportable traders (usually small traders/speculators) as well as their open interest (contracts open in the market at time of reporting).See CFTC criteria here.

COT Week 25 Charts: Stock Market Speculator bets mostly lower led by S&P500 Mini & Russell 2000

By InvestMacro | COT | Data Tables | COT Leaders | Downloads | COT Newsletter

Here are the latest charts and statistics for the Commitment of Traders (COT) data published by the Commodities Futures Trading Commission (CFTC).

The latest COT data is updated through Tuesday June 21st and shows a quick view of how large traders (for-profit speculators and commercial entities) were positioned in the futures markets.

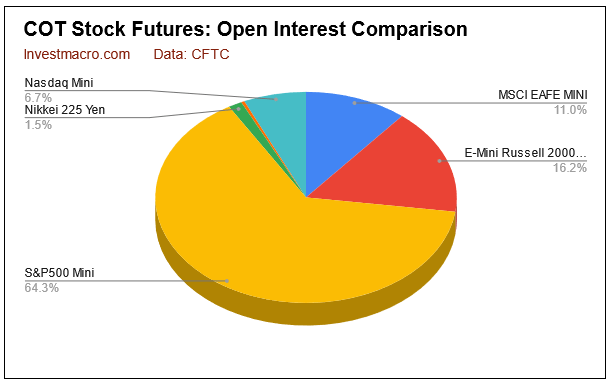
The stock market speculator bets were mostly lower this week as three out of the eight stock markets we cover had higher positioning this week while the other five markets had lower contracts.

Leading the gains for stock markets was VIX (24,255 contracts) with the Nasdaq Mini (2,404 contracts) and Nikkei 225 USD (821 contracts) also showing a positive weeks. Meanwhile, leading the declines in speculator bets this week were S&P500 Mini (-148,597 contracts) and with Russell 2000 Mini (-10,350 contracts), Nikkei 225 Yen (-5,996 contracts), MSCI EAFE Mini (-4,840 contracts) and Dow Jones Industrial Average Mini (-3,184 contracts) also registering lower bets on the week.


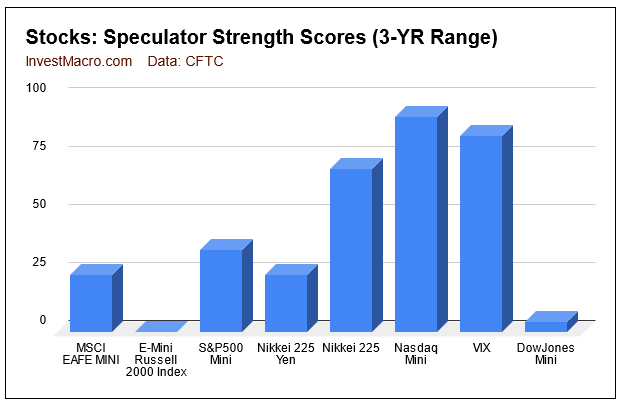
Strength scores (3-Year range of Speculator positions, from 0 to 100 where above 80 is extreme bullish and below 20 is extreme bearish) show that the Nasdaq Mini and the VIX are both in extreme bullish levels (above 80 percent). The Nikkei Stock Average is also above the midpoint of the past 3-year with a 69.9 percent score for a bullish reading.

Strength score trends (or move index, that calculate 6-week changes in strength scores) shows that the S&P 500 Mini and the Russell 200 Mini are leading the downside trends with -43.7 percent and -21.9 percent, respectively. The Nasdaq Mini and the Nikkei 225 Yen are the only markets with positive six week trends.


Data Snapshot of Stock Market Traders | Columns Legend
Jun-21-2022OIOI-IndexSpec-NetSpec-IndexCom-NetCOM-IndexSmalls-NetSmalls-Index
S&P500-Mini2,262,0046-114,31935144,19792-29,87820
Nikkei 22512,3805-1,592702,13940-54721
Nasdaq-Mini236,6243430,80692-27,58610-3,22042
DowJones-Mini69,02426-25,473428,93798-3,46420
VIX257,93015-49,9238455,73016-5,80763
Nikkei 225 Yen51,19830-3,0472525,17088-22,12329


VIX Volatility Futures:

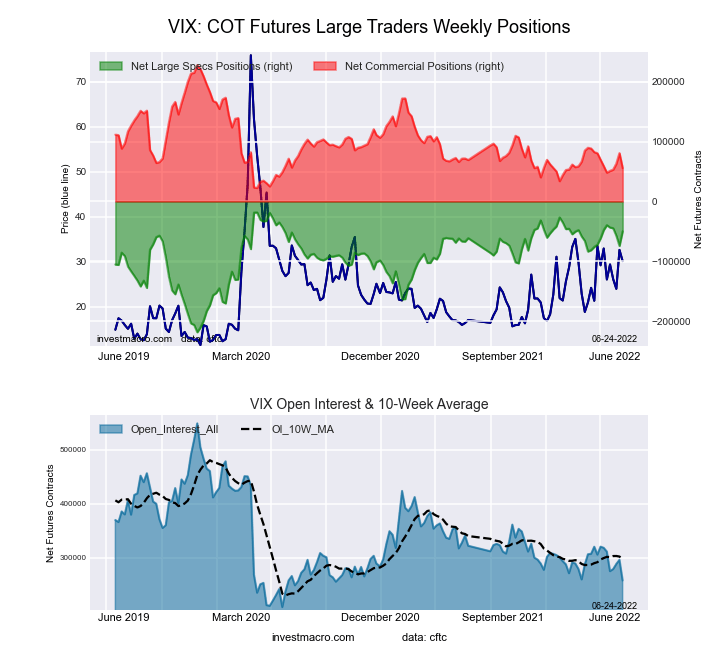
VIX Volatility Futures COT ChartThe VIX Volatility large speculator standing this week came in at a net position of -49,923 contracts in the data reported through Tuesday. This was a weekly gain of 24,255 contracts from the previous week which had a total of -74,178 net contracts.

This week’s current strength score (the trader positioning range over the past three years, measured from 0 to 100) shows the speculators are currently Bullish-Extreme with a score of 84.2 percent. The commercials are Bearish-Extreme with a score of 16.2 percent and the small traders (not shown in chart) are Bullish with a score of 63.2 percent.

VIX Volatility Futures StatisticsSPECULATORSCOMMERCIALSSMALL TRADERS
– Percent of Open Interest Longs:18.253.88.4
– Percent of Open Interest Shorts:37.632.210.7
– Net Position:-49,92355,730-5,807
– Gross Longs:46,982138,74621,718
– Gross Shorts:96,90583,01627,525
– Long to Short Ratio:0.5 to 11.7 to 10.8 to 1
NET POSITION TREND:
– Strength Index Score (3 Year Range Pct):84.216.263.2
– Strength Index Reading (3 Year Range):Bullish-ExtremeBearish-ExtremeBullish
NET POSITION MOVEMENT INDEX:
– 6-Week Change in Strength Index:-1.0-1.827.4


S&P500 Mini Futures:

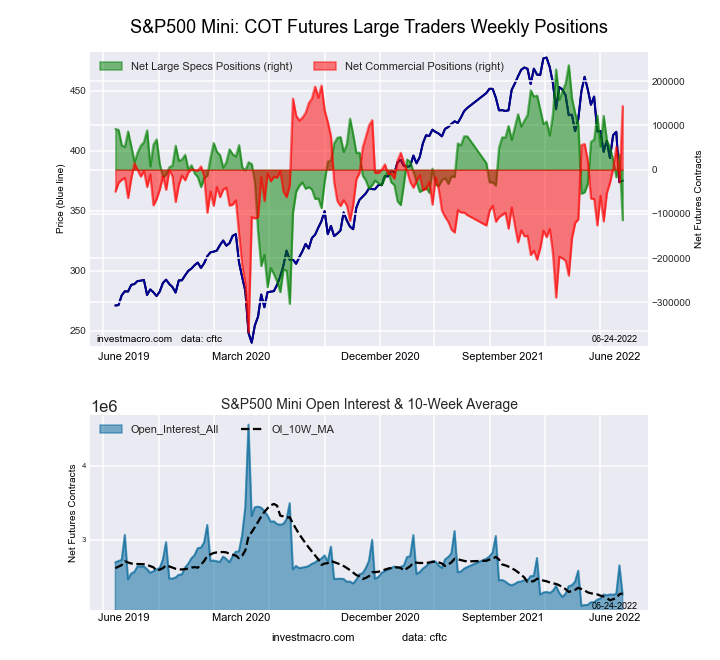
SP500 Mini Futures COT ChartThe S&P500 Mini large speculator standing this week came in at a net position of -114,319 contracts in the data reported through Tuesday. This was a weekly fall of -148,597 contracts from the previous week which had a total of 34,278 net contracts.

This week’s current strength score (the trader positioning range over the past three years, measured from 0 to 100) shows the speculators are currently Bearish with a score of 35.0 percent. The commercials are Bullish-Extreme with a score of 91.7 percent and the small traders (not shown in chart) are Bearish with a score of 20.1 percent.

S&P500 Mini Futures StatisticsSPECULATORSCOMMERCIALSSMALL TRADERS
– Percent of Open Interest Longs:12.175.79.9
– Percent of Open Interest Shorts:17.269.411.3
– Net Position:-114,319144,197-29,878
– Gross Longs:273,6291,713,053224,849
– Gross Shorts:387,9481,568,856254,727
– Long to Short Ratio:0.7 to 11.1 to 10.9 to 1
NET POSITION TREND:
– Strength Index Score (3 Year Range Pct):35.091.720.1
– Strength Index Reading (3 Year Range):BearishBullish-ExtremeBearish
NET POSITION MOVEMENT INDEX:
– 6-Week Change in Strength Index:-43.746.8-5.2


Dow Jones Mini Futures:

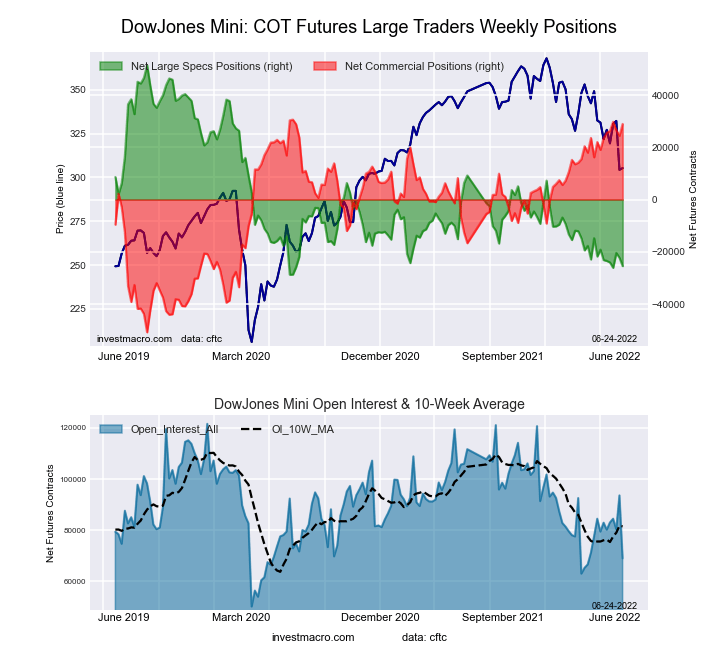
Dow Jones Mini Futures COT ChartThe Dow Jones Mini large speculator standing this week came in at a net position of -25,473 contracts in the data reported through Tuesday. This was a weekly decline of -3,184 contracts from the previous week which had a total of -22,289 net contracts.

This week’s current strength score (the trader positioning range over the past three years, measured from 0 to 100) shows the speculators are currently Bearish-Extreme with a score of 4.1 percent. The commercials are Bullish-Extreme with a score of 98.0 percent and the small traders (not shown in chart) are Bearish-Extreme with a score of 19.9 percent.

Dow Jones Mini Futures StatisticsSPECULATORSCOMMERCIALSSMALL TRADERS
– Percent of Open Interest Longs:14.969.815.1
– Percent of Open Interest Shorts:51.827.920.1
– Net Position:-25,47328,937-3,464
– Gross Longs:10,31048,16610,418
– Gross Shorts:35,78319,22913,882
– Long to Short Ratio:0.3 to 12.5 to 10.8 to 1
NET POSITION TREND:
– Strength Index Score (3 Year Range Pct):4.198.019.9
– Strength Index Reading (3 Year Range):Bearish-ExtremeBullish-ExtremeBearish-Extreme
NET POSITION MOVEMENT INDEX:
– 6-Week Change in Strength Index:-2.96.6-16.3


Nasdaq Mini Futures:

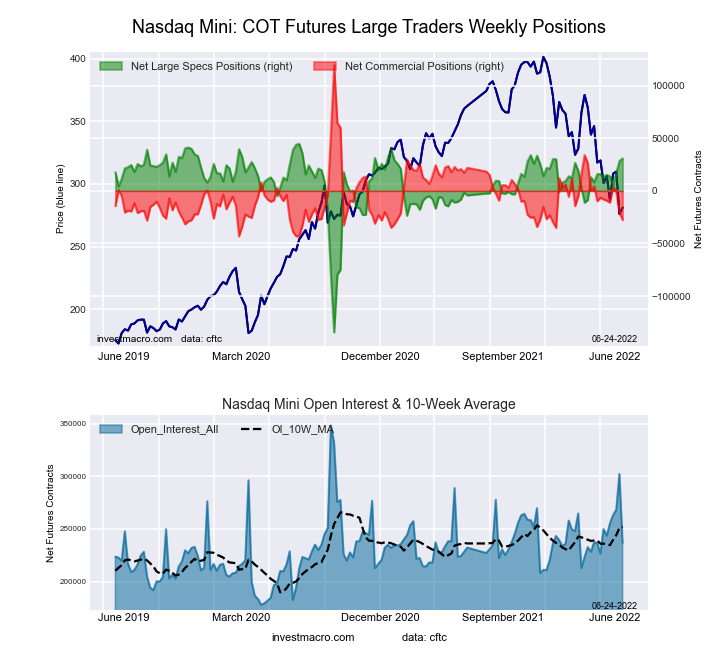
Nasdaq Mini Futures COT ChartThe Nasdaq Mini large speculator standing this week came in at a net position of 30,806 contracts in the data reported through Tuesday. This was a weekly lift of 2,404 contracts from the previous week which had a total of 28,402 net contracts.

This week’s current strength score (the trader positioning range over the past three years, measured from 0 to 100) shows the speculators are currently Bullish-Extreme with a score of 92.2 percent. The commercials are Bearish-Extreme with a score of 9.5 percent and the small traders (not shown in chart) are Bearish with a score of 41.9 percent.

Nasdaq Mini Futures StatisticsSPECULATORSCOMMERCIALSSMALL TRADERS
– Percent of Open Interest Longs:35.046.916.3
– Percent of Open Interest Shorts:22.058.517.7
– Net Position:30,806-27,586-3,220
– Gross Longs:82,888110,91338,577
– Gross Shorts:52,082138,49941,797
– Long to Short Ratio:1.6 to 10.8 to 10.9 to 1
NET POSITION TREND:
– Strength Index Score (3 Year Range Pct):92.29.541.9
– Strength Index Reading (3 Year Range):Bullish-ExtremeBearish-ExtremeBearish
NET POSITION MOVEMENT INDEX:
– 6-Week Change in Strength Index:9.7-12.04.4


Russell 2000 Mini Futures:

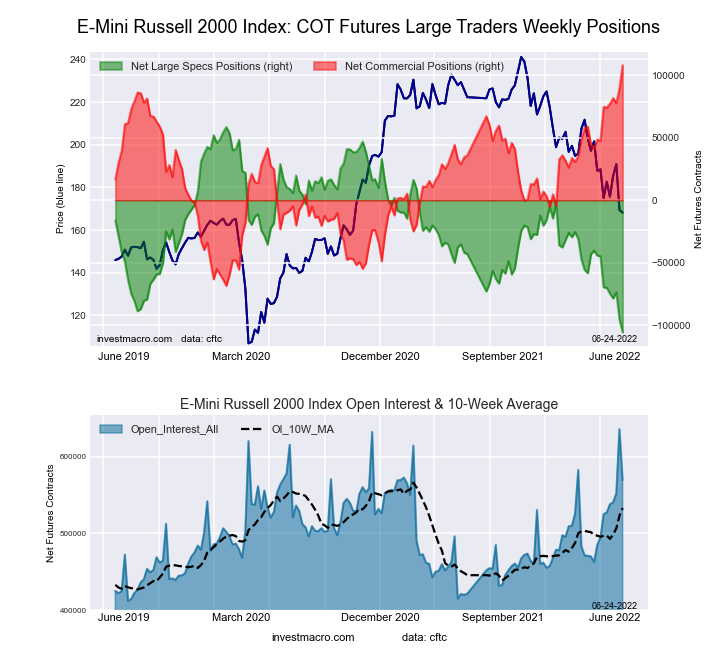
Russell 2000 Mini Futures COT ChartThe Russell 2000 Mini large speculator standing this week came in at a net position of -105,596 contracts in the data reported through Tuesday. This was a weekly reduction of -10,350 contracts from the previous week which had a total of -95,246 net contracts.

This week’s current strength score (the trader positioning range over the past three years, measured from 0 to 100) shows the speculators are currently Bearish-Extreme with a score of 0.0 percent. The commercials are Bullish-Extreme with a score of 100.0 percent and the small traders (not shown in chart) are Bearish with a score of 20.4 percent.

Russell 2000 Mini Futures StatisticsSPECULATORSCOMMERCIALSSMALL TRADERS
– Percent of Open Interest Longs:7.188.33.3
– Percent of Open Interest Shorts:25.669.33.7
– Net Position:-105,596107,890-2,294
– Gross Longs:40,382502,81219,004
– Gross Shorts:145,978394,92221,298
– Long to Short Ratio:0.3 to 11.3 to 10.9 to 1
NET POSITION TREND:
– Strength Index Score (3 Year Range Pct):0.0100.020.4
– Strength Index Reading (3 Year Range):Bearish-ExtremeBullish-ExtremeBearish
NET POSITION MOVEMENT INDEX:
– 6-Week Change in Strength Index:-21.918.98.0


Nikkei Stock Average (USD) Futures:

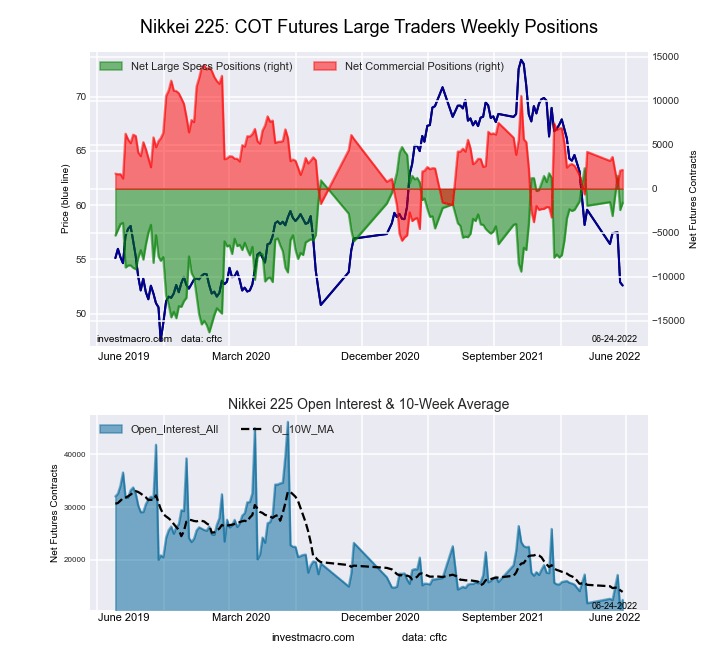
Nikkei Stock Average (USD) Futures COT ChartThe Nikkei Stock Average (USD) large speculator standing this week came in at a net position of -1,592 contracts in the data reported through Tuesday. This was a weekly increase of 821 contracts from the previous week which had a total of -2,413 net contracts.

This week’s current strength score (the trader positioning range over the past three years, measured from 0 to 100) shows the speculators are currently Bullish with a score of 69.9 percent. The commercials are Bearish with a score of 40.3 percent and the small traders (not shown in chart) are Bearish with a score of 21.5 percent.

Nikkei Stock Average Futures StatisticsSPECULATORSCOMMERCIALSSMALL TRADERS
– Percent of Open Interest Longs:25.356.817.7
– Percent of Open Interest Shorts:38.139.522.1
– Net Position:-1,5922,139-547
– Gross Longs:3,1307,0262,194
– Gross Shorts:4,7224,8872,741
– Long to Short Ratio:0.7 to 11.4 to 10.8 to 1
NET POSITION TREND:
– Strength Index Score (3 Year Range Pct):69.940.321.5
– Strength Index Reading (3 Year Range):BullishBearishBearish
NET POSITION MOVEMENT INDEX:
– 6-Week Change in Strength Index:-18.614.014.3


MSCI EAFE Mini Futures:

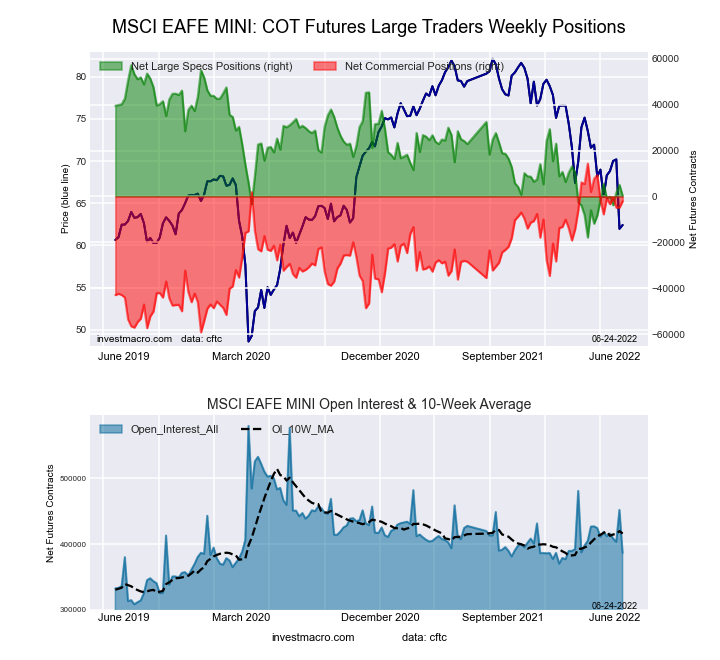
MSCI EAFE Mini Futures COT ChartThe MSCI EAFE Mini large speculator standing this week came in at a net position of 196 contracts in the data reported through Tuesday. This was a weekly decrease of -4,840 contracts from the previous week which had a total of 5,036 net contracts.

This week’s current strength score (the trader positioning range over the past three years, measured from 0 to 100) shows the speculators are currently Bearish with a score of 24.1 percent. The commercials are Bullish with a score of 77.7 percent and the small traders (not shown in chart) are Bearish with a score of 35.3 percent.

MSCI EAFE Mini Futures StatisticsSPECULATORSCOMMERCIALSSMALL TRADERS
– Percent of Open Interest Longs:4.992.71.7
– Percent of Open Interest Shorts:4.893.21.2
– Net Position:196-2,0761,880
– Gross Longs:18,931358,1726,538
– Gross Shorts:18,735360,2484,658
– Long to Short Ratio:1.0 to 11.0 to 11.4 to 1
NET POSITION TREND:
– Strength Index Score (3 Year Range Pct):24.177.735.3
– Strength Index Reading (3 Year Range):BearishBullishBearish
NET POSITION MOVEMENT INDEX:
– 6-Week Change in Strength Index:-7.17.7-3.4


Article By InvestMacroReceive our weekly COT Reports by Email

*COT Report: The COT data, released weekly to the public each Friday, is updated through the most recent Tuesday (data is 3 days old) and shows a quick view of how large speculators or non-commercials (for-profit traders) were positioned in the futures markets.

The CFTC categorizes trader positions according to commercial hedgers (traders who use futures contracts for hedging as part of the business), non-commercials (large traders who speculate to realize trading profits) and nonreportable traders (usually small traders/speculators) as well as their open interest (contracts open in the market at time of reporting).See CFTC criteria here.
Who (or What) Is Really in Charge of Bitcoin’s Price Swings?

Bitcoin lost three-quarters of its value since November. “Market fundamentals” have lost control of its trend. But something else has been at the wheel the whole time.

By Elliott Wave International

I’m not ashamed to admit I have the technological intelligence of an Eggo waffle. So, when my computer bugged out the other day, I called the IT department at work. The tech wizard on the other end showed me to a webpage where I had to click a box that read: “Consent to Control.” From that point, the IT guy was able to hack into my laptop, find the source of the glitch, and remedy the problem.

As I sat there watching my cursor move around the monitor on its own, clicking tab after tab as if by some phantomlike force, I thought,

“Holy moly, this is the virtual screenshare of mainstream financial wisdom.”

Summarized as such: External forces known as “market fundamentals” operate prices remotely. Positive fundamentals cause the price “cursor” to rise, while negative news and events trigger selloffs. And investors? They have little choice but to “consent” to this outside control.

At least, that’s how it’s supposed to work.

In reality, however, this news-driven model of market behavior is far from perfect. Markets regularly ignore their “fundamentals” like a Kardashian to the hired help — and move completely opposite them.

Take, for instance, a little-known (if you were born yesterday) cryptocurrency called Bitcoin. Last October-early November, Bitcoin had clocked a meteoric rise to record highs. And, according to the popular pundits, the “fundamentals” controlling Bitcoin were pointing up, up and away!

Here, these news items from the time recapture the rose-colored Bitcoin glasses:

Safer than the ultimate safe haven, from Republic World on October 12:

“Investors Preferring Bitcoin Over Gold As Better Hedge Against Inflation: JP Morgan Chase.”

“Bitcoin’s ability to rally despite China’s ban on crypto transactions signifies ‘one of the most bullish signals ever’

“Nearly 50% of the computing power (called hash rate) of the bitcoin blockchain, pulled the plug, packed up, and relocated to another country in a few months. And no one noticed! It signals an incredibly resilient system.”

From MarketWatch on October 18:

“Everything is about to start breaking out now and we’ve seen it before. We know the pattern…this October, November, December, January, February, March is going to be the point where it’s almost impossible to lose money by owning anything.”

And, from CNBC on November 1, one crypto expert lists a bevy of bullish forces — “a super progressive administration,” “regularity clarity,” “support from Congress,” “Bitcoin mining moving to the U.S.,” and “passed fears around the China crackdown” — set to buoy Bitcoin… indefinitely!

And yet, despite the most bullish fundamental signals in Bitcoin’s history and the “impossibility” of loss — the crypto plummeted 74.5% from its intraday high of 69000 on November 10, to its intraday low of 17,567.45 on June 19.

How come?

Here’s the answer: Despite what mainstream experts might say, “fundamentals” did NOT lose control over Bitcoin. They never had that control to begin with.

The Elliott Wave Principle offers this answer for what did: investor psychology, which unfolds as Elliott wave patterns directly on market price charts. And, on October 27, 2021, our Trader’s Classroom presented a special video episode on Bitcoin. In it, editor Jeffrey Kennedy was able to label price action as a very mature B wave rally of a larger expanded flat.

Meaning, the stage was set for an imminent crash. From Jeffrey’s analysis on October 27:

“Under this scenario, we may push a bit higher here and have one more run up to the $70,000 handle. And at that point, going from near $70, we’re ready for a $50,000 a dollar drop all the way back to $20,000 a coin.”

“This wave count fits and adheres to all the rules and guidelines of the Wave Principle.”

This next chart captures what followed: Bitcoin did push up one more time to its November 10 peak, and then proceeded to collapse below $20K area as Jeffrey’s bearish analysis anticipated.

Right now, there is no market sector more volatile than cryptocurrencies. In Jeffrey Kennedy’s own words: “You’re swimming with sharks here and you need to be able to assume and be okay with massive risk when you play the space.”

Join two seasoned instructors on June 28 at 11 AM Eastern/NY time for a hands-on 1-hour lesson on how to spot Elliott wave setups in cryptos — and how to capitalize on them. After just 1 hour, come away equipped to spot and execute crypto wave setups far better than before. Grab your free seat now.

Japanese Candlesticks Analysis 24.06.2022 (USDCAD, AUDUSD, USDCHF)

Article By RoboForex.com

USDCAD, “US Dollar vs Canadian Dollar”

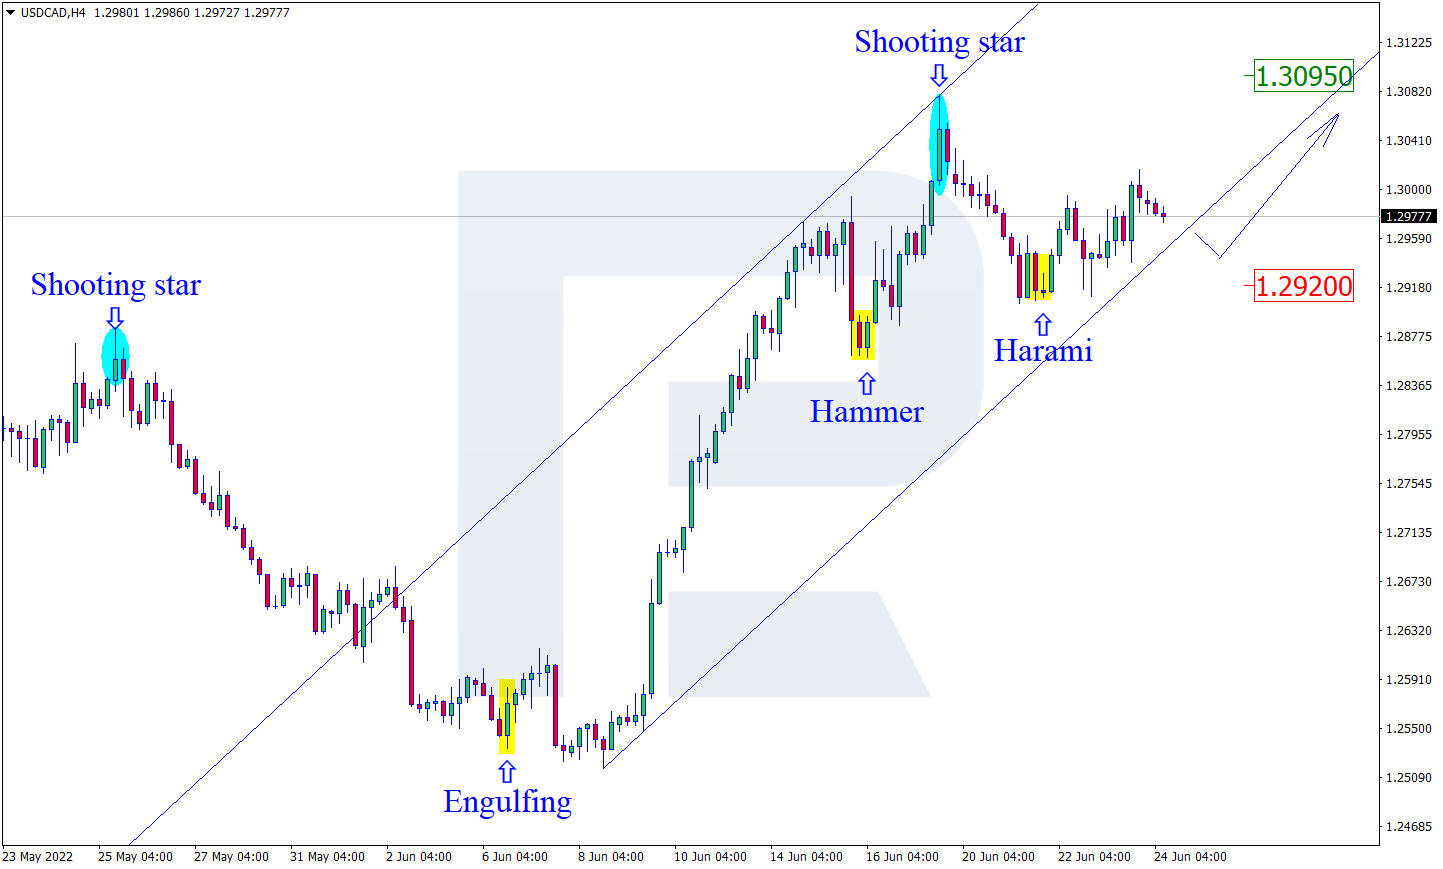
As we can see in the H4 chart, after forming a Harami reversal pattern close to the support level, USDCAD may reverse in the form of another ascending impulse. In this case, the upside target may be the resistance area at 1.3095. Later, the market may break this level and continue growing. However, an alternative scenario implies that the asset may correct to reach 1.2920 first and then resume trading upwards.

USDCAD
Risk Warning: the result of previous trading operations do not guarantee the same results in the future

AUDUSD, “Australian Dollar vs US Dollar”

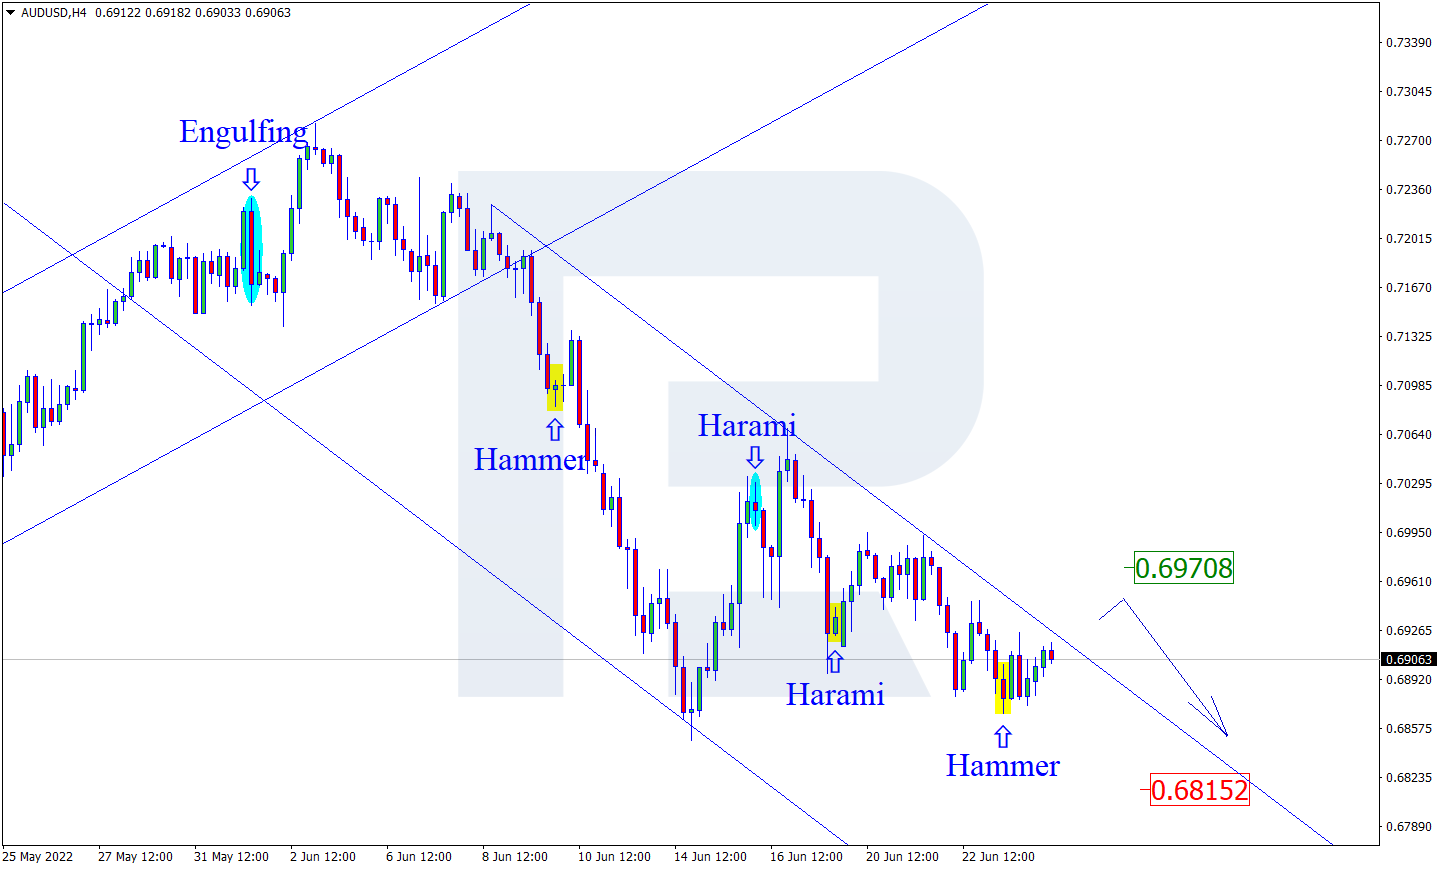
As we can see in the H4 chart, AUDUSD has formed a Hammer reversal pattern near the support level. At the moment, the asset is reversing and forming a new rising impulse. In this case, the upside target may be the resistance level at 0.6970. After testing the level, the price may rebound from it and resume the descending tendency. At the same time, the opposite scenario implies that the price may fall to reach 0.6815 and continue the downtrend without any corrections.

AUDUSD
Risk Warning: the result of previous trading operations do not guarantee the same results in the future

USDCHF, “US Dollar vs Swiss Franc”

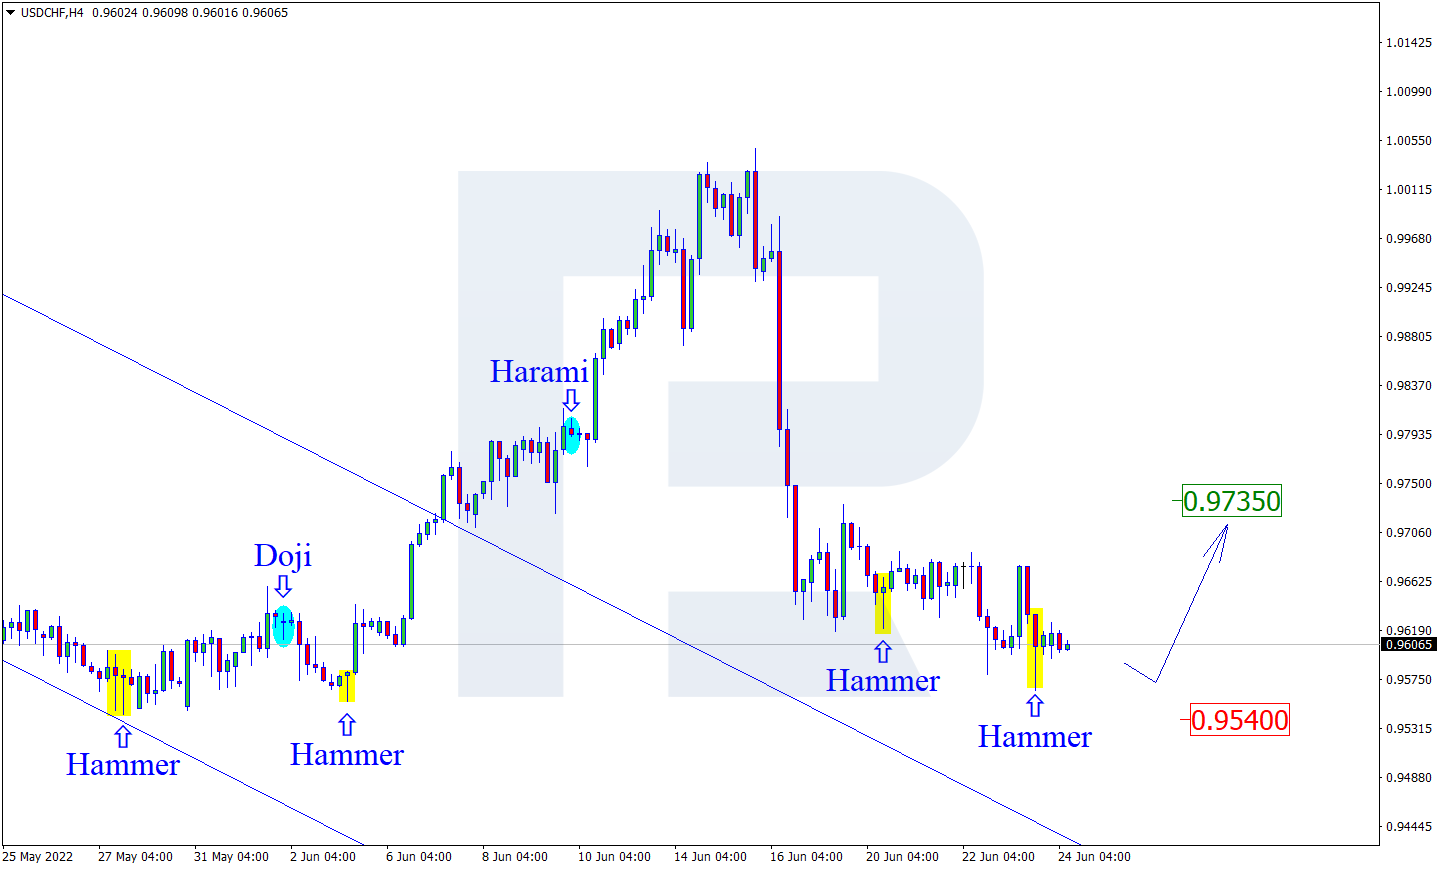
As we can see in the H4 chart, after testing the support area, the pair has formed several reversal patterns, for example, Hammer. At the moment, USDCHF may reverse in the form of a new ascending impulse. In this case, the upside target may be at 0.9735. After testing the resistance level, the price may break it and continue trading upwards. Still, there might be an alternative scenario, according to which the asset may fall to reach 0.9540 and continue the ascending tendency only after the correction.

USDCHF

Article By RoboForex.com

Attention!
Forecasts presented in this section only reflect the author’s private opinion and should not be considered as guidance for trading. RoboForex LP bears no responsibility for trading results based on trading recommendations described in these analytical reviews.

The cryptocurrency market digest (BTC, SOL, BNB). Overview for 24.06.2022

Article By RoboForex.com

On Friday, the BTC is consolidating at $21,006.

Yesterday’s trading session was the most successful for the BTC lately. The major cryptocurrency added 5.6% following the US indices and securities growth. There is a correlation between S&P 500/NASDAQ and the BTC, which is quite clearly seen right now.

From the technical point of view, the focus is now switching to $21,900. If bulls break this level and fix above it, the next target will be at $22,900. In theory, after attacking $22,000, the asset may head towards $24,000. The closest meaningful support is at $19,700.

So, the key factor for making any decisions related to the crypto market is the dynamics of American indices. It is noteworthy that the fundamental background hasn’t offered any clear signals for a long time. Any significant BTC-related news is about a year away, the ETH is still struggling with the Ethereum 2.0 network, meme coins are no longer as popular as they were and there is nothing really topical to replace them.

Top 10: SOL and BNB are in demand

In the last 24 hours, the Top 10 coins have demonstrated inspiring results. The best of them are SOL (+7.71%) and BNB (+6.89%). Also noteworthy is ETH (+5.69%). DOGE (+2.33%) and ADA (+3.96%) were a bit weaker.

A bridge between BTC and Avalanche

Ava Labs launched a cross-chain bridge to connect BTC and Avalanche. Users of the networks now can transfer cryptos without any third parties. The bridge is based on Intel SGX, a new feature that supports cross-chain transactions.

Binance: partnership with Ronaldo

A Portuguese footballing legend Cristiano Ronaldo and Binance announced an exclusive, multi-year NFT partnership. It is assumed that through cooperation with Ronaldo the company will be able to more effectively introduce the Web3 ecosystem to users and attract attention to NFT campaigns.

Article By RoboForex.com

Attention!
Forecasts presented in this section only reflect the author’s private opinion and should not be considered as guidance for trading. RoboForex LP bears no responsibility for trading results based on trading recommendations described in these analytical reviews.

Week Ahead: Euro to climb on more aggressive ECB rate hike bets?

By ForexTime 

Last week, we cited the possibility of the US dollar falling as recession fears mount.

At the time of writing, the benchmark dollar index (DXY) is set for a weekly decline, ending a run of three consecutive weekly gains. The softer greenback has in turn allowed EURUSD to resurface back above 1.05.

The bloc’s currency will be in focus going into the second half of 2022, amid these scheduled data releases and events in the coming week:

Monday, June 27

  • CNH: China May industrial profits
  • US crude: EIA weekly US crude inventories (delayed from last Thursday)

Tuesday, June 28

  • GBP: BOE Deputy Governor Jonathan Cunliffe speech
  • USD: San Francisco Fed President Mary Daly speech; US June consumer confidence

Wednesday, June 29

  • JPY: Japan May retail sales, June consumer confidence
  • AUD: Australia May retail sales
  • ECB panel featuring ECB President Christine Lagarde, Fed Chair Jerome Powell, and BOE Governor Andrew Bailey
  • EUR: Eurozone economic confidence; Germany June inflation
  • USD: US 1Q GDP (third print); speeches by Cleveland Fed President Loretta Mester and St. Louis Fed President James Bullard
  • US crude: EIA weekly US crude inventories

Thursday, June 30

  • JPY: Japan May industrial production
  • NZD: New Zealand June business confidence
  • CNH: China June PMIs
  • GBP: UK 1Q GDP (final print)
  • EUR: Eurozone May unemployment
  • Brent: OPEC+ meeting
  • USD: US weekly initial jobless claims, May personal income/spending, May PCE deflator

Friday, July 1

  • NZD: New Zealand June consumer confidence
  • AUD: Australia June manufacturing PMI
  • JPY: Japan June Tokyo CPI, May jobless rate
  • CNH: China June Caixin manufacturing PMI
  • EUR: Eurozone June CPI and manufacturing PMI
  • USD: US June ISM manufacturing, June S&P Global manufacturing PMI

The Eurozone’s incoming unemployment and inflation data are set to be interpreted within the context of the European Central Bank’s plans to raise interest rates.

As things stand, the ECB has already well-telegraphed to the markets its intentions for a 25-basis point rate hike in July. The ECB could then trigger a larger 50bps hike at its following meeting in September.

Those two hikes alone should bring the curtains down on the ECB’s negative interest rates regime, with markets expecting 200 basis points in hikes between now and March 2023.

However, the ECB may be forced to front-load its rate hikes, just like the Fed is doing, if the Eurozone’s inflation print comes in much hotter than expected.

The median estimate for the June CPI print is 8.3%, which would be a fresh record high for the Eurozone, and also higher than May’s 8.1% year-on-year print.

And if its unemployment rate continues to show resilience, with markets expecting the May print to be 10 basis points lower than April’s 6.8% print, that could even pave the way for ECB officials to become even more aggressive in its battle against record-high inflation!

EURUSD eyes 50-day SMA resistance and 1.035 support

If this narrative holds and markets ramp up their bets for a more aggressive ECB, that could help EURUSD retest its 50-day moving average as the immediate resistance level, currently hovering around the 1.06 mark.

Otherwise, a lower EURUSD could bring the 1.035 support region back into focus, having offered the world’s most popular currency pair two chances to rebound since May.


Overall, EURUSD is expected to continue being guided lower by its 50-day SMA, as has been the case over the past 12 months.

The euro’s upside remains capped by two major themes:

  • Recession risks are still clouding the Eurozone’s economic outlook, noting that the Russia-Ukraine war is still raging off the bloc’s eastern borders.
  • Fragmentation risks also weigh heavily on the euro, and the ECB’s new anti-crisis policy tool must be able to convince the markets of its effectiveness. Otherwise, the yields disparity could run out of control and trigger unruly declines in EURUSD.


Of course, the US dollar will have a major say on EURUSD’s performance. If the prospects of a US recession loom larger, that could translate into more moderation for the buck and more relief for the euro.

And with ECB President Christine Lagarde potentially offering more policy signals side-by-side with Fed Chair Jerome Powell mid-week, that could offer fresh catalysts for the EURUSD as we head into July.

Still, the ECB has to deliver on the market’s hawkish rate hike bets while keeping the region’s fragmentation risks at bay, in order to sustain hopes of a recovery for the euro.


Forex-Time-LogoArticle by ForexTime

ForexTime Ltd (FXTM) is an award winning international online forex broker regulated by CySEC 185/12 www.forextime.com

The Analytical Overview of the Main Currency Pairs on 2022.06.24

By JustForex

The EUR/USD currency pair

Technical indicators of the currency pair:
  • Prev Open: 1.0564
  • Prev Close: 1.0520
  • % chg. over the last day: -0.42%

German and French PMI data showed that the Eurozone economy is starting to show signs of a slowdown. In Germany, the manufacturing PMI decreased from 54.8 to 52 while the services PMI dropped from 55 to 52.4. In France, the manufacturing PMI decreased from 58.3 to 54.4, and the services PMI declined from 54.6 to 51. Typically, a PMI falling below 50 is a sign of recession in which the central bank raises interest rates. At that time, Fed spokesman Kazimir said yesterday that some Eurozone countries might face a short-term recession.

Trading recommendations
  • Support levels: 1.0408, 1.0379
  • Resistance levels: 1.0555, 1.0611, 1.0680, 1.0723

From the technical point of view, the trend on the EUR/USD currency pair on the hourly time frame is bearish. The price forms a wide corridor, and the MACD indicator has become inactive. Under such market conditions, sell deals can be considered from the resistance level of 1.0555 or the upper border of the flat, but only after the additional confirmation. A price move above 1.0611 will change the priority. Buy trades are best to look for on intraday time frames from the support level of 1.0408 or the lower border of the flat, but only with confirmation and short targets.

Alternative scenario: if the price breaks out through the 1.0611 resistance level and fixes above, the uptrend will likely resume.

EUR/USD
News feed for 2022.06.24:
  • – Eurozone German Ifo Business Climate Index (m/m) at 11:00 (GMT+3);
  • – Eurozone EU Leaders Summit at 13:00 (GMT+3);
  • – US FOMC Bullard Speaks at 14:30 (GMT+3);
  • – US New Home Sales (m/m) at 17:00 (GMT+3).

The GBP/USD currency pair

Technical indicators of the currency pair:
  • Prev Open: 1.2263
  • Prev Close: 1.2260
  • % chg. over the last day: -0.02%

The UK Manufacturing PMI declined last month from 54.6 to 53.4, while the service sector remained at 53.4. Despite all the media talk about the dire state of the UK economy, the PMI shows that business activity in the UK is higher than in the Eurozone.

Trading recommendations
  • Support levels: 1.2238, 1.2093, 1.1974
  • Resistance levels: 1.2422, 1.2470, 1.2523, 1.2629

From the technical point of view, the trend on the GBP/USD currency pair on the hourly time frame is bearish. The situation is very similar to the euro. The price forms a wide corridor, while the MACD indicator shows no activity. Under such market conditions, sell deals can be considered from the resistance level of 1.2422 or the upper border of the flat, but only after the additional confirmation. Buy trades are best to look for on intraday time frames from the support level of 1.2238 or the lower border of the flat, but only with confirmation and short targets.

Alternative scenario: if the price breaks out through the 1.2422 resistance level and fixes above, the uptrend will likely resume.

GBP/USD
News feed for 2022.06.24:
  • – UK Retail Sales (m/m) at 09:00 (GMT+3).

The USD/JPY currency pair

Technical indicators of the currency pair:
  • Prev Open: 136.21
  • Prev Close: 134.96
  • % chg. over the last day: -0.93%

The nationwide core Consumer Price Index was 2.1% for the second month in a row and again exceeded the Bank of Japan’s target level. This data challenges the Bank of Japan’s view that the recent price increase is temporary and does not require a withdrawal of monetary stimulus. Such sentiment provided a brief boost to the Japanese yen. But with wage growth slowing, many analysts expect the Bank of Japan to remain on a soft monetary policy rather than fighting inflation by raising interest rates.

Trading recommendations
  • Support levels: 134.10, 133.35, 131.67, 131.00, 130.12, 129.48, 128.76
  • Resistance levels: 135.23, 135.77, 136.66

The medium-term trend on the USD/JPY currency pair is bullish, but the price corrected today to the moving average lines and canceled the final balance. This is a sign of buyers’ weakness. The MACD indicator is in the negative zone. Under such market conditions, buy trades can be considered from the support level of 134.10 or 133.35, but with confirmation. A resistance level of 135.23 is good for sell deals, but only with additional confirmation and short targets.

Alternative scenario: If the price fixes below 133.35, the downtrend will likely resume.

USD/JPY
News feed for 2022.06.24:
  • – Japan National Core Consumer Price Index at 02:30 (GMT+3).

The USD/CAD currency pair

Technical indicators of the currency pair:
  • Prev Open: 1.2945
  • Prev Close: 1.2995
  • % chg. over the last day: +0.39%

The Canadian dollar is a commodity currency, so it depends not only on the USD index dynamics but also on the oil quotes. The dollar index yesterday strengthened after the speech of Jerome Powell in front of Congress, while oil quotes went down. As a result, the Canadian dollar lost some ground. But worth noting that the Bank of Canada is on its way to raising interest rates, and the latest inflation data in Canada showed that inflation is not stopping. Therefore, on expectations of an aggressive rate hike at the next meeting, the Canadian dollar may get a boost soon.

Trading recommendations
  • Support levels: 1.2966, 1.2893, 1.2815, 1.2709, 1.2618, 1.2578, 1.2510
  • Resistance levels: 1.3068

In terms of technical analysis, the trend on the USD/CAD currency pair is bullish. The MACD indicator has become positive, and the buyers are showing their strength again. Under such market conditions, it is better to look for buy deals in the lower time frames from the support level of 1.2966. For sell deals, it is better to consider the resistance level of 1.3068, but it is also better with confirmation and short targets.

Alternative scenario: if the price breaks through and consolidates below the 1.2815 support level, the downtrend will likely resume.

USD/CAD
There is no news feed for today.

By JustForex


This article reflects a personal opinion and should not be interpreted as an investment advice, and/or offer, and/or a persistent request for carrying out financial transactions, and/or a guarantee, and/or a forecast of future events.

Inflation in Japan is holding above target. European PMI data are disappointing

By JustForex

On Thursday, US central bank governor Jerome Powell said to the House of Representatives that The Federal Reserve’s commitment to curbing 40-year inflation is “unconditional,” but it carries the risk of rising unemployment. On Wednesday, Powell told the US Senate Banking Committee that the Fed is not trying to trigger a recession but is “certainly possible” due to global events beyond its control, particularly the effects of the war in Ukraine and the COVID-19 pandemic. At the same time, Powell expects US economic growth to accelerate in the year’s second half.

On Thursday, another Fed official, Michelle Bowman, said that she supports a 75 basis point rate hike in July, followed by a 50 basis point increase at the next few meetings. That statement coincides with Reuters polls. Economists polled by Reuters this week forecast that the Fed will hold another 75 basis point rate hike next month, followed by a 0.5% hike in September.

New jobless claims fell last week from 231,000 to 229,000, while the key PMI for manufacturing and service sector activity fell to 52.5 (from 57) and 51.6 (from 53.4), respectively.

As the stock market closed yesterday, the Dow Jones Index (US30) increased by 0.64% and the S&P 500 Index (US500) added 0.95%. The technology index NASDAQ (US100) jumped by 1.62%.

Stock markets in Europe were mostly trading lower yesterday. German DAX (DE30) lost 1.76%, French CAC 40 (FR40) decreased by 0.56%, Spanish IBEX 35 (ES35) fell by 0.48%, British FTSE 100 (UK100) was 0.97% down.

German and French PMI data showed that the Eurozone economy is starting to show signs of a slowdown. In Germany, the manufacturing PMI decreased from 54.8 to 52 while the services PMI dropped from 55 to 52.4. In France, the manufacturing PMI decreased from 58.3 to 54.4, and the services PMI declined from 54.6 to 51. Typically, a PMI falling below 50 is a sign of recession in which the central bank raises interest rates. At that time, Fed spokesman Kazimir said yesterday that some Eurozone countries might face a short-term recession.

The Norwegian Central Bank surprised markets by raising its interest rate by 50 bps from 0.75% to 1.25%. Concerns about rising inflation in a tight labor market were the reasons for the scale of the increase. Norway’s inflation rate was 5.7% y/y in May versus 5.4% y/y in April. It is the highest level since December 1988.

Ukraine and Moldova officially received candidate status for EU accession.

The Russian State Duma called for bombing the US Embassy in Kyiv because of the deliveries of MLRSs to Ukraine. Such a statement was made by the deputy chairman of the Duma committee for defense, Yuriy Shvytkin. He said that the United States “is bringing World War III closer” by supplying HIMARS multiple-launch rocket systems. At the same time, Estonian Prime Minister Kaja Kallas said that in case of a Russian invasion, Estonia would be wiped off the face of the earth because of the ineffective NATO plan to defend the Baltic states. She called for sending at least 20,000 to 25,000 NATO soldiers to each Baltic country.

Natural gas futures fell more than 5% yesterday on the news of reserves. US domestic natural gas inventories increased by 74 billion cubic feet over the week. Meanwhile, total natural gas in storage is 2.169 trillion cubic feet, 305 billion cubic feet less than a year ago, and 331 billion cubic feet below the five-year average.

Official weekly estimates of US oil inventories had to be released on Thursday, but technical problems delayed those numbers until next week, the US Energy Information Administration said. Russia continues to find alternative buyers for its oil, with China and India among the biggest buyers. China’s crude oil imports from Russia increased by 55% in May from a year earlier to a record high.

Asian markets closed yesterday in green territory. Japan’s Nikkei 225 (JP225) gained 0.08%, Hong Kong’s Hang Seng (HK50) added 1.26%, and Australia’s S&P/ASX 200 (AU200) closed with a gain of 0.31%.

The nationwide core Consumer Price Index was 2.1% for the second month in a row and again exceeded the Bank of Japan’s target level. This data challenges the Bank of Japan’s view that the recent price increase is temporary and does not require a withdrawal of monetary stimulus. Such sentiment provided a brief boost to the Japanese yen. But with wage growth slowing, many analysts expect the Bank of Japan to remain on a soft monetary policy rather than fighting inflation by raising interest rates.

Main market quotes:

S&P 500 (F) (US500) 3,795.72 +35.83 (+0.95%)

Dow Jones (US30) 30,677.36 +194.23 (+0.64%)

DAX (DE40) 12,912.59 −231.69 (−1.76%)

FTSE 100 (UK100) 7,020.45 −68.77 (−0.97%)

USD Index 104.35 +0.16 (+0.15%)

Important events for today:
  • – Japan National Core Consumer Price Index at 02:30 (GMT+3);
  • – UK Retail Sales (m/m) at 09:00 (GMT+3);
  • – Eurozone German Ifo Business Climate Index (m/m) at 11:00 (GMT+3);
  • – Eurozone EU Leaders Summit at 13:00 (GMT+3);
  • – Australia RBA Governor Lowe Speaks at 14:30 (GMT+3);
  • – US New Home Sales (m/m) at 17:00 (GMT+3).

By JustForex


This article reflects a personal opinion and should not be interpreted as an investment advice, and/or offer, and/or a persistent request for carrying out financial transactions, and/or a guarantee, and/or a forecast of future events.