
By InvestMacro | COT | Data Tables | COT Leaders | Downloads | COT Newsletter
Here are the latest charts and statistics for the Commitment of Traders (COT) data published by the Commodities Futures Trading Commission (CFTC).
The latest COT data is updated through Tuesday July 5th and shows a quick view of how large traders (for-profit speculators and commercial entities) were positioned in the futures markets.
The stock market speculator bets were mostly lower for a second straight week this week as three out of the eight stock markets we cover had higher positioning this week while five markets had lower contracts.
Leading the gains for stock markets was the Nasdaq Mini (6,705 contracts) with the VIX (4,068 contracts) and Dow Jones Industrial Average Mini (1,990 contracts) also showing positive weeks.
Meanwhile, leading the decreases in speculator bets this week were the S&P500 Mini (-44,456 contracts) and with MSCI EAFE Mini (-31,197 contracts), Russell 2000 Mini (-13,973 contracts), MSCI Emerging Markets Mini (-4,586 contracts) and the Nikkei 225 USD (-130 contracts) also registering lower bets on the week.
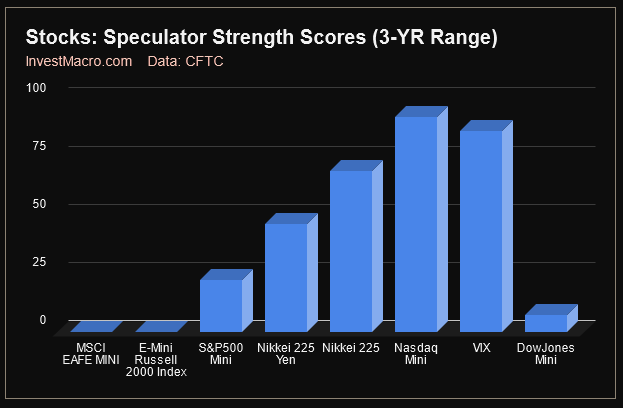
Strength scores (measuring the 3-Year range of Speculator positions, from 0 to 100 where above 80 is extreme bullish and below 20 is extreme bearish) show that the Nasdaq Mini (92.3 percent) is at the highest level of the stock markets currently followed by the VIX (86.4 percent). Both are in extreme bullish levels compared to the past three years of speculator sentiment. On the lower end, the Russell 2000 Mini (0 percent) and the MSCI EAFE Mini (0 percent) are in bearish-extreme levels and at their lowest level of positioning of the past three years.

Strength score trends (or move index, that calculate 6-week changes in strength scores) shows that the S&P500 Mini (-43.1 percent) and MSCI EAFE Mini (-37.5 percent) are leading the down-trending scores over the past six weeks. The Nasdaq Mini, meanwhile, leads the trends to the upside with a 9.6 percent trend change.
| Jul-05-2022 | OI | OI-Index | Spec-Net | Spec-Index | Com-Net | COM-Index | Smalls-Net | Smalls-Index |
|---|---|---|---|---|---|---|---|---|
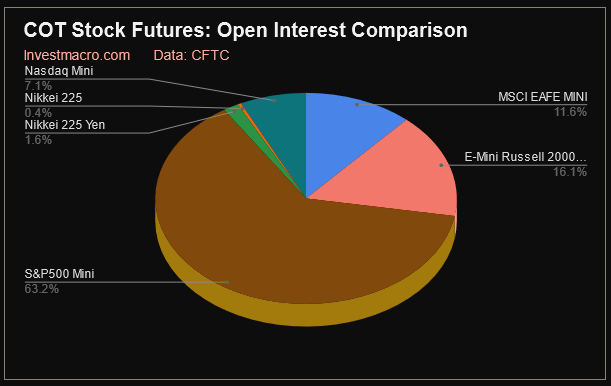
| S&P500-Mini | 2,309,241 | 8 | -183,682 | 22 | 221,625 | 100 | -37,943 | 18 |
| Nikkei 225 | 14,508 | 11 | -1,745 | 69 | 3,210 | 46 | -1,465 | 10 |
| Nasdaq-Mini | 259,449 | 48 | 30,895 | 92 | -25,919 | 11 | -4,976 | 38 |
| DowJones-Mini | 67,437 | 24 | -23,083 | 7 | 27,554 | 96 | -4,471 | 15 |
| VIX | 266,933 | 17 | -45,501 | 86 | 52,406 | 15 | -6,905 | 58 |
| Nikkei 225 Yen | 60,276 | 44 | 3,916 | 46 | 25,226 | 88 | -29,142 | 15 |
VIX Volatility Futures:
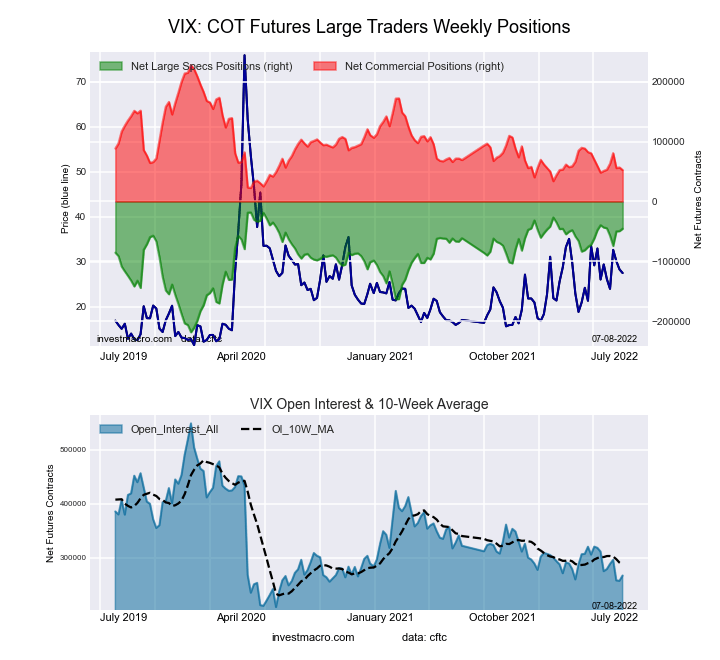 The VIX Volatility large speculator standing this week came in at a net position of -45,501 contracts in the data reported through Tuesday. This was a weekly lift of 4,068 contracts from the previous week which had a total of -49,569 net contracts.
This week’s current strength score (the trader positioning range over the past three years, measured from 0 to 100) shows the speculators are currently Bullish-Extreme with a score of 86.4 percent. The commercials are Bearish-Extreme with a score of 14.6 percent and the small traders (not shown in chart) are Bullish with a score of 57.9 percent.
| VIX Volatility Futures Statistics | SPECULATORS | COMMERCIALS | SMALL TRADERS |
| – Percent of Open Interest Longs: | 17.2 | 54.0 | 8.8 |
| – Percent of Open Interest Shorts: | 34.3 | 34.4 | 11.4 |
| – Net Position: | -45,501 | 52,406 | -6,905 |
| – Gross Longs: | 45,972 | 144,271 | 23,601 |
| – Gross Shorts: | 91,473 | 91,865 | 30,506 |
| – Long to Short Ratio: | 0.5 to 1 | 1.6 to 1 | 0.8 to 1 |
| NET POSITION TREND: | |||
| – Strength Index Score (3 Year Range Pct): | 86.4 | 14.6 | 57.9 |
| – Strength Index Reading (3 Year Range): | Bullish-Extreme | Bearish-Extreme | Bullish |
| NET POSITION MOVEMENT INDEX: | |||
| – 6-Week Change in Strength Index: | -1.0 | 0.7 | 2.3 |
S&P500 Mini Futures:
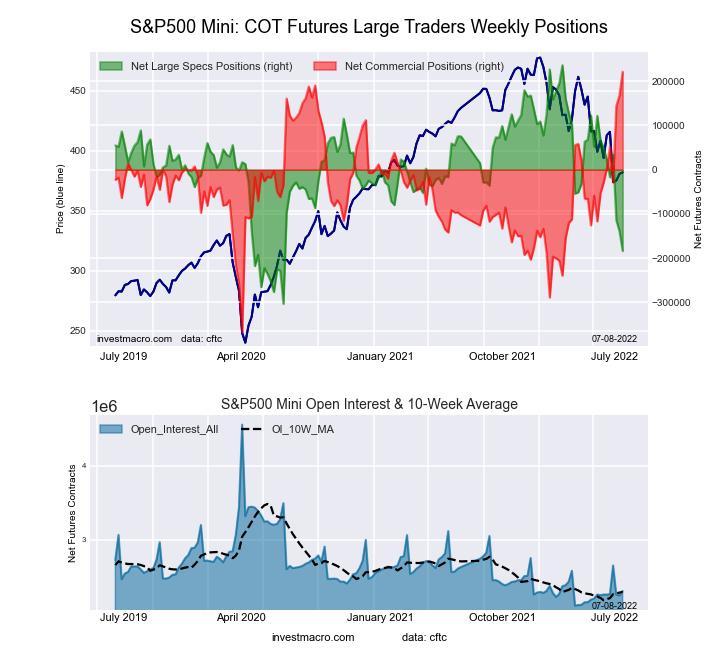 The S&P500 Mini large speculator standing this week came in at a net position of -183,682 contracts in the data reported through Tuesday. This was a weekly reduction of -44,456 contracts from the previous week which had a total of -139,226 net contracts.
This week’s current strength score (the trader positioning range over the past three years, measured from 0 to 100) shows the speculators are currently Bearish with a score of 22.2 percent. The commercials are Bullish-Extreme with a score of 100.0 percent and the small traders (not shown in chart) are Bearish-Extreme with a score of 18.4 percent.
| S&P500 Mini Futures Statistics | SPECULATORS | COMMERCIALS | SMALL TRADERS |
| – Percent of Open Interest Longs: | 10.3 | 77.6 | 9.9 |
| – Percent of Open Interest Shorts: | 18.2 | 68.0 | 11.5 |
| – Net Position: | -183,682 | 221,625 | -37,943 |
| – Gross Longs: | 237,370 | 1,791,046 | 227,663 |
| – Gross Shorts: | 421,052 | 1,569,421 | 265,606 |
| – Long to Short Ratio: | 0.6 to 1 | 1.1 to 1 | 0.9 to 1 |
| NET POSITION TREND: | |||
| – Strength Index Score (3 Year Range Pct): | 22.2 | 100.0 | 18.4 |
| – Strength Index Reading (3 Year Range): | Bearish | Bullish-Extreme | Bearish-Extreme |
| NET POSITION MOVEMENT INDEX: | |||
| – 6-Week Change in Strength Index: | -43.1 | 42.5 | -3.8 |
Dow Jones Mini Futures:
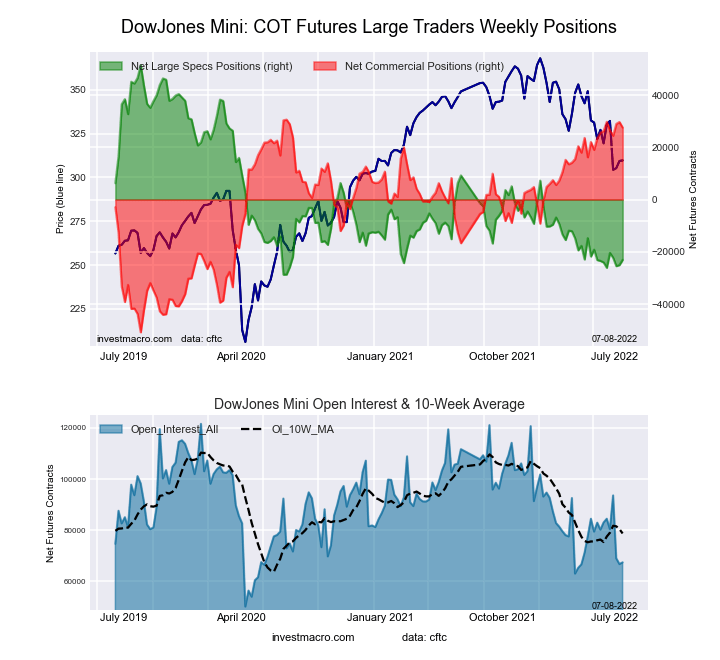 The Dow Jones Mini large speculator standing this week came in at a net position of -23,083 contracts in the data reported through Tuesday. This was a weekly advance of 1,990 contracts from the previous week which had a total of -25,073 net contracts.
This week’s current strength score (the trader positioning range over the past three years, measured from 0 to 100) shows the speculators are currently Bearish-Extreme with a score of 7.1 percent. The commercials are Bullish-Extreme with a score of 96.3 percent and the small traders (not shown in chart) are Bearish-Extreme with a score of 14.5 percent.
| Dow Jones Mini Futures Statistics | SPECULATORS | COMMERCIALS | SMALL TRADERS |
| – Percent of Open Interest Longs: | 16.4 | 67.4 | 15.3 |
| – Percent of Open Interest Shorts: | 50.6 | 26.5 | 22.0 |
| – Net Position: | -23,083 | 27,554 | -4,471 |
| – Gross Longs: | 11,053 | 45,425 | 10,349 |
| – Gross Shorts: | 34,136 | 17,871 | 14,820 |
| – Long to Short Ratio: | 0.3 to 1 | 2.5 to 1 | 0.7 to 1 |
| NET POSITION TREND: | |||
| – Strength Index Score (3 Year Range Pct): | 7.1 | 96.3 | 14.5 |
| – Strength Index Reading (3 Year Range): | Bearish-Extreme | Bullish-Extreme | Bearish-Extreme |
| NET POSITION MOVEMENT INDEX: | |||
| – 6-Week Change in Strength Index: | 1.2 | 1.6 | -12.2 |
Nasdaq Mini Futures:
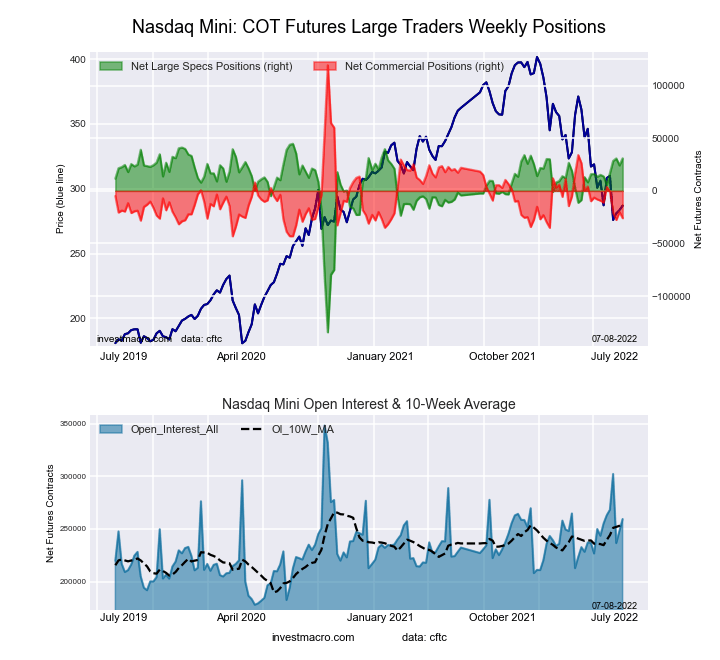 The Nasdaq Mini large speculator standing this week came in at a net position of 30,895 contracts in the data reported through Tuesday. This was a weekly increase of 6,705 contracts from the previous week which had a total of 24,190 net contracts.
This week’s current strength score (the trader positioning range over the past three years, measured from 0 to 100) shows the speculators are currently Bullish-Extreme with a score of 92.3 percent. The commercials are Bearish-Extreme with a score of 10.6 percent and the small traders (not shown in chart) are Bearish with a score of 38.3 percent.
| Nasdaq Mini Futures Statistics | SPECULATORS | COMMERCIALS | SMALL TRADERS |
| – Percent of Open Interest Longs: | 32.2 | 52.9 | 13.6 |
| – Percent of Open Interest Shorts: | 20.3 | 62.9 | 15.6 |
| – Net Position: | 30,895 | -25,919 | -4,976 |
| – Gross Longs: | 83,514 | 137,186 | 35,380 |
| – Gross Shorts: | 52,619 | 163,105 | 40,356 |
| – Long to Short Ratio: | 1.6 to 1 | 0.8 to 1 | 0.9 to 1 |
| NET POSITION TREND: | |||
| – Strength Index Score (3 Year Range Pct): | 92.3 | 10.6 | 38.3 |
| – Strength Index Reading (3 Year Range): | Bullish-Extreme | Bearish-Extreme | Bearish |
| NET POSITION MOVEMENT INDEX: | |||
| – 6-Week Change in Strength Index: | 9.6 | -9.1 | -4.8 |
Russell 2000 Mini Futures:
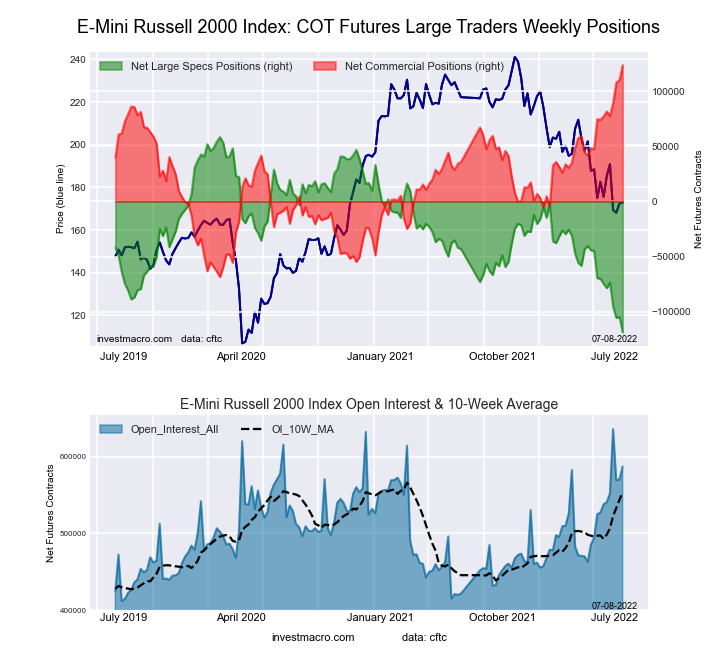 The Russell 2000 Mini large speculator standing this week came in at a net position of -118,593 contracts in the data reported through Tuesday. This was a weekly lowering of -13,973 contracts from the previous week which had a total of -104,620 net contracts.
This week’s current strength score (the trader positioning range over the past three years, measured from 0 to 100) shows the speculators are currently Bearish-Extreme with a score of 0.0 percent. The commercials are Bullish-Extreme with a score of 100.0 percent and the small traders (not shown in chart) are Bearish-Extreme with a score of 12.3 percent.
| Russell 2000 Mini Futures Statistics | SPECULATORS | COMMERCIALS | SMALL TRADERS |
| – Percent of Open Interest Longs: | 7.2 | 88.2 | 3.4 |
| – Percent of Open Interest Shorts: | 27.4 | 67.1 | 4.2 |
| – Net Position: | -118,593 | 123,533 | -4,940 |
| – Gross Longs: | 42,435 | 517,591 | 19,684 |
| – Gross Shorts: | 161,028 | 394,058 | 24,624 |
| – Long to Short Ratio: | 0.3 to 1 | 1.3 to 1 | 0.8 to 1 |
| NET POSITION TREND: | |||
| – Strength Index Score (3 Year Range Pct): | 0.0 | 100.0 | 12.3 |
| – Strength Index Reading (3 Year Range): | Bearish-Extreme | Bullish-Extreme | Bearish-Extreme |
| NET POSITION MOVEMENT INDEX: | |||
| – 6-Week Change in Strength Index: | -24.8 | 24.2 | -7.5 |
Nikkei Stock Average (USD) Futures:
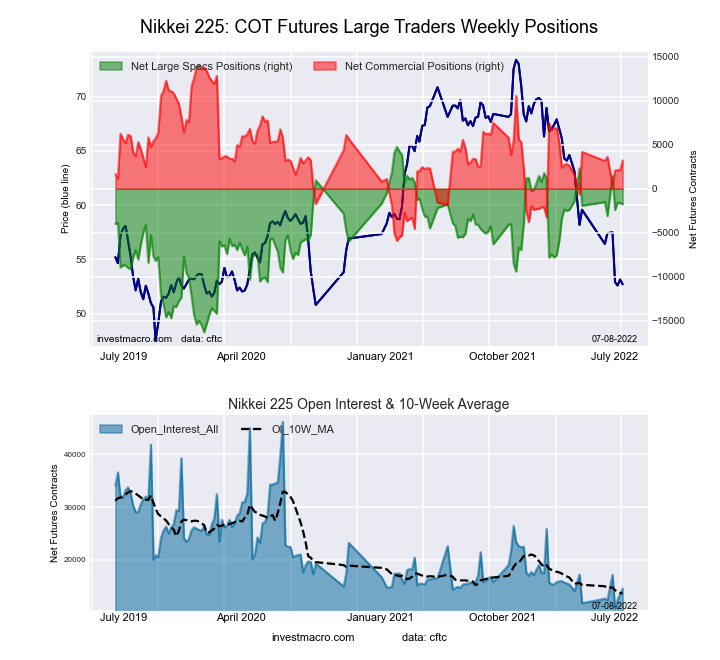 The Nikkei Stock Average (USD) large speculator standing this week came in at a net position of -1,745 contracts in the data reported through Tuesday. This was a weekly fall of -130 contracts from the previous week which had a total of -1,615 net contracts.
This week’s current strength score (the trader positioning range over the past three years, measured from 0 to 100) shows the speculators are currently Bullish with a score of 69.2 percent. The commercials are Bearish with a score of 45.7 percent and the small traders (not shown in chart) are Bearish-Extreme with a score of 9.9 percent.
| Nikkei Stock Average Futures Statistics | SPECULATORS | COMMERCIALS | SMALL TRADERS |
| – Percent of Open Interest Longs: | 28.4 | 55.8 | 15.5 |
| – Percent of Open Interest Shorts: | 40.4 | 33.7 | 25.6 |
| – Net Position: | -1,745 | 3,210 | -1,465 |
| – Gross Longs: | 4,119 | 8,101 | 2,250 |
| – Gross Shorts: | 5,864 | 4,891 | 3,715 |
| – Long to Short Ratio: | 0.7 to 1 | 1.7 to 1 | 0.6 to 1 |
| NET POSITION TREND: | |||
| – Strength Index Score (3 Year Range Pct): | 69.2 | 45.7 | 9.9 |
| – Strength Index Reading (3 Year Range): | Bullish | Bearish | Bearish-Extreme |
| NET POSITION MOVEMENT INDEX: | |||
| – 6-Week Change in Strength Index: | -1.1 | 0.2 | 2.3 |
MSCI EAFE Mini Futures:
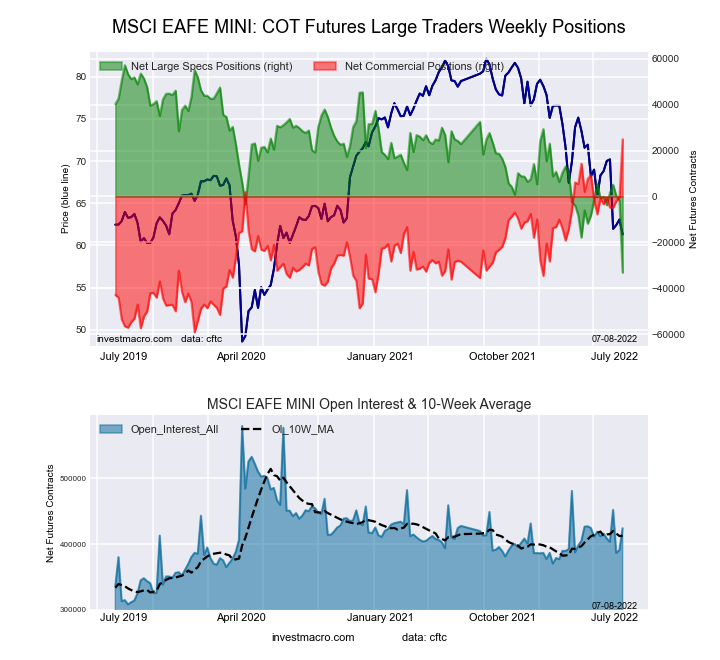 The MSCI EAFE Mini large speculator standing this week came in at a net position of -33,183 contracts in the data reported through Tuesday. This was a weekly decrease of -31,197 contracts from the previous week which had a total of -1,986 net contracts.
This week’s current strength score (the trader positioning range over the past three years, measured from 0 to 100) shows the speculators are currently Bearish-Extreme with a score of 0.0 percent. The commercials are Bullish-Extreme with a score of 100.0 percent and the small traders (not shown in chart) are Bullish-Extreme with a score of 91.2 percent.
| MSCI EAFE Mini Futures Statistics | SPECULATORS | COMMERCIALS | SMALL TRADERS |
| – Percent of Open Interest Longs: | 5.1 | 90.6 | 3.8 |
| – Percent of Open Interest Shorts: | 12.9 | 84.8 | 1.8 |
| – Net Position: | -33,183 | 24,926 | 8,257 |
| – Gross Longs: | 21,492 | 384,305 | 15,954 |
| – Gross Shorts: | 54,675 | 359,379 | 7,697 |
| – Long to Short Ratio: | 0.4 to 1 | 1.1 to 1 | 2.1 to 1 |
| NET POSITION TREND: | |||
| – Strength Index Score (3 Year Range Pct): | 0.0 | 100.0 | 91.2 |
| – Strength Index Reading (3 Year Range): | Bearish-Extreme | Bullish-Extreme | Bullish-Extreme |
| NET POSITION MOVEMENT INDEX: | |||
| – 6-Week Change in Strength Index: | -37.5 | 33.7 | 41.4 |
Article By InvestMacro – Receive our weekly COT Reports by Email
*COT Report: The COT data, released weekly to the public each Friday, is updated through the most recent Tuesday (data is 3 days old) and shows a quick view of how large speculators or non-commercials (for-profit traders) were positioned in the futures markets.
The CFTC categorizes trader positions according to commercial hedgers (traders who use futures contracts for hedging as part of the business), non-commercials (large traders who speculate to realize trading profits) and nonreportable traders (usually small traders/speculators) as well as their open interest (contracts open in the market at time of reporting).See CFTC criteria here.


