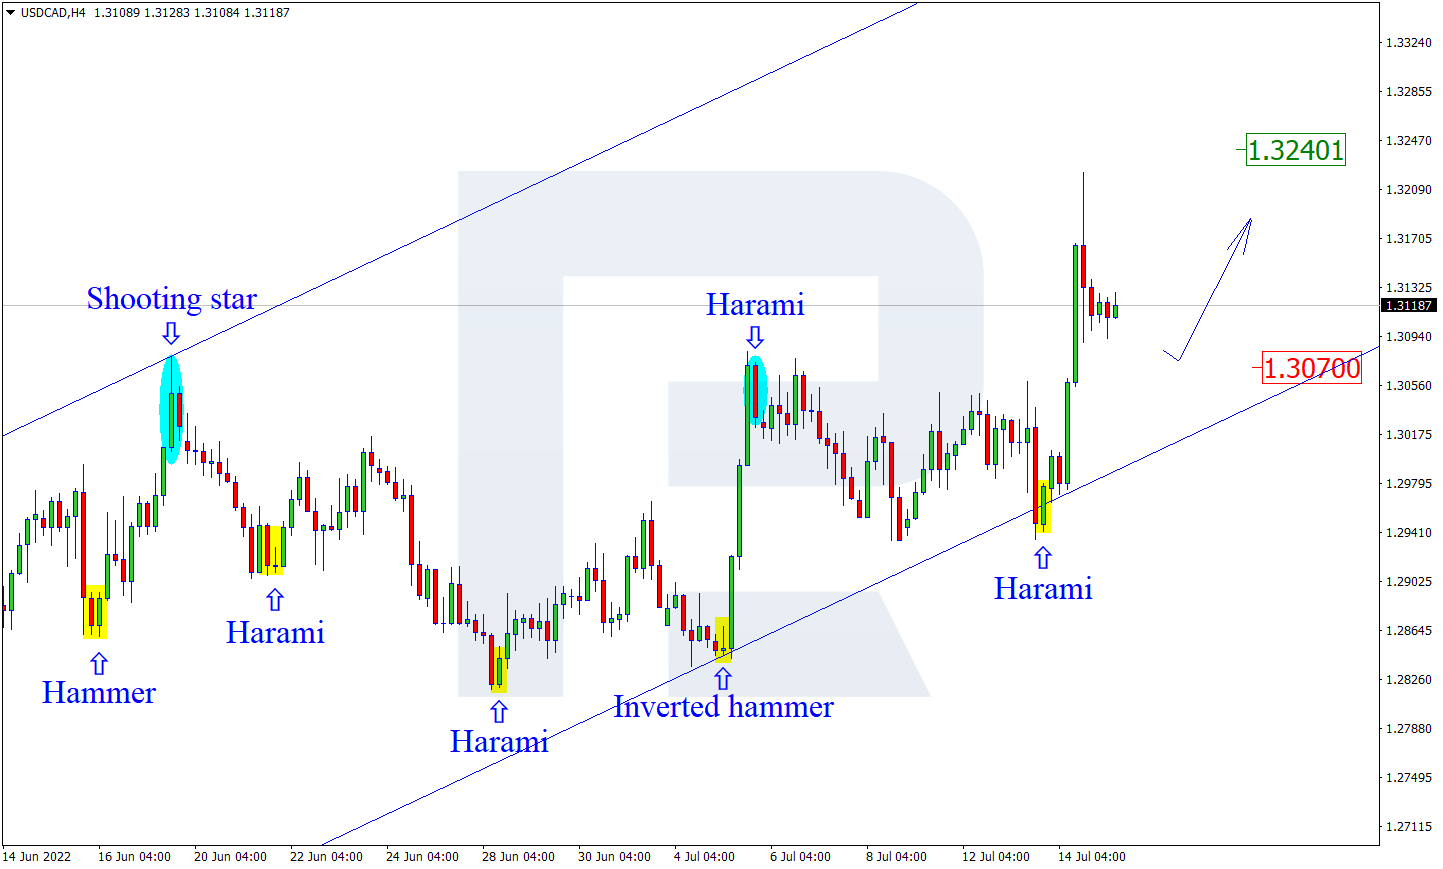
As we can see in the H4 chart, after forming a Harami reversal pattern close to the support level, USDCAD may reverse in the form of another ascending impulse. In this case, the upside target may be the resistance area at 1.3240. Later, the market may break this level and continue to grow. However, an alternative scenario implies that the asset may correct to reach 1.3070 and continue the uptrend only after the pullback.
AUDUSD, “Australian Dollar vs US Dollar”
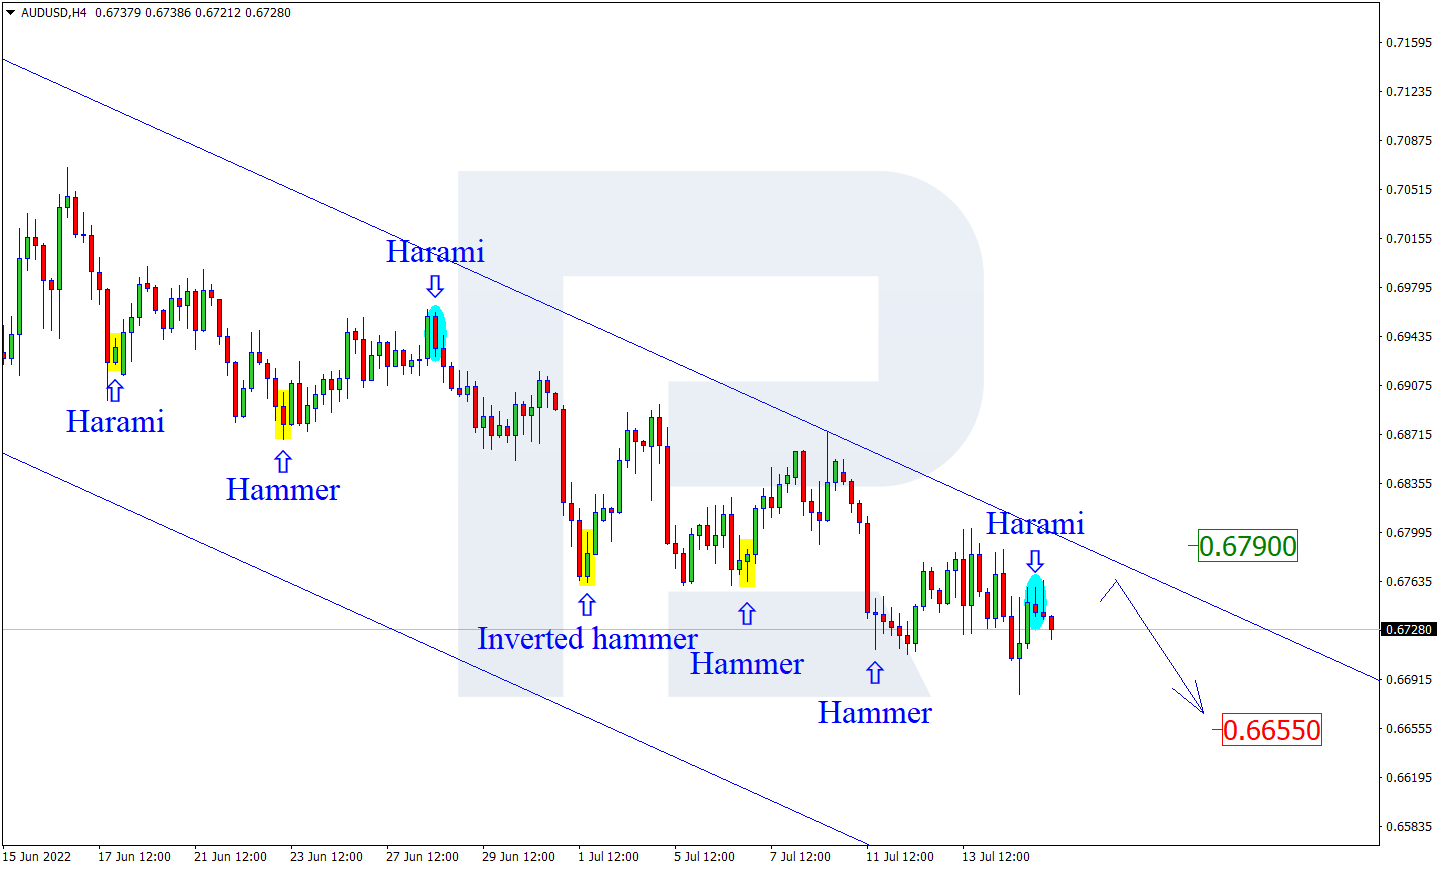
As we can see in the H4 chart, AUDUSD has formed a Harami reversal pattern during the pullback. At the moment, the asset is reversing in the form a new descending impulse. In this case, the downside target may be the support level at 0.6655. After testing the level, the price may break it and continue the descending tendency. At the same time, the opposite scenario implies that the price may grow to reach 0.6790 and continue the uptrend after the correction.
USDCHF, “US Dollar vs Swiss Franc”
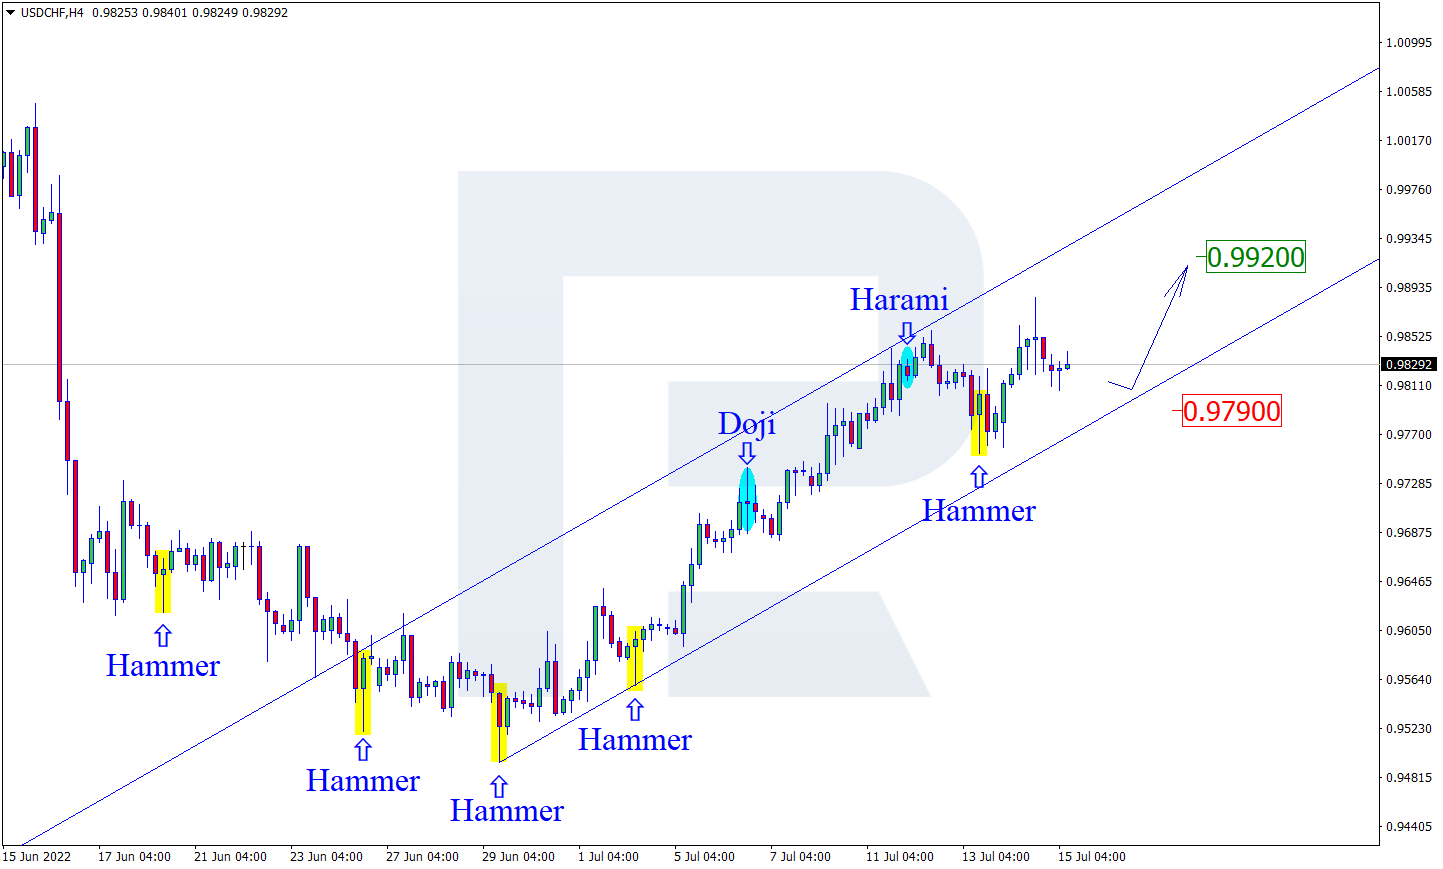
As we can see in the H4 chart, after testing the support area, the pair has formed several reversal patterns, for example, Hammer. At the moment, USDCHF may reverse in the form of a new rising impulse. In this case, the upside target may be at 0.9920. After testing the resistance level, the price may break it and continue trading upwards. Still, there might be an alternative scenario, according to which the asset may correct to reach 0.9790 first and then resume the ascending tendency.
Attention! Forecasts presented in this section only reflect the author’s private opinion and should not be considered as guidance for trading. RoboForex LP bears no responsibility for trading results based on trading recommendations described in these analytical reviews.
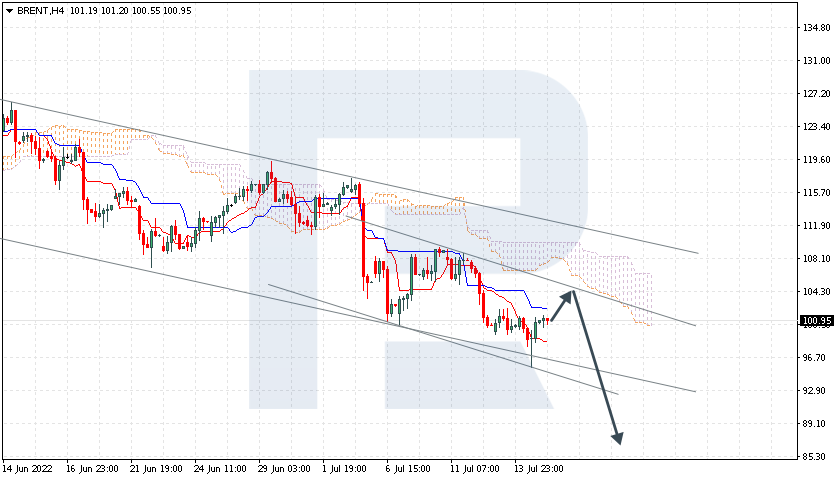
Brent is rebounding from the resistance level. The instrument is currently moving below Ichimoku Cloud, thus indicating a descending tendency. The markets could indicate that the price may test the cloud’s downside border at 104.35 and then resume moving downwards to reach 88.45. Another signal in favour of a further downtrend will be a rebound from the descending channel’s upside border. However, the bearish scenario may no longer be valid if the price breaks the cloud’s upside border and fixes above 111.75. In this case, the pair may continue growing towards 116.55.
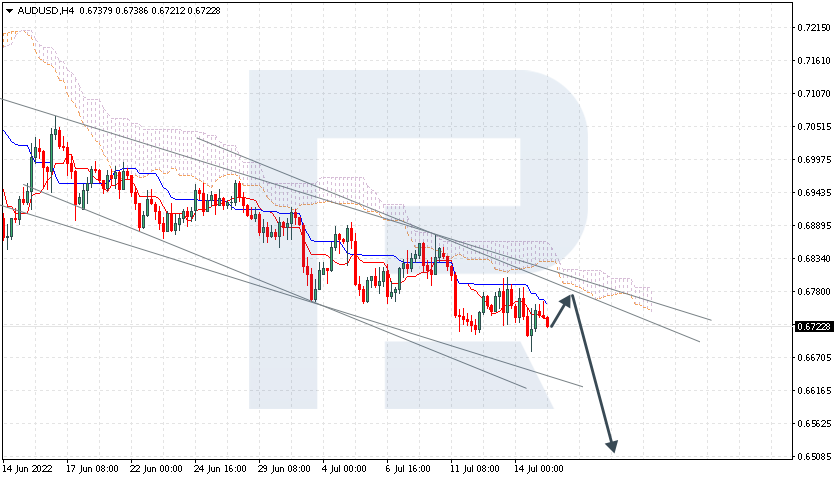
AUDUSD, “Australian Dollar vs US Dollar”
AUDUSD is rebounding from Tenkan-Sen and Kijun-Sen. The instrument is currently moving below Ichimoku Cloud, thus indicating a descending tendency. The markets could indicate that the price may test the cloud’s downside border at 0.6780 and then resume moving downwards to reach 0.6510. Another signal in favour of a further downtrend will be a rebound from the descending channel’s upside border. However, the bearish scenario may no longer be valid if the price breaks the cloud’s upside border and fixes above 0.6855. In this case, the pair may continue growing towards 0.6945.
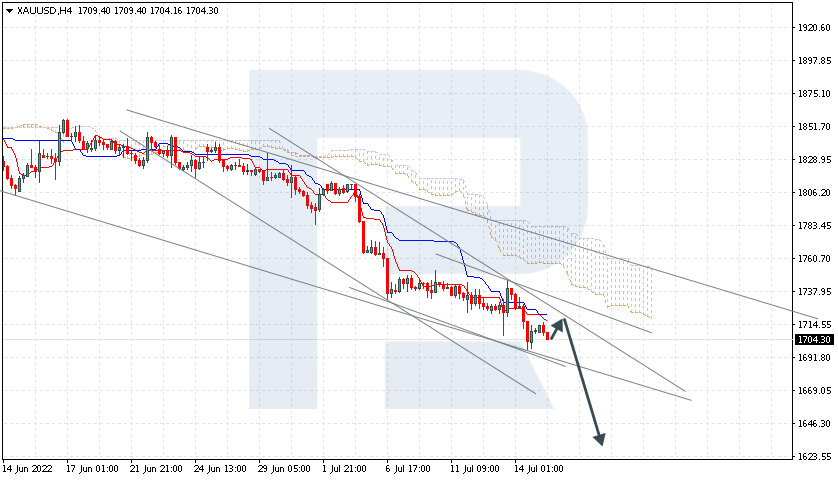
XAUUSD, “Gold vs US Dollar”
XAUUSD has fixed above the resistance level. The instrument is currently moving below Ichimoku Cloud, thus indicating a descending tendency. The markets could indicate that the price may test Tenkan-Sen and Kijun-Sen at 1715.00 and then resume moving downwards to reach 1635.00. Another signal in favour of a further downtrend will be a rebound from the descending channel’s upside border. However, the bearish scenario may no longer be valid if the price breaks the cloud’s upside border and fixes above 1785.00. In this case, the pair may continue growing towards 1825.00.
Attention! Forecasts presented in this section only reflect the author’s private opinion and should not be considered as guidance for trading. RoboForex LP bears no responsibility for trading results based on trading recommendations described in these analytical reviews.
Yesterday EUR/USD dropped below 1 for the first time in 20 years after Italian Prime Minister Mario Draghi’s party in the coalition government did not support the parliament’s vote of confidence, following which Draghi announced his resignation. However, the Italian president rejected the resignation. Inflation data will be released in Italy today. Analysts expect to see consumer prices rise by another 1.2%. The Federal Reserve officials Waller and Bullard said yesterday that they favor a 75 basis point hike at the July Central Bank meeting, making a more aggressive move of 100 basis points less likely. Still, analysts believe the US Dollar Index will continue to rise as the dollar benefits from higher rate hike prospects than other global central banks, including the European Central Bank.
From the technical point of view, the trend on the EUR/USD currency pair on the hourly time frame is bearish. The situation remains the same. At the moment, the price is trading below the moving averages, and the MACD indicator is in the negative zone, but the divergence is already observed on several timeframes. Under such market conditions, sell deals can be considered from the resistance level of 1.0174 or 1.0147, but only after the additional confirmation. Buy trades are best to look for on intraday time frames from the support level of 1.0000, but only with confirmation and short targets.
Alternative scenario: if the price breaks out through the 1.0221 resistance level and fixes above, the uptrend will likely resume.
News feed for 2022.07.15:
– Eurozone Italian Consumer Price Index (m/m) at 11:00 (GMT+3);
– US Retail Sales (m/m) at 15:30 (GMT+3);
– US NY Empire State Manufacturing Index (m/m) at 15:30 (GMT+3);
– US Industrial Production (m/m) at 16:15 (GMT+3);
– US Michigan Consumer Sentiment (m/m) at 17:00 (GMT+3).
The GBP/USD currency pair
Technical indicators of the currency pair:
Prev Open: 1.1889
Prev Close: 1.1822
% chg. over the last day: -0.57%
Despite positive UK GDP data from last month, key indicators of consumer confidence in the country remain low. Household spending is rising, and incomes are not keeping up with this growth. Nevertheless, economists are optimistic and confident that the UK economy will not face a recession this year, despite record levels of inflation, which is expected to peak in the fall. Goldman Sachs predicts that the positive GDP momentum will continue in the coming months and expects a GDP growth of 0.4% in the third quarter.
Trading recommendations
Support levels: 1.1801
Resistance levels: 1.1887, 1.2002, 1.2065, 1.2137
From the technical point of view, the trend on the GBP/USD currency pair on the hourly time frame is bearish. The situation is similar to the euro. The MACD indicator is in the negative zone, but there are signs of divergence. Under such market conditions, sell deals can be considered from the resistance level of 1.1887, but only after the additional confirmation. Buy trades are best to look for on intraday time frames from the support level of 1.1801, but only with confirmation and short targets.
Alternative scenario: if the price breaks out through the 1.2003 resistance level and fixes above, the uptrend will likely resume.
There is no news feed for today.
The USD/JPY currency pair
Technical indicators of the currency pair:
Prev Open: 137.29
Prev Close: 138.94
% chg. over the last day: +1.20%
The dollar has jumped to a 24-year high against the Japanese yen as the Central Bank of Japan maintains a dovish stance. The huge gap between interest rates and the diametrically opposed monetary policy between Japan and the US has already pushed the USD/JPY to multi-year highs. Japan’s government is once again concerned about the yen’s sharp drop and will monitor the currency market with even more urgency, working closely with the Bank of Japan, Chief Cabinet Secretary Hirokazu Matsuno said on Thursday. But Mr. Matsuno would not comment on the issue of currency intervention. The Bank of Japan is expected to keep interest rates ultra-low at its next meeting on July 20-21, highlighting a growing divergence from the global wave of central bank rate hikes.
Trading recommendations
Support levels: 138.12, 137.44, 137.12, 136.48, 135.92, 135.40, 134.64, 134.11
Resistance levels: 139.10
From the technical point of view, the medium-term trend on the USD/JPY currency pair is bullish. The MACD indicator has become positive, the buyer’s pressure has increased, and the price continues an upward trend. Under such market conditions, it is best to wait for a slight pullback, as the price has deviated strongly from the average values. Buy trades can be searched for within a day from the support level of 138.12, but with confirmation. A resistance level of 139.90 may be considered for selling, but only with additional confirmation and short targets.
Alternative scenario: If the price fixes below 136.48, the downtrend will likely resume.
There is no news feed for today.
The USD/CAD currency pair
Technical indicators of the currency pair:
Prev Open: 1.2970
Prev Close: 1.3115
% chg. over the last day: +1.17%
The Canadian dollar is a commodity currency and depends not only on the monetary policy of the Bank of Canada but also on the dynamics of the US Dollar Index and oil prices. Yesterday in the morning, the US Dollar Index rose sharply, while oil prices fell by $9. As a result, the price of USD/CAD jumped. But by the end of the day, oil prices leveled off, and the dollar rebounded from its highs, which led to a slight correction in the USD/CAD. At the moment, the central banks in the US and Canada are on a path to raising interest rates, and the size of interest rates is equivalent, so no medium-term trends should be expected here.
Trading recommendations
Support levels: 1.3060, 1.3024, 1.2959
Resistance levels: 1.3154, 1.3236
In terms of technical analysis, the trend on the USD/CAD currency pair is bullish. The price is trading above the moving averages again, but there are weak signs of divergence. Under such market conditions, it is best to look for buy trades on the lower time frames after a slight pullback to the support level of 1.3060 or 1.3024, but with confirmation. For sell deals, it is best to consider the resistance level of 1.3154, but it is also better with confirmation and short targets.
Alternative scenario: if the price breaks through and consolidates below the 1.2934 support level, the downtrend will likely resume.
This article reflects a personal opinion and should not be interpreted as an investment advice, and/or offer, and/or a persistent request for carrying out financial transactions, and/or a guarantee, and/or a forecast of future events.
Everybody was talking about the euro after the currency hit its lowest level in nearly two decades, flirting with parity amid the widening policy divergence between the Fed and ECB.
The price action around the psychological 1.000 level felt like a fierce tug of war between bulls and bears with no clear winner in sight. Indeed, various fundamental forces were at play – placing traders on an emotional rollercoaster ride all week!
The last few days were certainly wild for the EURUSD but this could intensify in the new trading week thanks to key economic reports and risk events. More volatility could be on the cards for the euro but before we cover what to expect from the currency, here are the scheduled economic data releases/events in the coming week:
Monday, 18 July
CAD: Canada housing starts
NZD: New Zealand CPI
USD: US cross-border investment
GBP: BoE MPC member Michael Saunders speaks
Tuesday, 19 July
AUD: RBA meeting minutes
EUR: Eurozone CPI
GBP: UK jobless claims, unemployment, BoE Andrew Bailey speech
USD: US housing starts
Wednesday, 20 July
CNH: China loan prime rates
GBP: UK CPI, PPI
EUR: Consumer confidence
USD: US existing home sales
Thursday, 21 July
JPY: Bank of Japan rate decision
EUR: ECB rate decision
USD: US initial jobless claims
Friday, 22 July
JPY: Japan CPI
EUR: Eurozone S&P PMI
GBP: UK S&P PMI
CAD: Retail sales
Caution is likely to remain the name of the game in the week ahead as inflation fears, recession concerns, and ongoing geopolitical risks drain investor confidence. Given how markets are quite sensitive and reactive to key economic reports, this could spark some action in the FX space with the mighty dollar seen benefiting from safe-haven flows. Over the weekend, the meeting of G20 finance ministers and central bank governors continues in Indonesia. It may be wise to also keep an eye on the final Eurozone CPI figures for July which will be released on Tuesday.
Let’s cut to the chase…
All eyes will be on the European Central Bank meeting on Thursday. The central bank is widely expected to raise interest rates for the first time since 2011! Markets are pricing a 25-basis point move which would keep rates in the Eurozone still in negative territory despite inflation hitting a new record high of 8.6% according to preliminary estimates. When considering how the euro slipped below parity, this could invite more hawks to the table…
It may not hurt to expect the unexpected from the central bank with a surprise 50-basis point hike catching markets off-guard.
Ultimately, if the central bank lets the euro weaken further – this could fuel inflationary pressures but fighting back by hiking rates could punish an economy already facing a possible recession.
Whatever happens during the ECB meeting, it may have a lasting impact on the euro. Taking a quick look at the EURUSD, it’s all about the psychological 1.0 parity level. Watch this space.
S&P 500 bears still in the building
The S&P 500 remains bashed by the risk-off sentiment and lack of appetite for risk. As recession fears and inflation jitters send investors sprinting towards safety, this continues to weigh on riskier assets. Since the start of 2022, the index has shed over 20% with prices trading around 3779. Equity bulls clearly need a lifeline and this could come in the form of US earnings. Nevertheless, the technicals remain bearish with sustained weakness under 3810 opening a path back towards 3700 and lower.
The US Producer Price Index, which shows the rate of inflation between factories, added 1.1% over the last month while it was expected to rise 0.8%. On an annualized basis, the index reached a record 11.3%. Meanwhile, yesterday Federal Reserve officials Waller and Bullard said that they favor a 75 basis point hike at the US central bank’s July meeting, making a more aggressive move of 100 basis points less likely. Fed funds futures now indicate a 31% chance of a 100 basis point increase and a 69% chance of a 75 basis point increase. But analysts still expect the dollar to rise as it benefits from the higher prospect of rate hikes than other global central banks.
Tech stocks rebounded from lows as Treasury yields fell amid a rebound in the US Dollar Index. But the banking sector showed weakness yesterday on reports. JPMorgan said it would temporarily suspend share buybacks after its second-quarter earnings report missed estimates, sending shares down more than 3%. Morgan Stanley also reported lower second-quarter earnings due to weaker results from its investment banking business.
US indices traded mixed yesterday. By the close of trading, the Dow Jones index (US30) decreased by 0.46%, while the S&P 500 (US500) lost 0.30%. Technology Index NASDAQ (US100) added 0.03% yesterday.
Equity markets in Europe were mostly down yesterday. German DAX (DE30) fell by 1.86% yesterday, French CAC 40 (FR40) lost 1.41%, Spanish IBEX 35 (ES35) dropped by 1.77%, British FTSE 100 (UK100) closed down by 1.63%.
EUR/USD traded below 1 yesterday for the first time in 20 years after Italian Prime Minister Mario Draghi’s party in the coalition government failed to support a vote of confidence in parliament and announced his resignation. However, the Italian president rejected the resignation. Inflation data will be released today in Italy. Analysts expect to see consumer prices rise by another 1.2%. But many experts are inclined to believe that the euro is not as weak as the dollar is strong due to the difference in interest rates between the US Federal Reserve and the ECB. At the moment, a decline of the EUR/USD quotes to the level of 0.9 is the most probable scenario.
Oil prices remain very volatile. Yesterday oil fell by more than $7 per barrel, but by the end of the session, the oil leveled off the wave of decline and closed at the opening level. Analysts’ opinions diverge. On the one hand, tighter monetary policy on the part of the US and planned release of reserves by the US and its allies put downward pressure on oil quotes. On the other hand, OPEC+ countries are producing much less oil than demand, causing shortages that put upward pressure on prices. Sanctions for Russia are also playing in favor of growth.
Asian markets mostly rose yesterday. Japan’s Nikkei 225 (JP225) gained 0.62%, Hong Kong’s Hang Seng (HK50) decreased by 0.22%, and Australia’s S&P/ASX 200 (AU200) was up 0.44% on the day.
Data released Friday showed that China’s economy contracted sharply in the second quarter. At the same time, annual growth also slowed sharply, highlighting the tremendous loss of activity due to widespread COVID lockouts that shook industrial production and consumer spending. China’s GDP fell by 2.6% in the second quarter compared to the previous quarter. On an annualized basis, GDP rose a modest 0.4% in April-June, missing the 1.0% growth forecast. For the first half of the year, GDP grew by 2.5%, well below the government’s target of about 5.5% for the year.
S&P 500 (F) (US500) 3,790.38 −11.40 (−0.30%)
Dow Jones (US30) 30,630.17 −142.62 (−0.46%)
DAX (DE40) 12,519.66 −236.66 (−1.86%)
FTSE 100 (UK100) 7,039.81 −116.56 (−1.63%)
USD Index 108.66 +0.70 (+0.65%)
Important events for today:
– China GDP (q/q) at 05:00 (GMT+3);
– China Retail Sales (m/m) at 05:00 (GMT+3);
– China Industrial Production (m/m) at 05:00 (GMT+3);
– China Unemployment Rate (m/m) at 05:00 (GMT+3);
– Eurozone Italian Consumer Price Index (m/m) at 11:00 (GMT+3);
– Canada Retail Sales (m/m) at 15:30 (GMT+3);
– US Retail Sales (m/m) at 15:30 (GMT+3);
– US NY Empire State Manufacturing Index (m/m) at 15:30 (GMT+3);
– US Industrial Production (m/m) at 16:15 (GMT+3);
– US Michigan Consumer Sentiment (m/m) at 17:00 (GMT+3).
This article reflects a personal opinion and should not be interpreted as an investment advice, and/or offer, and/or a persistent request for carrying out financial transactions, and/or a guarantee, and/or a forecast of future events.
The New Development Bank, which was formed in July 2014, marks its eighth birthday this year. It was formed by the leaders of Brazil, Russia, India, China and South Africa (BRICS) when they met in Fortaleza, Brazil for the bloc’s summit. The bank was seen as a potential alternative to the World Bank and able to take a new approach to development finance.
The New Development Bank has since approved 11 projects in South Africa and Lesotho. These involve sustainable energy, transportation, water resource management, and a COVID-19 emergency loan programme. Some of these projects, for instance the Environmental Protection Project for Medupi Thermal Power Plant, are of strategic importance to South Africa. Of the project’s estimated total cost of US$2.75 billion, the bank is providing a US$480 million loan.
This is in line with hopes that the bank would serve as a much-needed new source of financing for national and regional initiatives. Another hope was that it would be more transparent and accountable than other multilateral banks such as the World Bank. Its mission and values, articles of agreement, environmental and social framework and information disclosure policy make commitments about transparency and openness.
The bank’s mission statement expresses its objective of not only “achieving development goals with transparency” but also displaying “empathy” towards its projects’ intended beneficiaries.
Billions of dollars of investment later, however, the reality suggests that improvement is needed.
A study on transparency and accountability by Oxfam South Africa and the University of Pretoria’s Centre for Human Rights raises concerns about how the bank handles access to information. It also lacks an independent accountability mechanism. The study calls into question whether the bank is showing empathy towards the communities that are affected by its projects.
Some of these challenges are cross-cutting. For instance, the representatives said that the influx of migrant workers into their communities had put a strain on resources and services. There were also project-specific issues. These included concerns about the resettlement of more than 3,000 people to make way for the Lesotho project.
The study demonstrates the difficulty of getting project information. The New Development Bank’s responses to information requests from the researchers lacked adequate detail. Without timely and comprehensive access to information, how can communities affected by projects adequately address their concerns?
The bank’s website has no project documents and its information portal is hard to use. This affects the right of communities to be heard, a right that can’t be exercised without access to information.
Unlike most multilateral development banks, the New Development Bank doesn’t have an independent accountability mechanism. Nor does it have other ways for these communities to seek redress or hold it accountable.
Such mechanisms are created to hold development finance institutions and their clients accountable to their own policies. They also provide access to remedies for individuals and communities that are adversely affected by the activities such institutions fund. Without such a mechanism, the bank’s approach to accountability falls far short of global best practice.
It’s clear that much more can be done to improve transparency and accountability at the New Development Bank.
Looking ahead
The bank could do this in several ways:
It must put section 23 of its environment and social framework into practice. This requires the bank to disclose project documents and information to communities and the general public during the project design and implementation phases, and throughout projects’ life cycles.
It should create a structure or platform, an independent accountability mechanism, that affected communities can use to prod the bank when it fails to provide timely access to project information or to comply with its own policies and procedures. Better and more sustainable development outcomes can be achieved when the mechanism’s design process includes public consultations that incorporate different stakeholders. These public consultations should aim to genuinely solicit inputs that influence the design and implementation of the proposed mechanism.
At a national level, there have also been calls for the formation of a South African liaison group for international financial institutions. This group would be a platform to promote discourse between South African government institutions such as the treasury and civil society concerning the country’s relationship with international financial institutions. This group could for instance be a good platform to discuss civil society’s concerns about the New Development Bank.
TokenMint will make tokenization streamlined and accessible to the masses
New York, NY (July 14 , 2022) – Horizen, a privacy-focused zero-knowledge network of blockchains powered by the largest node system, announced the mainnet launch of its no-code tokenization platform TokenMint.
TokenMint, which aims to bridge the accessibility gap in token creation, is an automated drag-and-drop platform that allows people with or without programming knowledge to create their own token with custom tokenomics. The current Alpha version of the TokenMint platform consists of basic functionalities for creating a fungible token. Future versions will integrate a wider range of features like NFT support and zkSNARKs, a privacy technology that will enable provable tokenomics and preserve user privacy.
“Tokenization will serve as one of the main driving forces behind the wave of innovation in blockchain and growth in the adoption of decentralized applications in coming years. A platform like TokenMint can play an important role in making tokenization accessible to mainstream users,” said Rob Viglione, co-founder of Horizen and Horizen Labs. “Notably, no programming knowledge is required for creating a token using TokenMint so users can get started right away. Our long-term goal for the platform is to achieve provable tokenomics while enhancing user privacy, a move that will further break the barriers between tokenization and the masses.”
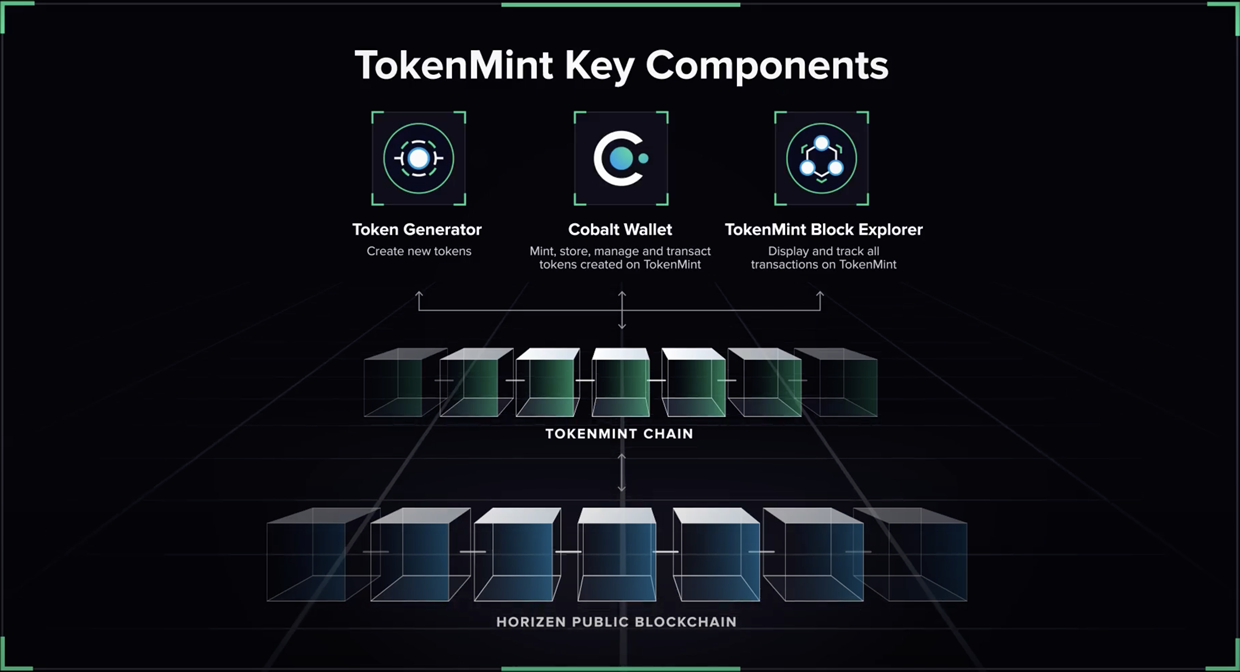
TokenMint, comprising three key tools, is designed to provide a seamless, simple and intuitive user experience. The platform comes equipped with the Token Generator for creating and minting tokens, as well as a block explorer, where transactions are displayed for easy tracking. The platform’s Cobalt Wallet allows users to store, manage and transact tokens created on the platform. These tools are built on the TokenMint Chain, a sidechain that runs on the Horizen network.
“We leverage agile methodologies to bring immediate value to our community through early and continuous delivery of our software. The TokenMint alpha release is just the beginning, as our product and engineering teams will continue to rapidly iterate on it with shorter delivery cycles that immediately address the evolving needs of Web3 and the crypto movement. We look forward to having TokenMint drive forth additional mainstream adoption,” said Zain Cheng, VP of Engineering, Horizen Labs.
Horizen is the zero-knowledge network of blockchains powered by the largest node system and a massively scalable cross-chain protocol. Horizen offers best-in-class tools for developers to custom-build private or public blockchains with the level of flexibility unmatched by others. By building on Horizen, developers have the freedom to fully customize their blockchains including consensus, speed, privacy, and crypto-economies. Blockchains built on Horizen produce massive throughput without compromising decentralization. Please visit www.horizen.io for more information.
Excessive euphoria in financial markets is usually a big reason to be “skeptical”
By Elliott Wave International
Environmental, Social and Governance bonds (ESG) — also called “green” bonds — are offered by companies which want to advance the causes of social justice, social inclusion and green technology.
This form of debt had been steadily gaining in popularity — going from sales of less than $100 billion in 2015 to around $800 billion in 2020.
For instance, here’s an Oct. 9, 2020 headline from Pensions & Investments:
University of Toronto’s $7 billion fund makes bet on ESG debt
However, the Elliott wave structure of a global green-bond index was sending a warning signal.
The July Global Market Perspective, a monthly Elliott Wave International publication which covers 50-plus worldwide financial markets, shows a chart from the December 2020 Global Market Perspective (on the left) and an updated chart on the right.
Focusing on the left chart first, which had sported a five-wave advance (meaning a trend turn was imminent), the December 2020 Global Market Perspective said:
Experts have loudly proclaimed that so-called social bonds will be the next great innovation. … But the euphoria surrounding this new debt is actually one of the biggest reasons to remain skeptical. … Steer clear of both green bonds and social bonds.
Indeed, as the updated right chart shows, the price began to fall shortly after that warning. Eventually, a countertrend rally ensued and by July 13, 2021, a Bloomberg headline said:
ESG Bond Sales Sprint to $1 Trillion as Investors Force Change
Once again, the Global Market Perspective provided a warning — this one from the August 2021 issue:
The wipeout could be one of the biggest ever.
You can see the big price tumble that occurred thereafter.
Do understand that the Elliott wave model does not guarantee that a financial market will behave in one fashion or another. At the same time, it’s the best analytical method of which Elliott Wave International knows because it’s based on the repetitive patterns of investor psychology.
Indeed, here’s what Frost & Prechter had to say in Elliott Wave Principle: Key to Market Behavior:
The Wave Principle is governed by man’s social nature, and since he has such a nature, its expression generates forms. As the forms are repetitive, they have predictive value. [emphasis added]
For a limited time, our friends at Elliott Wave International are offering you 5 quick takes on Elliott wave patterns in several markets — stocks, pot stocks and bonds — all from their new, July 2022 issue of the Global Market Perspective.
The publication provides analysis for 50+ of the world’s key markets.
This article was syndicated by Elliott Wave International and was originally published under the headline Wipeout! New Update on Our “Green Bond” (ESG) Forecast. EWI is the world’s largest market forecasting firm. Its staff of full-time analysts led by Chartered Market Technician Robert Prechter provides 24-hour-a-day market analysis to institutional and private investors around the world.
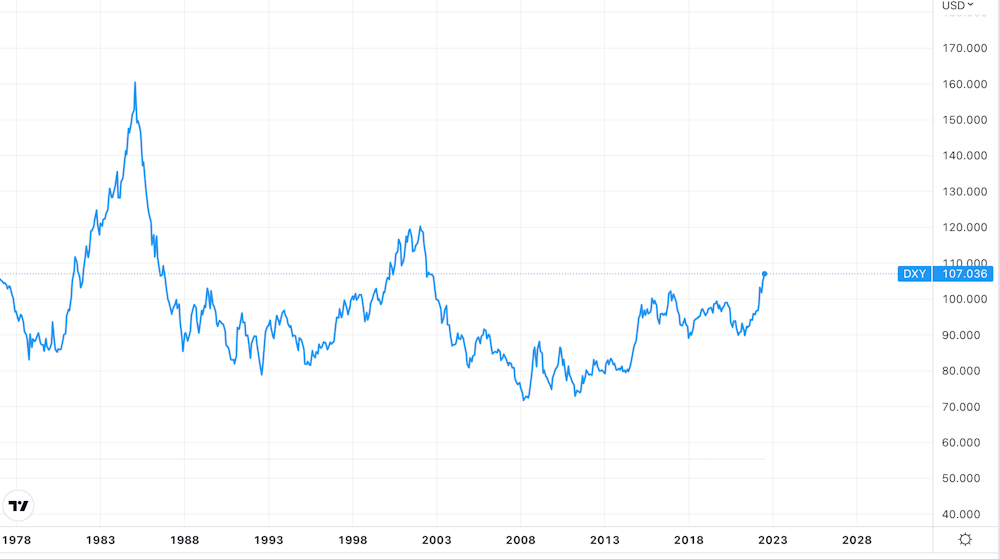
– The US dollar has been on a major surge against major global currencies in the past year, recently hitting levels not seen in 20 years. It has gained 15% against the British pound, 16% against the euro and 23% against the Japanese yen.
The dollar is the world’s reserve currency, which means it is used in most international transactions. As a result, changes in its value have implications for the entire global economy. Below are five of the main ones.
US dollar strength 1977-2022
The US dollar index or DXY is the US dollar measured against a basket of world currencies. Trading View
1. Even more inflation
Petrol and most commodities such as metals or timber are usually traded in US dollars (though with exceptions). So when the dollar gets stronger, these items cost more in local currency. For example in British pounds, the cost of US$100-worth of petrol has risen over the past year from £72 to £84. And since the price per litre of petrol in US dollars has risen steeply as well, it is creating a double whammy.
When energy and raw materials cost more, the prices of many products go up for consumers and businesses, causing inflation around the world. The only exception is the US, where a stronger dollar makes it cheaper to import consumer products and therefore could help to tame inflation.
2. Low-income countries under threat
Most developing countries owe their debt in US dollars, so many owe much more now than a year ago. As a result, many will struggle to find an ever increasing amount of local currency to service their debts.
We are already seeing this in Sri Lanka, and other countries may soon follow suit. They will either have to tax their economies more, issue inflationary local money or simply borrow more. The results could be deep recession, hyper-inflation, a sovereign debt crisis or all three together, depending on the path chosen. Developing countries which fall into sovereign debt crises can take years or even decades to recover, causing severe hardship to their people.
3. A bigger US trade deficit
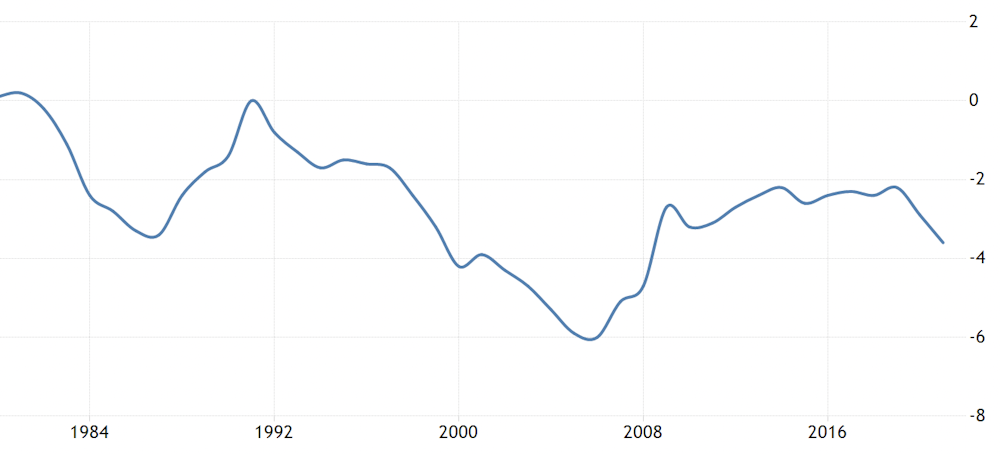
Other countries will buy fewer US products as a result of the strong dollar. The US trade deficit, which is the difference between the amount of exports and imports, already runs close to a mammoth one trillion dollars per year. President Joe Biden and Donald Trump before him vowed to reduce it, particularly against China. Some economists worry that the trade deficit drives up US borrowing and reflects the fact that many manufacturing jobs have moved overseas.
The most obvious economic policy to prevent a trade deficit from growing is the old game of imposing tariffs, quotas or other barriers on imports. Other countries tend to retaliate against such protectionism, adding their own taxes and other barriers to US products. In an era when “de-globalisation” has already begun thanks to worsening western relations with Russia and China, a stronger dollar adds to the political momentum for protectionism and threatens global trade.
5. Eurozone fears
Weaker EU member states such as Portugal, Ireland, Greece and Cyprus have become somewhat less vulnerable to investors driving up their borrowing costs to crisis levels than during the darkest days of the eurozone crisis. This is because much of their national debt is now in the hands of the the European Stability Mechanism (ESM), which was set up to help rescue them, as well as friendlier investment banks within the eurozone.
However, the stronger dollar is creating pressure for the European Central Bank to raise its own interest rates to prop up the euro and subdue the cost of imports, including energy. This will put more pressure on eurozone countries with high levels of debt. Italy, which is the ninth largest economy in the world and has government debts at a whopping 150% of GDP, would be particularly hard to bail out if the situation got out of control.
Bringing these five points together, the ultra-strong dollar is yet another reason to fear a global recession in the coming period. Higher inflation erodes consumer incomes and reduces consumption. Protectionism can reduce international trade and investment. Sovereign debt crises mean serious trouble for many developing countries and possibly even the eurozone.
Will the dollar keep rising?
The dollar has been rising for both economic and geopolitical reasons. The central bank of the US – the Federal Reserve – has been hiking interest rates aggressively and also reversing its policy of creating money via quantitative easing (QE). This is with a view to curbing inflation caused by COVID supply issues, the war in Ukraine and also QE.
The stronger US dollar is a side effect of these higher interest rates. Because the dollar now offers a higher yield when deposited in a US bank, it encourages foreign investors to sell their local currency and buy US dollars.
Of course, central banks in other jurisdictions such as the UK have also been raising interest rates, and the eurozone is planning to do likewise. But they are not acting as aggressively as the US. Meanwhile Japan is not tightening at all, so the net result is still greater overseas demand for greenbacks.
The other reason for the surging US dollar is because it is a classic safe haven when the world is worried about a recession – and the current geopolitical situation is arguably making it still more appealing. The euro has suffered from the EU’s proximity to the war in Ukraine, its exposure to Russian energy and the prospect of another eurozone crisis. It is close to dollar parity for the first time since its early years.
The British pound has been hit by Brexit and is also facing the prospect of a second Scottish independence referendum and a potential trade war with the EU over the Northern Ireland protocol. Finally, the yen belongs to an economy that seems to be slowly losing ground. Japan is ageing and is still not comfortable with migration to boost its production capabilities. A weaker yen is also the price that Japan pays for continuing QE to keep the interest rates low on its government debt.
It is difficult to predict the future direction of the US dollar when there are so many moving parts in the world economy. But we suspect that persistent inflation will force US interest rates to keep rising, and that together with geopolitical shocks from war and sovereign debt defaults, it will probably keep the dollar high. A strong US dollar is a response to troubled times.
Iran’s nuclear program is a major topic in President Joe Biden’s meetings this week with leaders in the Middle East. The most challenging part of producing nuclear weapons is making the material that fuels them, and Iran is known to have produced uranium that is near-weapons grade.
The Conversation asked Brandeis University professor Gary Samore, who worked on nuclear arms control and nonproliferation in the U.S. government for over 20 years, to explain why uranium enrichment is central to Iran’s nuclear ambitions and where the Iranian effort stands now.
A cascade of gas centrifuges at a U.S. enrichment plant in Piketon, Ohio, in 1984. Iran is using similar technology to enrich uranium. U.S. Department of Energy
What does it mean to enrich uranium?
Natural uranium contains two main isotopes, or forms whose atoms contain the same number of protons but different numbers of neutrons. It’s about 99.3% uranium-238 and 0.7% uranium-235. The uranium-235 isotope can be used to generate nuclear power for peaceful purposes, or nuclear explosives for military purposes.
Enrichment is the process of separating out and increasing the concentration of U-235 to higher levels above natural uranium. Generally speaking, lower levels of enriched uranium, such as uranium with 5% U-235, are commonly used for nuclear reactor fuel. Higher levels of enrichment, such as 90% U-235, are most desirable for nuclear weapons.
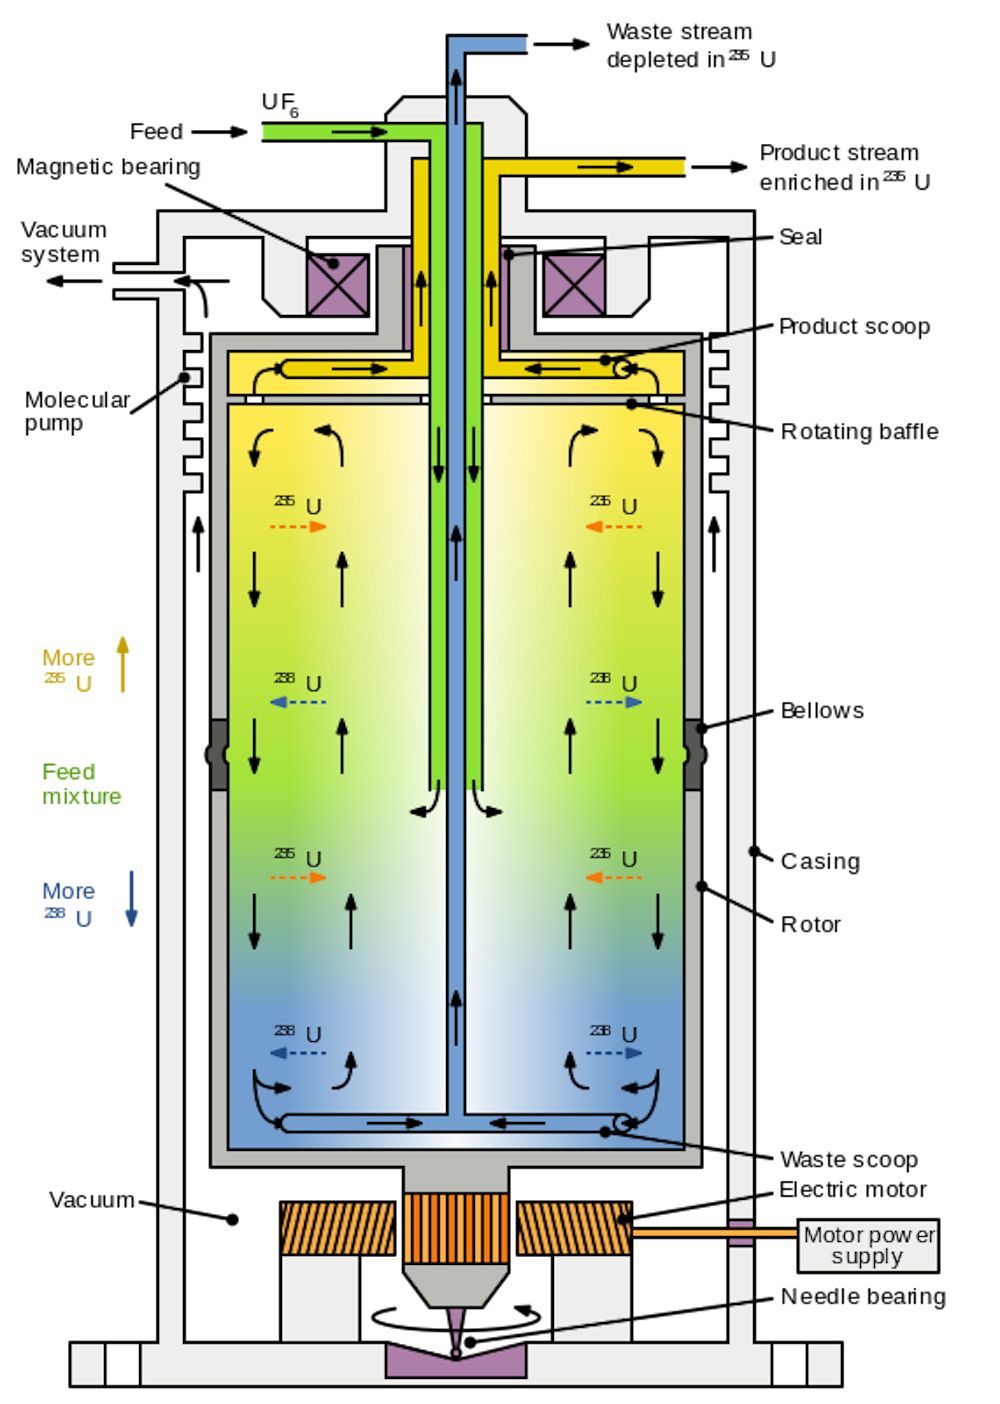
A gas centrifuge separates uranium-235 atoms, which can sustain a nuclear chain reaction, from much more abundant atoms of uranium-238, which cannot. As the centrifuge rotates at high speed, uranium hexafluoride gas is pumped into it. The heavier U-238 molecules move toward the outer edge, and the lighter U-235 molecules move toward the center. The ‘product stream’ of gas enriched in U-235 is pumped through many more centrifuges, increasing the concentration of U-235 at each stage. Inductiveload/Wikipedia
For military purposes, why are higher levels of enrichment important?
The higher the level of enrichment, the smaller the amount of nuclear material necessary to produce a nuclear weapon.
The International Atomic Energy Agency identifies 25 kilograms (55 pounds) of 90% enriched uranium as a “significant quantity” necessary for a simple nuclear weapon. But larger amounts of lower-enriched uranium can also work.
For example, the “Little Boy” atomic bomb that the U.S. dropped on Hiroshima, Japan, in 1945 used about 64 kilograms of uranium (141 pounds) enriched to an average of 80% U-235.
From a nuclear weapons design standpoint, smaller amounts of higher-enriched nuclear material are more desirable because that reduces the size and weight of the nuclear weapon and makes it easier to deliver. As a result, modern nuclear weapons based on uranium typically use uranium enriched to 90% to 93% U-235, which is known as weapons-grade uranium, for the primary fuel.
What had Iran achieved prior to the 2015 nuclear deal?
The 2015 nuclear deal between Iran, the U.S. China, France, the United Kingdom, Russia and Germany put significant restrictions on Iran’s nuclear program, in return for relief from a number of international sanctions. When the deal was adopted, Iran had mastered the basic technology for enriching uranium with gas centrifuges – cylinders that spin uranium in gas form at very high speeds to separate the heavier U-238 isotope from the lighter U-235 isotope.
At its two principal enrichment facilities, Natanz and Fordow, Iran was operating about 18,000 first-generation IR-1 centrifuges and about 1,000 second-generation IR-2 centrifuges. It had also accumulated a stockpile of roughly 7,000 kilograms (about 15,430 pounds) of low-enriched uranium (under 5%) and about 200 kilograms (440 pounds) of 20% enrichment uranium.
Based on these capabilities, Iran’s “breakout time” to produce about 25 kilograms (55 pounds) of 90% enriched uranium – enough for a single nuclear weapon – was estimated to be one or two months.
Breakout time is not intended to suggest that Iran would necessarily decide to produce weapons-grade uranium at these inspected facilities, because the risk of detection and of potential negative international reaction is very high.
How did the nuclear deal constrain Iran’s activities?
The 2015 nuclear deal put physical constraints on Iran’s enrichment program for 10 to 15 years, including the number and type of centrifuges Iran could operate, the size of its stockpile of low-enriched uranium and its maximum enrichment level.
For 15 years, no enrichment would take place at Fordow, and Iran’s stockpile of low-enriched uranium would be limited to 300 kilograms (660 pounds) at a maximum enrichment level of 3.67%. And for 10 years, its centrifuges would be limited to about 6,000 IR-1 centrifuges at Natanz.
In order to meet these physical limits, Iran shipped out to Russia most of its stockpile of low-enriched uranium and its entire stockpile of 20% enriched uranium. It also dismantled for storage inside Iran most of its IR-1 centrifuges and all of its more advanced IR-2 centrifuges. As a consequence of these limits, Iran’s “breakout time” was extended from a month or two before the deal to about one year after the deal.
After year 10 of the deal, however, Iran was allowed to start replacing its IR-1 centrifuges at Natanz with more advanced models, which it was permitted to continue to research and develop during the first decade of the deal. As these more powerful advanced centrifuges were installed, breakout time would probably have shrunk to about a few months by year 15 of the deal.
As part of the deal, Iran also agreed to enhanced international inspections and monitoring of its nuclear facilities.
What has Iran done since President Trump withdrew the U.S. from the nuclear deal in 2018?
Since the U.S. withdrew from the nuclear deal, Iran has gradually exceeded the agreement’s limits. It has increased its stockpile of 5% enriched uranium; resumed producing 20% enriched uranium; initiated production of 60% enriched uranium, resumed enrichment at Fordow; and manufactured and installed advanced centrifuges at both Natanz and Fordow.
Iran has also begun to restrict international monitoring of its nuclear facilities. In June 2022, for example, Iran announced that it was disconnecting cameras installed under the 2015 nuclear deal to monitor its nuclear facilities.
IAEA Director General Rafael Grossi reacts to Iran’s removal of monitoring cameras from its nuclear facilities.
As of May 2022, the International Atomic Energy Agency estimated that Iran had about 1,000 kilograms (2,200 pounds) of 5% enriched uranium, about 240 kilograms (530 pounds) of 20% enriched uranium and 40 kilograms (88 pounds) of 60% enriched uranium.
As a result of this growing stockpile of enriched uranium and the use of advanced centrifuges, Iran’s estimated breakout time has been reduced to a few weeks. So far, however, Iran has not decided to begin production of weapons-grade (90%) enriched uranium, even though it is technically capable of doing so.
Most likely, Iran is behaving cautiously because its leaders are concerned that producing weapons-grade uranium would trigger a strong international reaction, which could range from additional sanctions to military attack.
About the Author:
Gary Samore, Professor of the Practice of Politics and Crown Family Director of the Crown Center for Middle East Studies, Brandeis University









 Article by






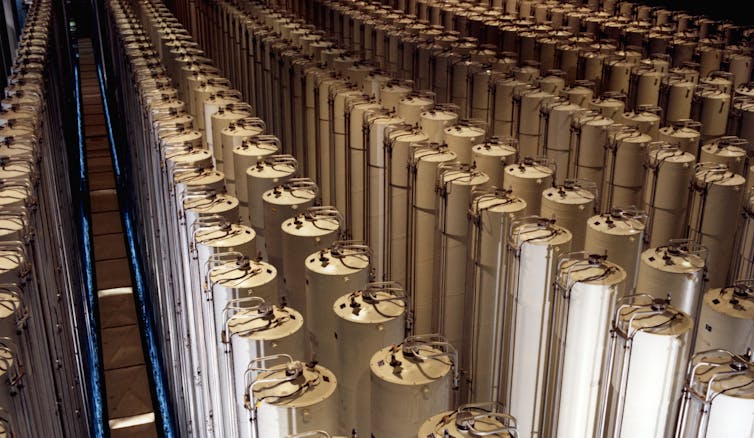 A cascade of gas centrifuges at a U.S. enrichment plant in Piketon, Ohio, in 1984. Iran is using similar technology to enrich uranium.