Murrey Math Lines 28.06.2022 (AUDUSD, NZDUSD)

Article By RoboForex.com

AUDUSD, “Australian Dollar vs US Dollar”

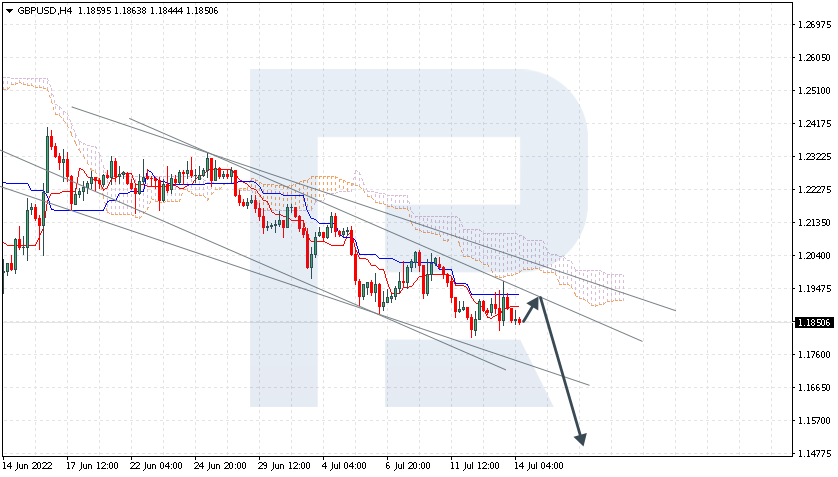
As we can see in the H4 chart, AUDUSD is trading below the 200-day Moving Average to indicate a descending tendency. In this case, the price is expected to test 1/8, break it, and then continue falling to reach the support at 0/8. However, this scenario may no longer be valid if the price breaks the resistance at 2/8 to the upside. After that, the instrument may reverse and resume growing towards 3/8.

AUDUSDH4
Risk Warning: the result of previous trading operations do not guarantee the same results in the future

In the M15 chart, the pair may break the downside line of the VoltyChannel indicator and, as a result, continue moving downwards.

AUDUSD_M15
Risk Warning: the result of previous trading operations do not guarantee the same results in the future

NZDUSD, “New Zealand Dollar vs US Dollar”

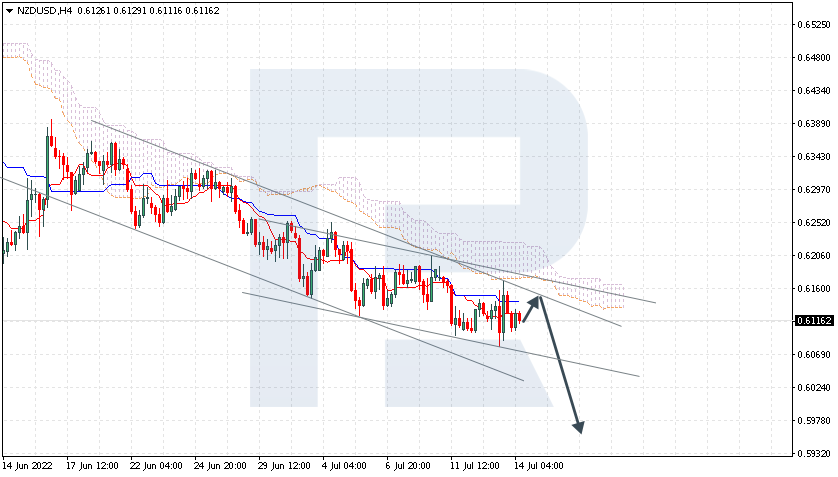
As we can see in the H4 chart, NZDUSD is also trading below the 200-day Moving Average, thus indicating a possible descending tendency. In this case, the price is expected to break 3/8 and then continue moving downwards to reach the support at 1/8. However, this scenario may no longer be valid if the price breaks the resistance at 4/8 to the upside. After that, the instrument may reverse and grow towards 5/8.

NZDUSD_H4
Risk Warning: the result of previous trading operations do not guarantee the same results in the future

In the M15 chart, the pair may break the downside line of the VoltyChannel indicator and, as a result, continue its decline.

NZDUSD_M15

Article By RoboForex.com

Attention!
Forecasts presented in this section only reflect the author’s private opinion and should not be considered as guidance for trading. RoboForex LP bears no responsibility for trading results based on trading recommendations described in these analytical reviews.

Forex Technical Analysis & Forecast 28.06.2022

Article By RoboForex.com

EURUSD, “Euro vs US Dollar”

After completing the ascending wave at 1.0614, EURUSD is correcting down to 1.0555. Later, the market may trade upwards to reach 1.0629 and then resume falling with the target at 1.0440.

EURUSD
Risk Warning: the result of previous trading operations do not guarantee the same results in the future

GBPUSD, “Great Britain Pound vs US Dollar”

GBPUSD has finished the ascending wave at 1.2330 along with the correction down to 1.2240; right now, it is forming a new consolidation range above the latter level. Today, the pair may grow towards 1.2400 and then trade downwards to return to 1.2250. After that, the instrument may start another growth with the target at 1.2420.

GBPUSD
Risk Warning: the result of previous trading operations do not guarantee the same results in the future

USDJPY, “US Dollar vs Japanese Yen”

USDJPY has completed the correctional wave at 135.55 and may later start another decline towards 134.90, thus forming a new consolidation range between these two levels. If the price breaks this range to the upside, the market may form one more ascending structure to reach 136.70; if to the downside – resume falling with the target at 134.18.

USDJPY
Risk Warning: the result of previous trading operations do not guarantee the same results in the future

USDCHF, “US Dollar vs Swiss Franc”

Having finished the ascending wave at 0.9619, USDCHF is expected to correct down to 0.9545 and may later resume growing to reach 0.9633. After that, the instrument may form a new descending structure towards 0.9577 and then start another growth with the target at 0.9700.

USDCHF
Risk Warning: the result of previous trading operations do not guarantee the same results in the future

AUDUSD, “Australian Dollar vs US Dollar”

AUDUSD is still consolidating around 0.6915. Possibly, the pair may grow to reach 0.6962 and then resume trading downwards with the target at 0.6863.

AUDUSD
Risk Warning: the result of previous trading operations do not guarantee the same results in the future

BRENT

Having broken 113.00 to the upside, Brent continues growing towards 115.60 and may later correct to return to 113.00. After that, the instrument may form one more ascending wave with the target at 117.20 or even extend this structure up to 122.50.

BRENT
Risk Warning: the result of previous trading operations do not guarantee the same results in the future

XAUUSD, “Gold vs US Dollar”

Gold is still consolidating around 1831.00; right now, it is forming a new descending structure towards 1815.00. Later, the market may start a new growth with the target at 1831.00 and then resume trading downwards to reach 1791.00.

GOLD
Risk Warning: the result of previous trading operations do not guarantee the same results in the future

S&P 500

After breaking 3830.0 to the upside, the S&P index continues growing towards 3950.0. Later, the market may reach 4014.0 and then resume trading downwards with the short-term target 3617.0.

S&P 500

Article By RoboForex.com

Attention!
Forecasts presented in this section only reflect the author’s private opinion and should not be considered as guidance for trading. RoboForex LP bears no responsibility for trading results based on trading recommendations described in these analytical reviews.

The Analytical Overview of the Main Currency Pairs on 2022.06.28

By JustForex

The EUR/USD currency pair

Technical indicators of the currency pair:
  • Prev Open: 1.0546
  • Prev Close: 1.0581
  • % chg. over the last day: +0.33%

Durable Goods Orders in the US unexpectedly rose by 0.7% in May, while analysts had expected no change. At the same time, the US pending home sales overcame a six-month slump and showed a slight gain. As softening inflation expectations prompted a reassessment of the prospects for aggressive interest rate hikes, the dollar index declined, allowing the euro to rise slightly. Futures pricing indicates that traders now expect the US Federal Reserve’s benchmark interest rate to stabilize at around 3.5% (the previous forecast was 4% in 2023).

Trading recommendations
  • Support levels: 1.0573, 1.0408, 1.0379
  • Resistance levels: 1.0611, 1.0680, 1.0723

From the technical point of view, the trend on the EUR/USD currency pair on the hourly time frame is bearish. The price still forms a wide corridor, and the MACD indicator has become inactive, but there is divergence towards sales. Under such market conditions, sell deals can be considered from the resistance level of 1.0611, but only after the additional confirmation. A price move above 1.0611 will change the priority. Buy trades are best to look for on intraday time frames from the support level of 1.0573 or the lower border of the flat, but only with confirmation and short targets.

Alternative scenario: if the price breaks out through the 1.0611 resistance level and fixes above, the uptrend will likely resume.

EUR/USD
News feed for 2022.06.28:
  • – US FOMC Member Williams Speaks (m/m) at 01:30 (GMT+3);
  • – ECB President Lagarde Speaks at 11:00 (GMT+3);
  • – US CB Consumer Confidence (m/m) at 17:00 (GMT+3).

The GBP/USD currency pair

Technical indicators of the currency pair:
  • Prev Open: 1.2263
  • Prev Close: 1.2266
  • % chg. over the last day: +0.02%

UK household inflation expectations decreased to their lowest level since January, which is good news for Bank of England officials who fear increased price pressures. Despite that, inflation expectations are still elevated. Financial markets show a roughly 73% chance that the Bank of England will raise the bank rate to 1.75% from 1.25% at the next policy meeting on August 4.

Trading recommendations
  • Support levels: 1.2238, 1.2093, 1.1974
  • Resistance levels: 1.2324, 1.2422, 1.2470, 1.2523, 1.2629

From the technical point of view, the trend on the GBP/USD currency pair on the hourly time frame is bearish. The situation is very similar to the euro. The price forms a wide corridor, while the MACD indicator shows no activity, but there is a slight divergence. Under such market conditions, sell deals can be considered from the resistance level of 1.2422 or the upper border of the flat, but only after the additional confirmation. Buy trades are best to look for on intraday time frames from the support level of 1.2238 or the lower border of the flat, but only with confirmation and short targets.

Alternative scenario: if the price breaks out through the 1.2422 resistance level and fixes above, the uptrend will likely resume.

GBP/USD
There is no news feed for today.

The USD/JPY currency pair

Technical indicators of the currency pair:
  • Prev Open: 135.11
  • Prev Close: 135.47
  • % chg. over the last day: +0.27%

The yield differential between Japanese Government Bonds and US Treasuries still keeps the JPY low. However, the Bank of Japan holds its monetary policy soft as policymakers attribute rising inflation to rising energy and commodity prices. More and more analysts are starting to believe that at some point, the Bank of Japan will make currency intervention, as the yen’s weakness is taking a heavy toll on the Japanese economy. Both BOJ Governor Kuroda and Prime Ministerof Japan Kishida acknowledge this point.

Trading recommendations
  • Support levels: 134.84, 133.35, 131.67, 131.00, 130.12, 129.48, 128.76
  • Resistance levels: 135.88, 136.66

The medium-term trend on the USD/JPY currency pair is bullish. The price trades near the moving average lines and forms a wide price balance. The MACD indicator has become inactive. Under such market conditions, buy trades can be considered from the support level of 134.84 or 133.35, but with confirmation. A resistance level of 135.88 is good for sell deals, but only with additional confirmation and short targets.

Alternative scenario: If the price fixes below 133.35, the downtrend will likely resume.

USD/JPY
There is no news feed for today.

The USD/CAD currency pair

Technical indicators of the currency pair:
  • Prev Open: 1.2889
  • Prev Close: 1.2873
  • % chg. over the last day: -0.12%

The Canadian dollar is a commodity currency, so it depends not only on the US Dollar Index but also on oil prices. The dollar index declined yesterday, while oil prices grew during the last three trading sessions. As a result, the Canadian dollar has strengthened. It should be noted that the Bank of Canada is on its way to raising interest rates and the latest inflation data showed that inflation in Canada has not stopped rising. Therefore, on expectations of an aggressive rate hike at the next meeting, the Canadian dollar may continue its upward momentum in the coming days.

Trading recommendations
  • Support levels: 1.2815, 1.2709, 1.2618, 1.2578, 1.2510
  • Resistance levels: 1.2887, 1.2956, 1.3068

In terms of technical analysis, the trend on the USD/CAD currency pair is bullish. But the MACD indicator became negative, and the price is trading below the moving averages. Buyers are losing the initiative. A price move below 1.2815 will change the priority. Under such market conditions, it is better to look for buy deals in the lower time frames from the support level of 1.2815. For sell deals, it is better to consider the resistance level of 1.2956, but it is also better with confirmation and short targets.

Alternative scenario: if the price breaks through and consolidates below the 1.2815 support level, the downtrend will likely resume.

USD/CAD
There is no news feed for today.

By JustForex


This article reflects a personal opinion and should not be interpreted as an investment advice, and/or offer, and/or a persistent request for carrying out financial transactions, and/or a guarantee, and/or a forecast of future events.

Fears of a recession are decreasing. Russia has defaulted

By JustForex

On Monday, the US dollar fell slightly from a 20-year high hit earlier this month. It followed positive US economic data that eased expectations of an aggressive rate hike by the Federal Reserve. At the same time, stock indices also showed weakness, but usually, when the dollar index declines, indices rise.

At the close of trading on Monday, the Dow Jones index (US30) decreased by 0.20% and the S&P 500 index (US500) lost 0.30%. The technology index NASDAQ (US100) fell by 0.72% yesterday. At the end of the day, all three indices were down.

Goldman Sachs says the US rate market is underestimating the risk of recession. While market expectations for the Fed Funds rate have declined in recent weeks to levels with “limited downside potential for early 2023, federal funds pricing for 2024 likely underestimates recession risk,” strategists said. According to expectations implied by interest rate swaps, the Fed policy rate will peak at 3.60% by March 2023, up 2% from current levels.

Equity markets in Europe traded flat yesterday. German DAX (DE30) gained by 0.52%, French CAC 40 (FR 40) fell by 0.43%, Spanish IBEX 35 (ES35) lost 0.02%, British FTSE 100 (UK100) closed on Monday in plus 0.69%.

On Monday, Prime Minister Boris Johnson said that Britain may introduce unilateral changes to Northern Ireland’s trade rules after Brexit this year. The EU calls the move illegal.

Russia’s first major international default in more than a century became a fact on Monday. It was followed by months of coordinated Western sanctions that left Moscow with cash but denied access to an international financial network.

Oil jumped by 2% yesterday on rumors that a G7 decision against Russia would lead to further supply cuts. The Saudi-led OPEC+ alliance also cut its projected 2022 oil market surplus to 1 million barrels per day from a previous estimate of 1.4 million. Some oil investors are hesitant to open large positions after the US Energy Information Administration said the weekly inventory report would be delayed for the second week in a row because of server problems. The EIA weekly oil report was not released on June 24 and will likely not be released on June 29.

G7 leaders warned that Russian President Vladimir Putin would be held accountable for committing the heinous and deadly attack on a crowded shopping mall in Ukraine. According to President Vladimir Zelenski, at least 1,000 shoppers were in the mall when a Russian missile hit it, making it “one of the most devastating terrorist attacks in European history.” At least 18 people were killed and more than 40 injured. The number of casualties is difficult to determine as rescuers continue to search among the rubble. With a high probability, Russia will be declared a sponsor of terrorism in the near future.

Asian markets were trading higher on Monday. Japan’s Nikkei 225 (JP225) gained 1.43%, Hong Kong’s Hang Seng (HK50) added 2.35% for the day, and Australia’s S&P/ASX 200 (AU200) jumped by 1.94%.

Earlier this month, the Bank of Japan may have suffered a 600 billion yen ($4.4 billion) unrealized loss on Japanese government bonds as the widening gap between domestic and foreign monetary policy led to rising yields and prices. Despite this, the Bank of Japan continues to keep its monetary policy soft as policymakers attribute rising inflation to rising energy and commodity prices. More and more analysts are starting to think that at some point, the Bank of Japan will make currency intervention, as the yen’s weakness is taking a heavy toll on the Japanese economy. Both BOJ Governor Kuroda and Prime Minister of Japan Kishida acknowledge this point.

S&P 500 (F) (US500) 3,900.11 −11.63 (−0.30%)

Dow Jones (US30) 31,438.26 −62.42 (−0.20%)

DAX (DE40) 13,186.07 +67.94 (+0.52%)

FTSE 100 (UK100) 7,258.32 +49.51 (+0.69%)

USD Index 103.98 -0.21 (-0.20%)

Important events for today:
  • – US FOMC Member Williams Speaks (m/m) at 01:30 (GMT+3);
  • – ECB President Lagarde Speaks at 11:00 (GMT+3);
  • – US CB Consumer Confidence (m/m) at 17:00 (GMT+3).

By JustForex


This article reflects a personal opinion and should not be interpreted as an investment advice, and/or offer, and/or a persistent request for carrying out financial transactions, and/or a guarantee, and/or a forecast of future events.

SEC confirms Bitcoin is a commodity – THREE key takeaways for crypto investors

By George Prior 

– The inevitable regulation of the cryptocurrency market is “a significant step closer” due to comments made on Monday by the U.S. Securities and Exchange Commission (SEC) Chairman Gary Gensler, says Nigel Green, CEO of one of the world’s largest independent financial advisory organisations

Speaking to CNBC’s Jim Cramer, Gensler said that Bitcoin is now to be labelled as a commodity.

Nigel Green says: “The comments from Gary Gensler clears up years of debate. One of the world’s most influential regulators has now confirmed that it views Bitcoin as a commodity, in much the same way gold is, and not a security.

“The financial watchdog said that many tokens on the market have the key attributes of securities, which puts them under the jurisdiction of the SEC, but not Bitcoin.

“As a commodity in the U.S., Bitcoin would fall under the oversight of The Commodities Futures Trading Commission.”

The deVere CEO says that there are three key takeaways from the comments made by the SEC chief.

“First, the SEC’s approach is to galvanise Bitcoin’s long-held status as ‘digital gold.’

“Bitcoin is often referred to as ‘digital gold’ because like the precious metal it is a medium of exchange, a unit of account, non-sovereign, decentralised, scarce, and a store of value.”

He adds: “I believe that the world’s largest crypto will dethrone gold as the ultimate safe haven asset within a generation as millennials and younger investors, who are so-called ‘digital natives’, believe it competes better.

“Millennials are to become an increasingly important market participant in the coming years, with the largest-ever generational transfer of wealth – predicted to be more than $60 trillion – from baby boomers to millennials taking place.

“In addition, our world is becoming increasingly tech-driven and cryptocurrencies are, of course, digital by their very nature.

“Another key factor is the historic levels of money-printing as central banks around the world attempt to prop-up their economies following the fallout from the pandemic.

“If you are flooding the market with extra money, then in fact you are devaluing traditional currencies – and this, and the threat of inflation, are legitimate concerns to a growing number of investors, who are seeking alternatives.”

Nigel Green continues: “Second, Gensler said that regulators in the U.S., which include the SEC and the CFTC, have a lot of work to do in order to introduce comprehensive laws that would protect the investing public.

“This is a clear sign that the financial watchdogs are homing in on regulation of the sector. As I have long said, I believe this is inevitable – and it is something I support as cryptocurrencies become increasingly part of the mainstream, global financial system.”

He has previously been quoted by media outlets as saying “Proportionate regulation” should be championed as it would help protect investors, shore-up the market, tackle criminality, and reduce the potential possibility of disrupting global financial stability, as well as offering a potential long-term economic boost to those countries that introduce it.”

“Third, the wider crypto sector will take the comments made by the chair of the SEC as bullish. We can expect prices to gradually rise.”

Despite the current volatility, like many long-term crypto investors Nigel Green says he is still accumulating Bitcoin. “I’m using the volatility as a buying opportunity; I’m topping up my investment portfolio at a lower price point.

“The reason why I’m still buying Bitcoin? Because I’m confident that digital, global, borderless, decentralised, tamper-proof, unconfiscatable money is, clearly, the future.”

The deVere CEO is also doubling down on an earlier price prediction: “I remain confident that Bitcoin may get a tough summer, but that it could stage a bull run in the fourth quarter.”

About:

deVere Group is one of the world’s largest independent advisors of specialist global financial solutions to international, local mass affluent, and high-net-worth clients.  It has a network of more than 70 offices across the world, over 80,000 clients and $12bn under advisement.


Stocks steady while crude prices jump

By ForexTime

US stock futures have perked up this morning on news that China will cut its quarantine time on foreign travellers. This comes as Wall Street pared gains after initially rising from stronger-than-expected US durable goods data.

Meanwhile, there’s more action in the oil markets as crude extends its recent gains on supply disruptions.

The blue-chip benchmark S&P500 ended Monday 0.3% lower, after a turbulent day of trading in which the index slowly gave up earlier gains. The broad-based index remains around 18% lower for the year.

Technically, the S&P500 had been trading at the bottom of a bear channel after the highs at the end of March.

Prices were also oversold on the daily and weekly charts with the RSIs dipping towards 30. The rebound has taken us above the May low at 3811.1 and the bulls are now challenging trendline resistance from the October 2021 low.

Above here is the key psychological level at 4,000 with the 50-day simple moving average at 4028.4.


Crude bounces off trendline support

Oil prices had their worst week since early April, with Brent falling more than 7% over the last week. 

Concern over the macro outlook has weighed heavily despite fundamentals remaining constructive. G-7 nations are meeting at the moment, and discussions around a potential price limit on Russian oil appear to be on the agenda. It is suggested that any limits would be done through insurance and shipping.

However, it would likely take some time to come to an agreement and would require the EU to renegotiate its last round of sanctions which some member countries may be reluctant to do, given how long it originally took EU countries to finalise its Russian oil ban.

OPEC members are set to meet tomorrow with an OPEC+ ministerial meeting on Thursday.

The cartel already agreed at its previous meeting on larger supply increases for July and August so confirmation of that supply increase for August is expected.

After falling sharply from the high at the start of the month at $123.27, Brent found support last week at the upward trendline touching the March, April and May lows. The 100-day simple moving average has also helped hold up prices and currently sits at $107.76.

We are now trading just above the 50-day simple moving average at $111.64 with bulls eyeing up the $114 resistance level which had capped Brent prices for much of April-May.


Forex-Time-LogoArticle by ForexTime

ForexTime Ltd (FXTM) is an award winning international online forex broker regulated by CySEC 185/12 www.forextime.com

Wealth of nations: Why some are rich, others are poor – and what it means for future prosperity

By Amitrajeet A. Batabyal, Rochester Institute of Technology 

– Why are some nations rich and others poor? Can the governments of poor nations do something to ensure that their nations become rich? These sorts of questions have long fascinated public officials and economists, at least since Adam Smith, the prominent Scottish economist whose famous 1776 book was titled “An Inquiry into the Nature and Causes of the Wealth of Nations.”

Economic growth matters to a country because it can raise living standards and provide fiscal stability to its people. But getting the recipe consistently right has eluded both nations and economists for hundreds of years.

As an economist who studies regional, national and international economics, I believe that understanding an economic term called total factor productivity can provide insight into how nations become wealthy.

Growth theory

It is important to understand what helps a country grow its wealth. In 1956, Massachusetts Institute of Technology economist Robert Solow wrote a paper analyzing how labor – otherwise known as workers – and capital – otherwise known as physical items such as tools, machinery and equipment – can be combined to produce goods and services that ultimately determine people’s standard of living. Solow later went on to win a Nobel Prize for his work.

One way to increase a nation’s overall quantity of goods or services is to increase labor, capital or both. But that doesn’t continue growth indefinitely. At some point, adding more labor only means that the goods and services these workers produce is divided between more workers. Hence, the output per worker – which is one way of looking at a nation’s wealth – will tend to go down.

Similarly, adding more capital such as machinery or other equipment endlessly is also unhelpful, because those physical items tend to wear out or depreciate. A company would need frequent financial investment to counteract the negative effect of this wear and tear.

In a later paper in 1957, Solow used U.S. data to show that ingredients in addition to labor and capital were needed to make a nation wealthier.

He found that only 12.5% of the observed increase in American output per worker – the quantity of what each worker produced – from 1909 to 1949 could be attributed to workers becoming more productive during this time period. This implies that 87.5% of the observed increase in output per worker was explained by something else.

Total factor productivity

Solow called this something else “technical change,” and today it is best known as total factor productivity.

Total factor productivity is the portion of goods and services produced that is not explained by the capital and labor used in production. For example, it could be technological advancements that make it easier to produce goods.

Another way to understand total factor productivity.

It’s best to think of total factor productivity as a recipe that shows how to combine capital and labor to obtain output. Specifically, growing it is akin to creating a cookie recipe to ensure that the largest number of cookies – that also taste great – are produced. Sometimes this recipe gets better over time because, for example, the cookies can bake faster in a new type of oven or workers become more knowledgeable about how to mix ingredients more efficiently.

Will total factor productivity continue to grow in the future?

Given how important total factor productivity is to economic growth, asking about the future of economic growth is basically the same as asking whether total factor productivity will continue to grow – whether the recipes will always get better – over time.

Solow assumed that TFP would grow exponentially over time, a dynamic explained by the economist Paul Romer, who also won a Nobel Prize for his research in this field.

Romer argued in a prominent 1986 paper that investments in research and development that result in the creation of new knowledge can be a key driver of economic growth.

This means that each earlier bit of knowledge makes the next bit of knowledge more useful. Put differently, knowledge has a spillover effect that creates more knowledge as it spills out.

Despite Romer’s efforts to provide a basis for the assumed exponential growth of TFP, research shows that productivity growth in the world’s advanced economies has been declining since the late 1990s and is now at historically low levels. There are concerns that the COVID-19 crisis may exacerbate this negative trend and further reduce total factor productivity growth.

Recent research shows that if TFP growth falls, then this can negatively affect living standards in the U.S. and in other rich countries.

A very recent paper by the economist Thomas Philippon analyzes a large amount of data for 23 countries over 129 years, finding that TFP does not actually grow exponentially, as Solow and Romer had thought.

Instead, it grows in a linear, and slower, progression. Philippon’s analysis suggests that new ideas and new recipes do add to the existing stock of knowledge, but they don’t have the multiplier effect previous scholars had thought.

Ultimately, this finding means that economic growth used to be quite fast and is now slowing down – but it’s still occurring. The U.S. and other nations can expect to get wealthier over time but just not as quickly as economists once expected.The Conversation

About the Author:

Amitrajeet A. Batabyal, Distinguished Professor and Arthur J. Gosnell Professor of Economics, Rochester Institute of Technology

This article is republished from The Conversation under a Creative Commons license. Read the original article.

 

Crude Oil Is Consolidating

By RoboForex Analytical Department

On Monday morning, the Brent price is balancing at $113 per barrel The commodity marker remains uncertain – the supply isn’t expanding as quick as it is expected to, and the demand might drop as well.

China is cancelling lockdowns but it does not necessarily mean that the country will start increasing its oil import right away. There are doubts about the Chinese economy’s ability to quickly and steadily expand at a time when the entire world is fighting inflation and afraid of recession.

OPEC+ members are working according to their earlier approved plan to increase oil production. This factor might have calmed down financial markets but Libya remains a mess and the Iranian oil won’t come to the commodity market in a while. Taken together, all these factors create a rather controversial basis.

In the H4 chart, having completed the correctional wave at 107.30, Brent continues growing towards 113.30 and may later consolidate there. After that, the instrument may break the range to the upside and form one more ascending wave with the target at 117.60. From the technical point of view, this scenario is confirmed by MACD Oscillator: its signal line is moving near the lows outside the histogram area, which means that it may grow to reach 0 and the uptrend in the price chart may continue.

As we can see in the H1 chart, after finishing the ascending wave at 113.30 along with the correction down to 110.15, Brent has rebounded from the latter level. Possibly, the asset may break 113.30 and then continue growing towards 117.70. Later, the market may correct to return to 113.30 and then form one more ascending structure with the first target at 119.50. From the technical point of view, this idea is confirmed by the Stochastic Oscillator: after rebounding from 50, its signal line is expected to continue moving towards 80.

Disclaimer

Any forecasts contained herein are based on the author’s particular opinion. This analysis may not be treated as trading advice. RoboForex bears no responsibility for trading results based on trading recommendations and reviews contained herein.

Japanese Candlesticks Analysis 27.06.2022 (EURUSD, USDJPY, EURGBP)

Article By RoboForex.com

EURUSD, “Euro vs US Dollar”

As we can see in the H4 chart, the asset has formed an Inverted Hammer reversal pattern close to the support area during the correction. At the moment, EURUSD may reverse in the form of a new ascending impulse. In this case, the upside target may be at 1.0595. However, an alternative scenario implies that the price may fall to reach 1.0490 and continue the downtrend without testing 1.0595.

EURUSD
Risk Warning: the result of previous trading operations do not guarantee the same results in the future

USDJPY, “US Dollar vs Japanese Yen”

As we can see in the H4 chart, USDJPY has formed several reversal patterns not far from the support area, such as Hammer. At the moment, the asset is reversing in the form of a new rising impulse. In this case, the upside target may be at 137.50. At the same time, an opposite scenario implies that the price may correct to reach 134.15 and resume the uptrend after a pullback.

USDJPY
Risk Warning: the result of previous trading operations do not guarantee the same results in the future

EURGBP, “Euro vs Great Britain Pound”

As we can see in the H4 chart, after forming aт Engulfing pattern near the support area, EURGBP is reversing in the form of a new rising impulse. In this case, the upside target may be the resistance level at 0.8655. Later, the market may test this level, break it, and continue moving upwards. Still, there might be an alternative scenario, according to which the asset may correct to reach 0.8570 before resuming the ascending tendency.

EURGBP

Article By RoboForex.com

Attention!
Forecasts presented in this section only reflect the author’s private opinion and should not be considered as guidance for trading. RoboForex LP bears no responsibility for trading results based on trading recommendations described in these analytical reviews.

Trade Of The Week: Will Central Bank Heavyweights Spark EURUSD Breakout?

By ForexTime 

– Watch this space because the EURUSD could turn volatile over the next few days!

Investors will be served a tantalizing combination of key economic reports and speeches from policymakers this week. However, the main course and potential market shaker could be the ECB’s three-day forum in Portugal’s Sintra which kicks off today. The forum will be focusing on “the challenges for monetary policy in a rapidly changing world” with Wednesday’s panel discussion featuring central bank heavyweights in sharp focus.

Before we sink our teeth into what to expect from the major events and EURUSD in the week ahead, it is worth keeping in mind that the euro has appreciated against most G10 currencies quarter-to-date. But against the mighty dollar, the currency is down roughly 4.7% due to the ECB lagging behind the Fed, which has moved aggressively to tame inflation.

Taking a quick look at the technical picture, the EURUSD is balancing above significant support at 1.0400 on the monthly timeframe. The last time prices secured a monthly close below this level was in December 2002.

The trend is heavily bearish on the weekly timeframe as there have been consistently lower lows and lower highs.

Now, this is where things get interesting.

On the technical charts, the EURUSD remains in a downtrend with the widening policy divergence between the ECB and Fed supporting bears in the past. However, the ECB has recently joined the hawkish camp and signalled to markets it plans to raise interest rates by 25 basis points in July. In fact, the central bank could also move ahead with a 50bps hike in September as it battles the inflation beast! Such a development is likely to favour euro bulls – limiting downside losses on the EURUSD.

The week ahead: data, policymakers, and more…

Grab your popcorn and find a comfortable seat because the show is about to begin.

On Tuesday, San Francisco Fed President Mary Daly will be under the spotlight. Last Friday she stated that another 75 basis point interest rate hike in July is her “starting point” but if the economy slows more than expected a 50 basis point could be reasonable. Investors will also be presented with the US consumer confidence data for June which is expected to deteriorate further.

Several Fed officials will be making an appearance on Wednesday.

However, the main risk event will be the ECB panel featuring ECB President Christine Lagarde, Fed Chair Jerome Powell, and BOE Governor Andrew Bailey.

Investors will be closely watching the panel discussion for fresh insights on how the central bank heads plan to fight inflation while trying to engineer a soft landing for the global economy. Given how markets remain highly sensitive to rate hike expectations, any fresh clues about future rate hikes could trigger fresh volatility in the FX space. On the data front, Eurozone economic confidence, German inflation figures for June, and third print US Q1 GDP figures will also be published.

On Thursday, it’s all about the Eurozone unemployment figures for May which are expected to remain unchanged at a record low of 6.8%. In the United States, the weekly initial jobless claims, personal income/spending, and PCE deflator for May will most likely hijack the spotlight in the afternoon.

Given how the core Personal Consumption Expenditure (PCE) Index is the Fed’s favoured measure of inflation, this will be closely scrutinised by market players.

According to a survey on Bloomberg, the PCE Core Deflator YoY is expected to have cooled to 4.8% in May compared to the 4.9% witnessed in the previous month. If expectations match reality, this could fuel speculation around inflation peaking – cooling rate hike bets and weakening the dollar.

To conclude the week, the flash Eurozone CPI figures and manufacturing PMI for June will be published. Eurozone inflation is estimated to have hit 8.5% in June, higher than the record-high of 8.1% seen in May. If the reports meet expectations, this could boost speculation over the ECB adopting an aggressive approach towards higher interest rates to fight inflation. Such a development could boost the euro. We also have the US ISM manufacturing and Global manufacturing PMI figure for June on Friday afternoon which may show how the US economy is coping amid the Fed’s aggressive rate hiking cycle.

With so much going on this week, the EURUSD has the potential to throw investors on a roller coaster ride!

EURUSD poised to breakout from range?

Over the past few weeks, the EURUSD has been trapped within a wide range with support at 1.0350 and resistance at 1.0780. Although the overall trend remains bearish, there seems to be a struggle between bulls and bears and this continues to be reflected in price action.

There are a couple of scenarios that could play out on the EURUSD in the week ahead.

  1. A solid breakout and daily close above 1.0630 may trigger an incline towards 1.0780 and 1.0920.

  1. Prices fail to conquer the 1.0630 resistance which results in a decline back towards 1.0480, 1.0350, and 1.0200.

  1. Prices remain trapped within the 1.0480 support and 1.0630 resistance level with a possibility of sinking back towards 1.0350.


Forex-Time-LogoArticle by ForexTime

ForexTime Ltd (FXTM) is an award winning international online forex broker regulated by CySEC 185/12 www.forextime.com