By JustForex
Investors looked closely at the Federal Reserve’s latest FOMC protocol, which provided new data on the Central Bank’s monetary policy and the fight against inflation. According to the latest FOMC minutes, the Fed will also raise interest rates by 0.75% at its July meeting. The committee also lowered its growth forecast for the second half of 2022 and 2023. The minutes reflect participants’ concerns that a rate hike has a “greater than expected” impact on economic growth. Participants have not seen enough evidence that supply constraints have loosened enough to help control inflation.
According to analysts, a 50 basis point rate hike at the July meeting indicates a final rate of 3%, and a 75 basis point hike suggests a peak of 3.25% or 3.5%. At 3.5%, there is about a 50% chance of recession.
The ISM US Services PMI Index was 55.3 in June, down from 55.9 in May but better than expected at 54 points.
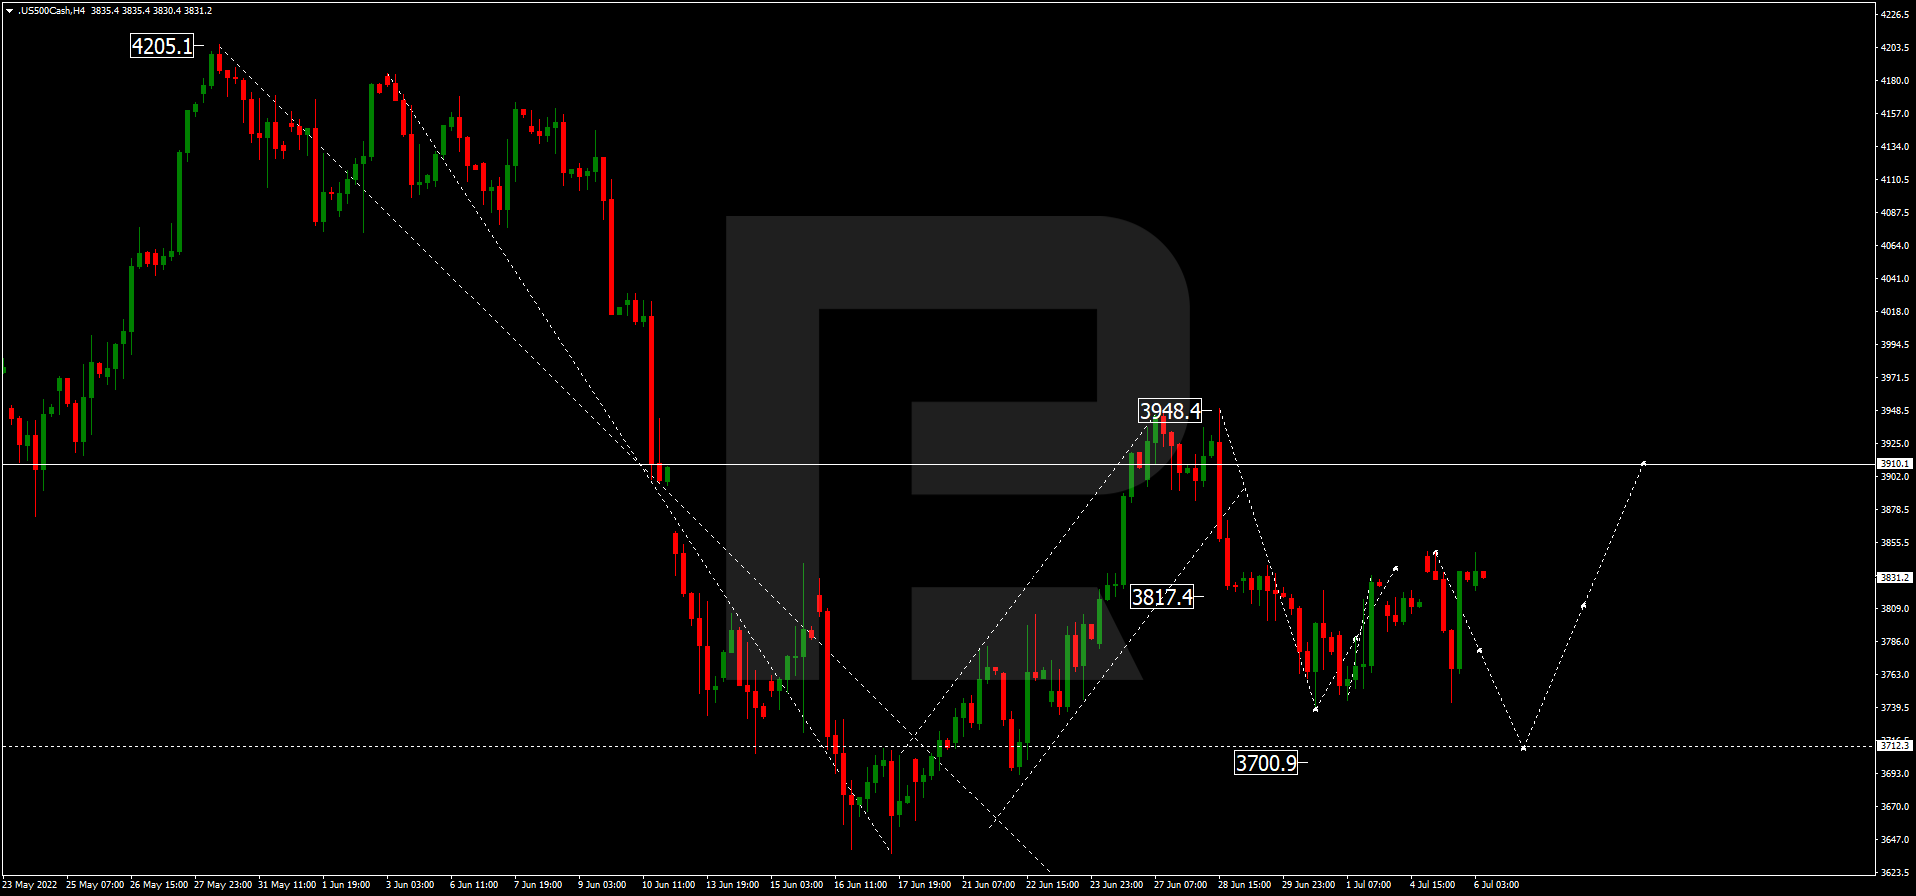
As the stock market closed yesterday, the Dow Jones Index (US30) increased by 0.23%, and the S&P 500 Index (US500) added 0.36%. The technology index NASDAQ (US100) gained 0.35% on Wednesday. All three indices ended the day in the green territory.
IStock markets in Europe mostly rose yesterday. German DAX (DE30) gained 1.56%, French CAC 40 (FR40) jumped by 2.03%, Spanish IBEX 35 (ES35) decreased by 0.14%, British FTSE 100 (UK100) was up by 1.17%.
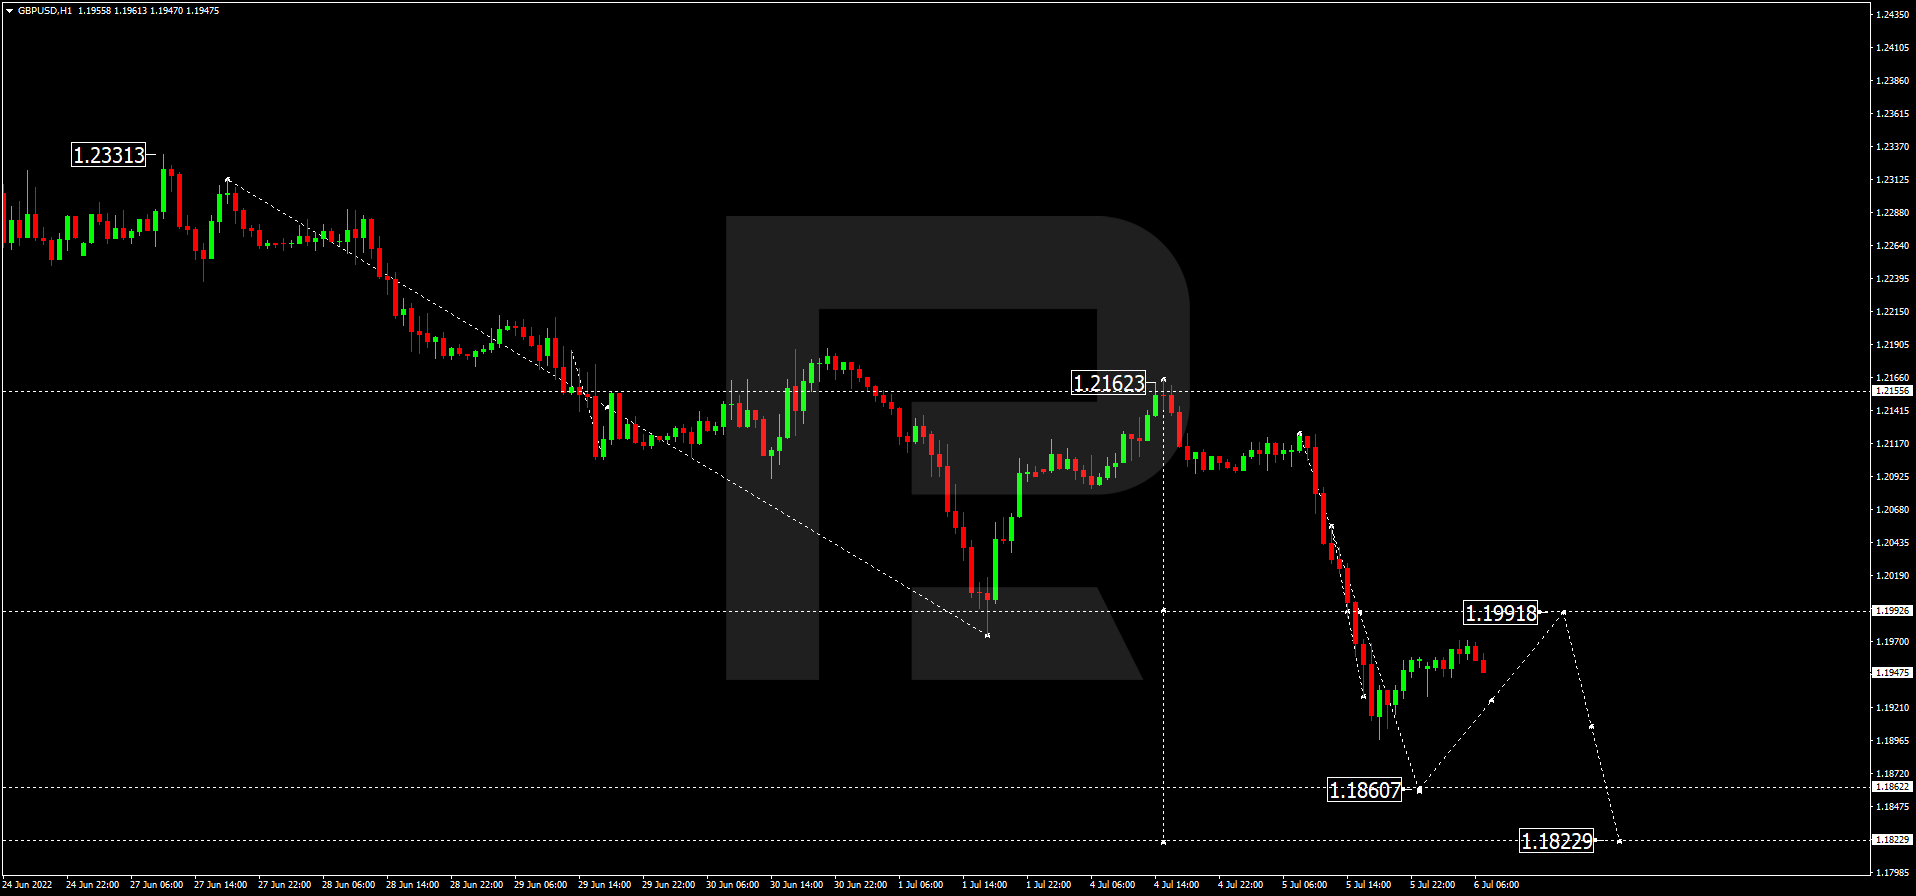
More than 35 members of the British government resigned in less than 24 hours. One in five members of parliament who have held public office left his post. Boris Johnson is ignoring calls to step down despite the massive layoffs of officials. “The prime minister’s job is to lead the country through difficult times,” he said. Mr. Johnson added that millions voted for him and wondered if any potential successors could replicate his success in the next election. Despite the political problems, the Bank of England’s chief economist Hugh Pill is confident that the Bank of England will return inflation to its target level of 2%. However, he did not clarify when this would happen.
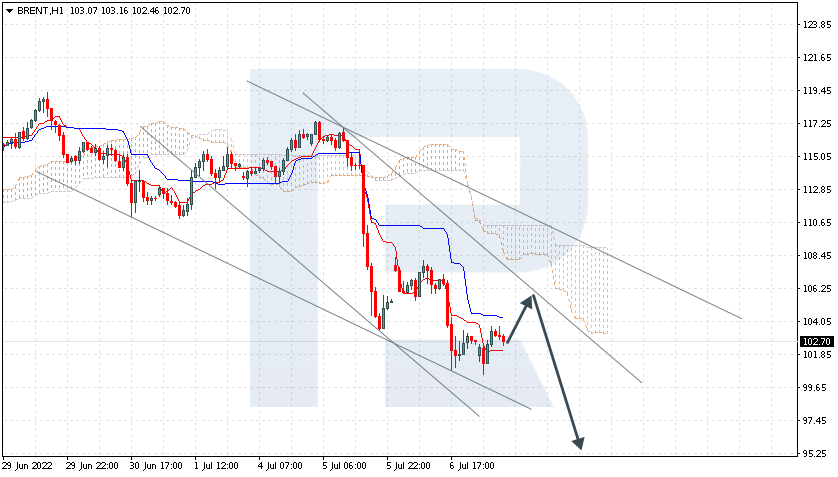
All oil and gas fields affected by the strike in Norway’s oil sector are expected to return to full operation within days. Analysts expect oil prices to recover quickly as supply shortages persist. Goldman Sachs raised its natural gas price forecasts, saying that full restoration of Russian gas supplies via Nord Stream 1 is no longer a likely scenario. On the other hand, Citigroup says WTI could fall to $65 a barrel by the end of this year and fall to $45 by the end of 2023 if demand declines.
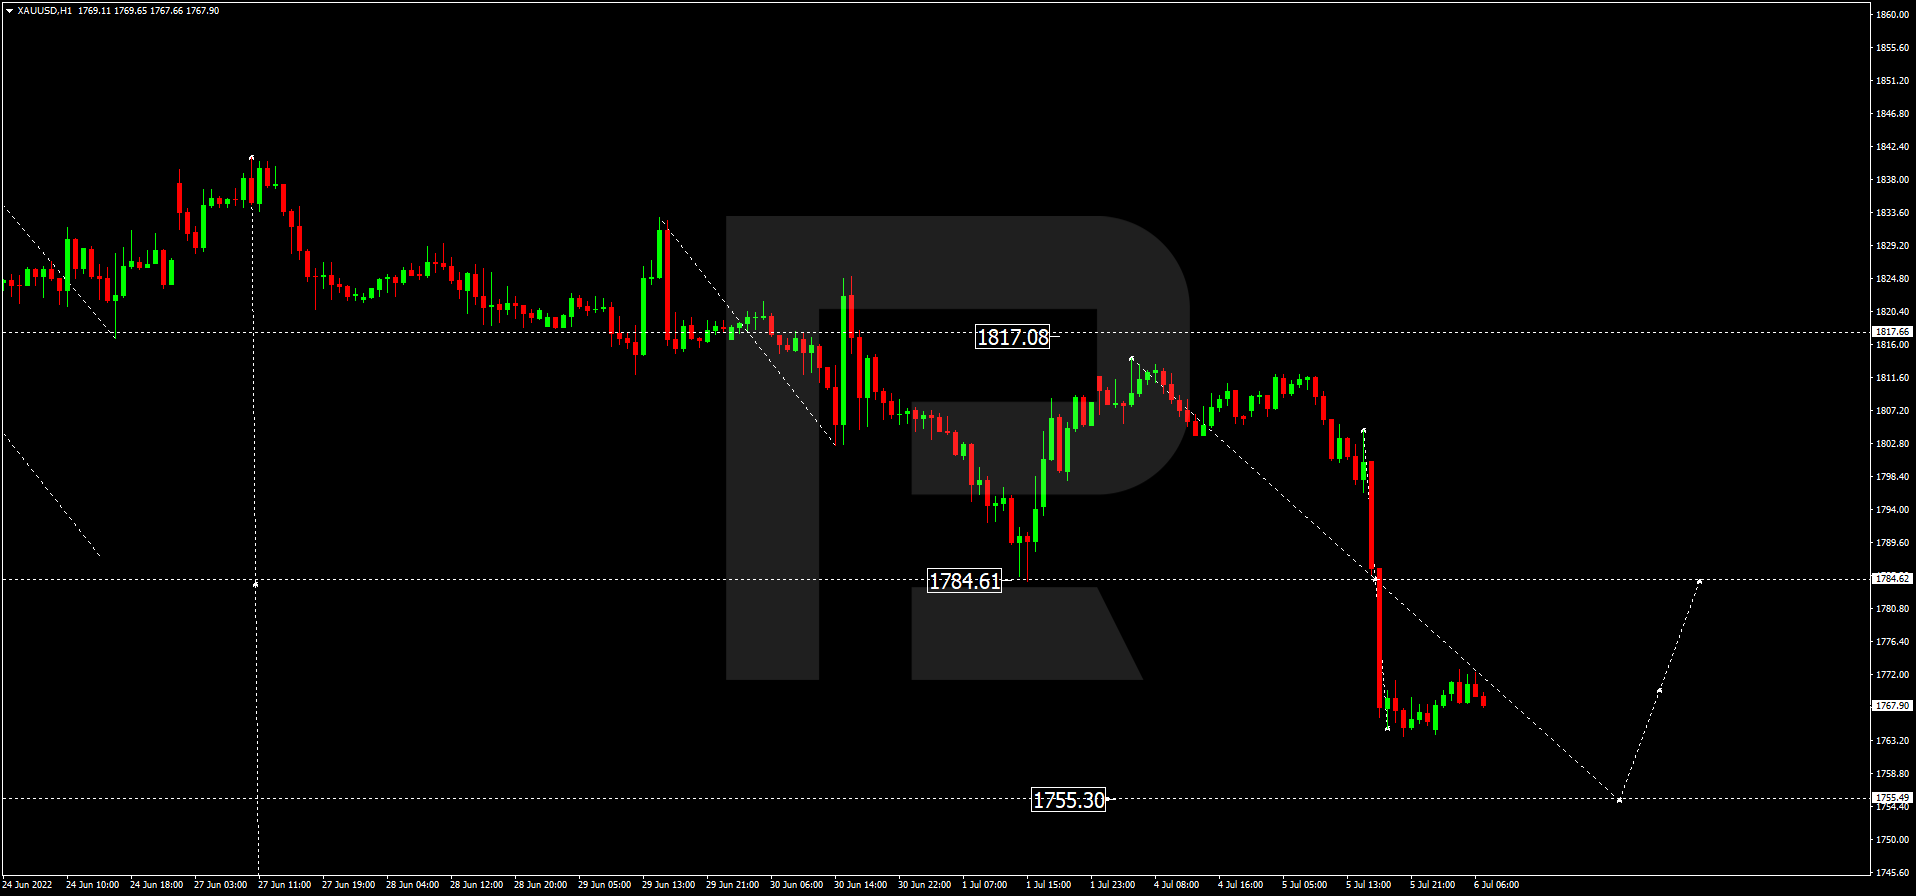
Gold hit a 10-month low on the back of hawkish US Federal Reserve policy, pushing up the dollar and government bond yields. According to the minutes of the Central Bank meeting, the Fed believes there is a real danger that high inflation will take root in the US economy and that an appropriate increase in interest rates will be the only way to balance unrestrained prices with growth. In other words, gold and silver have no fundamental reason to rise.
Asian markets closed lower yesterday. Japan’s Nikkei 225 (JP225) decreased by 1.20% yesterday, Hong Kong’s Hang Seng (HK50) ended the day down 1.22%, and Australia’s S&P/ASX 200 (AU200) fell by 0.52% on Wednesday.
China’s economy is expected to gradually overcome the negative effects of the epidemic in the second half of this year, with economic indicators showing improvement amid a series of supportive policy measures, according to a report from the People’s Bank of China. According to the report, employment in the country remains stable despite the problems, and price growth is kept in a moderate range, giving the authorities more room for maneuver in macroeconomic policy. The report suggests using soft monetary policy to help businesses overcome difficulties, expand efficient investment and stabilize growth.
S&P 500 (F) (US500) 3,845.08 +13.69 (+0.36%)
Dow Jones (US30) 31,037.68 +69.86 (+0.23%)
DAX (DE40) 12,594.52 +193.32 (+1.56%)
FTSE 100 (UK100) 7,107.77 +82.30 (+1.17%)
USD Index 107.06 +0.53 (+0.50%)
Important events for today:
- – Switzerland Unemployment Rate (m/m) at 08:45 (GMT+3);
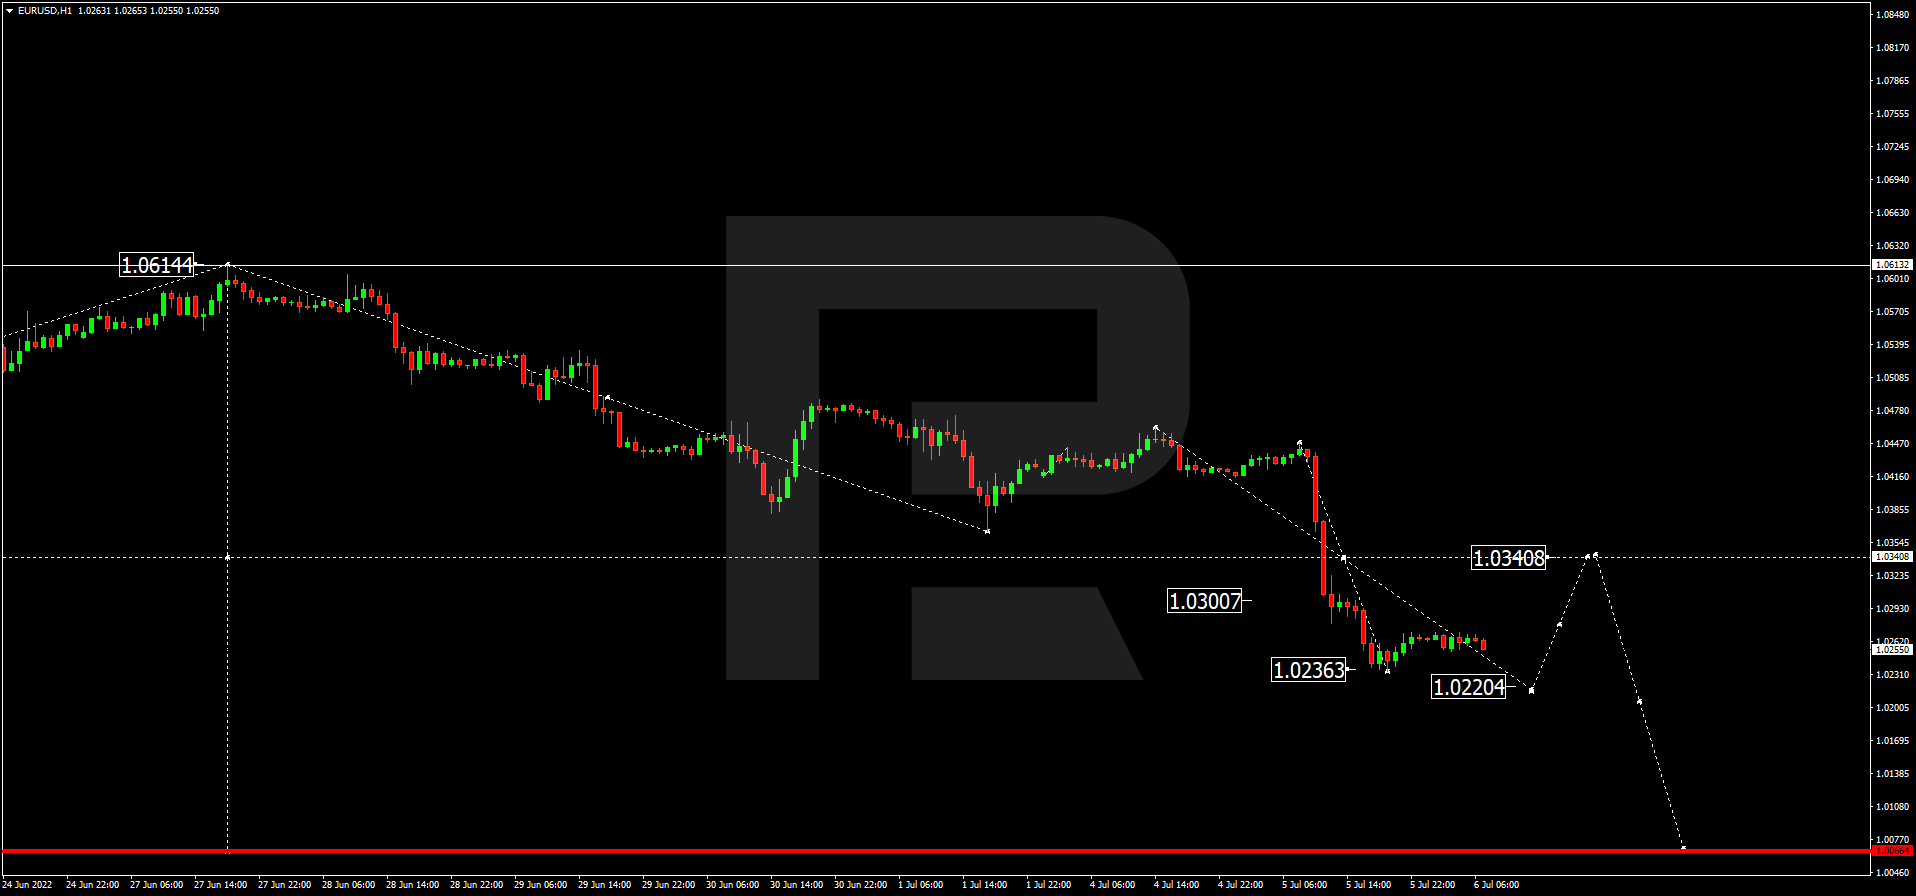
- – Eurozone German Industrial Production (m/m) at 09:00 (GMT+3);
- – Eurozone ECB Monetary Policy Meeting (m/m) at 14:30 (GMT+3);
- – US ADP Nonfarm Employment Change (m/m) at 15:15 (GMT+3);
- – US Initial Jobless Claims (w/w) at 15:30 (GMT+3);
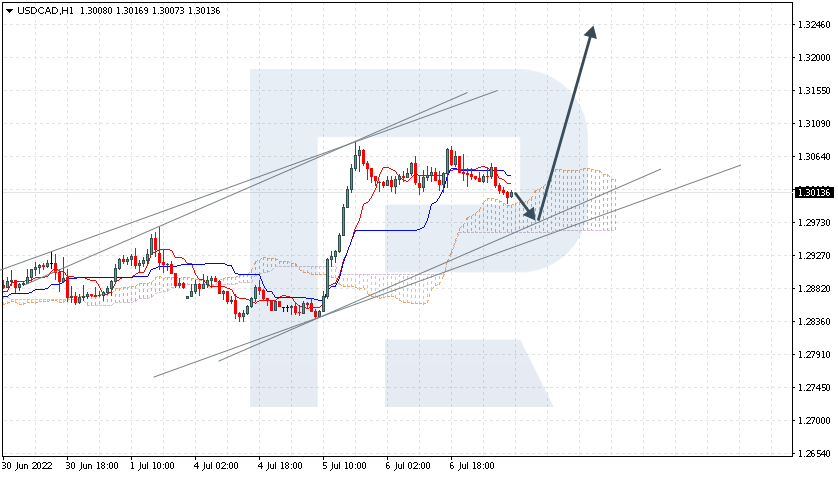
- – Canada Ivey PMI (m/m) at 17:00 (GMT+3);
- – US Natural Gas Storage (w/w) at 17:30 (GMT+3);
- – US Crude Oil Reserves (w/w) at 18:00 (GMT+3);
- – US FOMC Member Bullard Speaks at 20:00 (GMT+3);
- – US FOMC Member Waller Speaks at 20:00 (GMT+3).
By JustForex
This article reflects a personal opinion and should not be interpreted as an investment advice, and/or offer, and/or a persistent request for carrying out financial transactions, and/or a guarantee, and/or a forecast of future events.