By JustForex
The EUR/USD currency pair
- Prev Open: 1.0212
- Prev Close: 1.0260
- % chg. over the last day: +0.47%
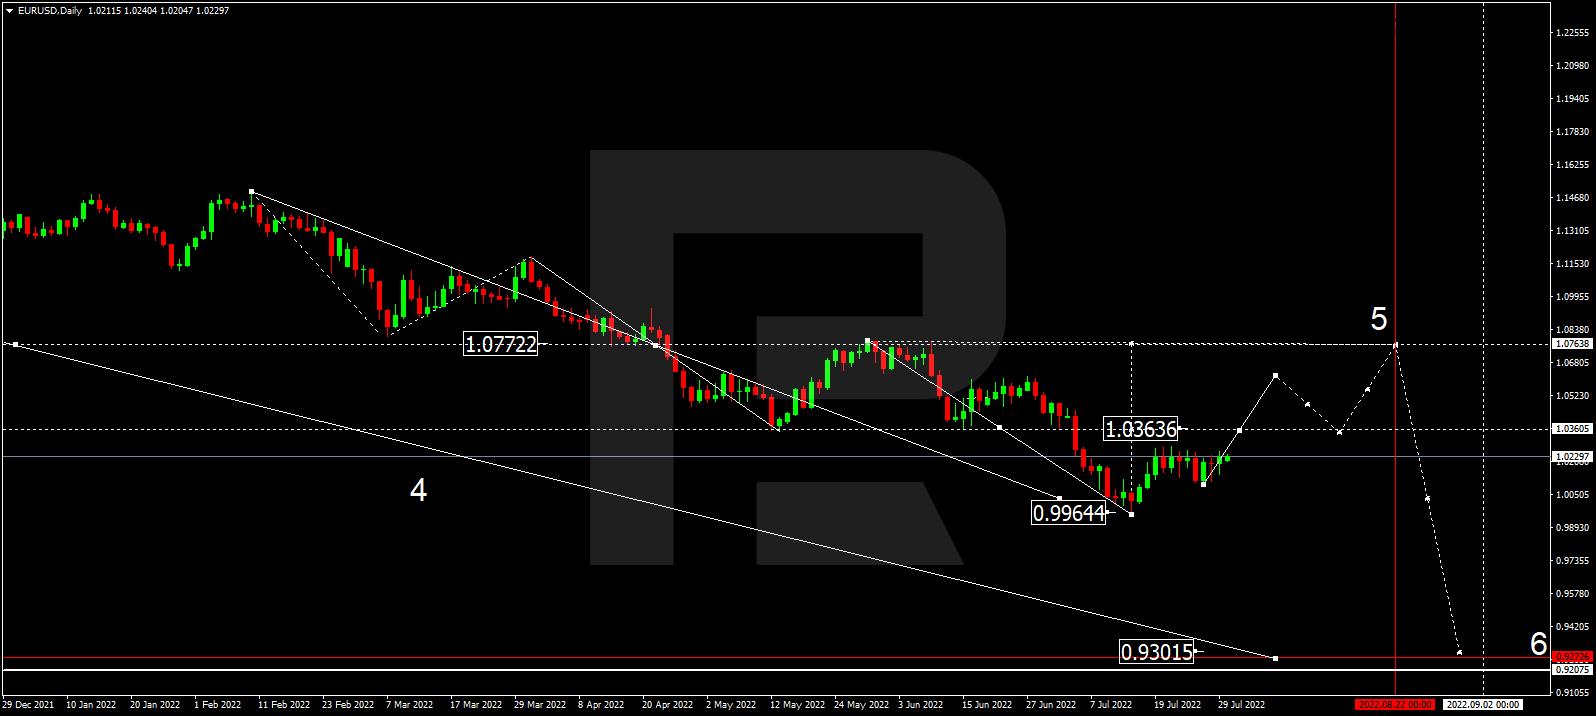
European manufacturing PMI dipped below the level of 50 in July. This usually means that a country is approaching a recession. It is a preliminary and rough indicator, but the statistics show that a drop of 50 triggers recessive processes in the country. The Central Bank has begun to work toward easing monetary policy. In Spain, the Index fell from 52.6 to 48.7, Italy from 50.9 to 48.5, France from 49.6 to 49.5, Germany from 52 to 49.3, and the overall Eurozone PMI fell from 52.1 to 49.8. With the ECB just starting to tighten monetary policy and raise interest rates, Europe will slowly deepen into recession. Winter will not be easy for Europe.
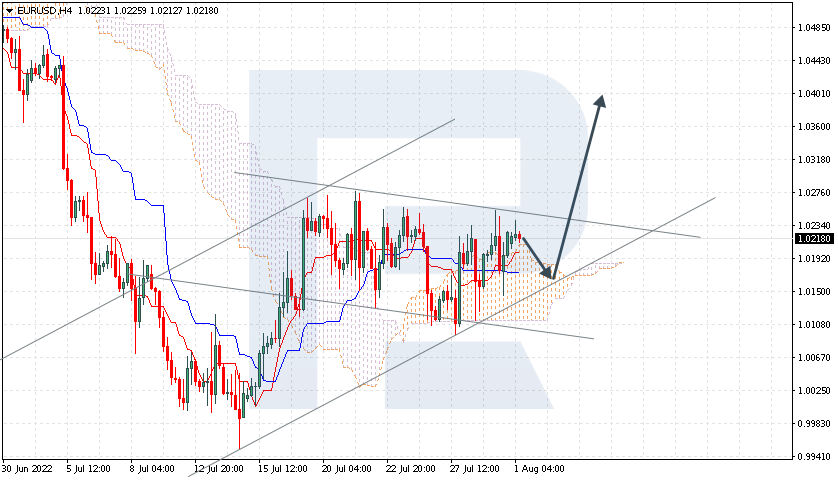
- Support levels: 1.0112, 1.0035, 1.0000
- Resistance levels: 1.0284, 1.0365, 1.0415, 1.050
From the technical point of view, the trend on the EUR/USD currency pair on the hourly time frame is bullish. The price is still forming a wide volatile balance, and buyer pressure prevails now. The MACD indicator is in the positive zone. Under such market conditions, buy trades are best sought on intraday time frames from the support level of 1.0112. Sell trades can be considered from the resistance level of 1.0284, but only after additional confirmation and only with short targets.
Alternative scenario: if the price breaks down through the 1.0112 support level and fixes below, the downtrend will likely resume.

- – US JOLTs Job Openings (m/m) at 17:00 (GMT+3).
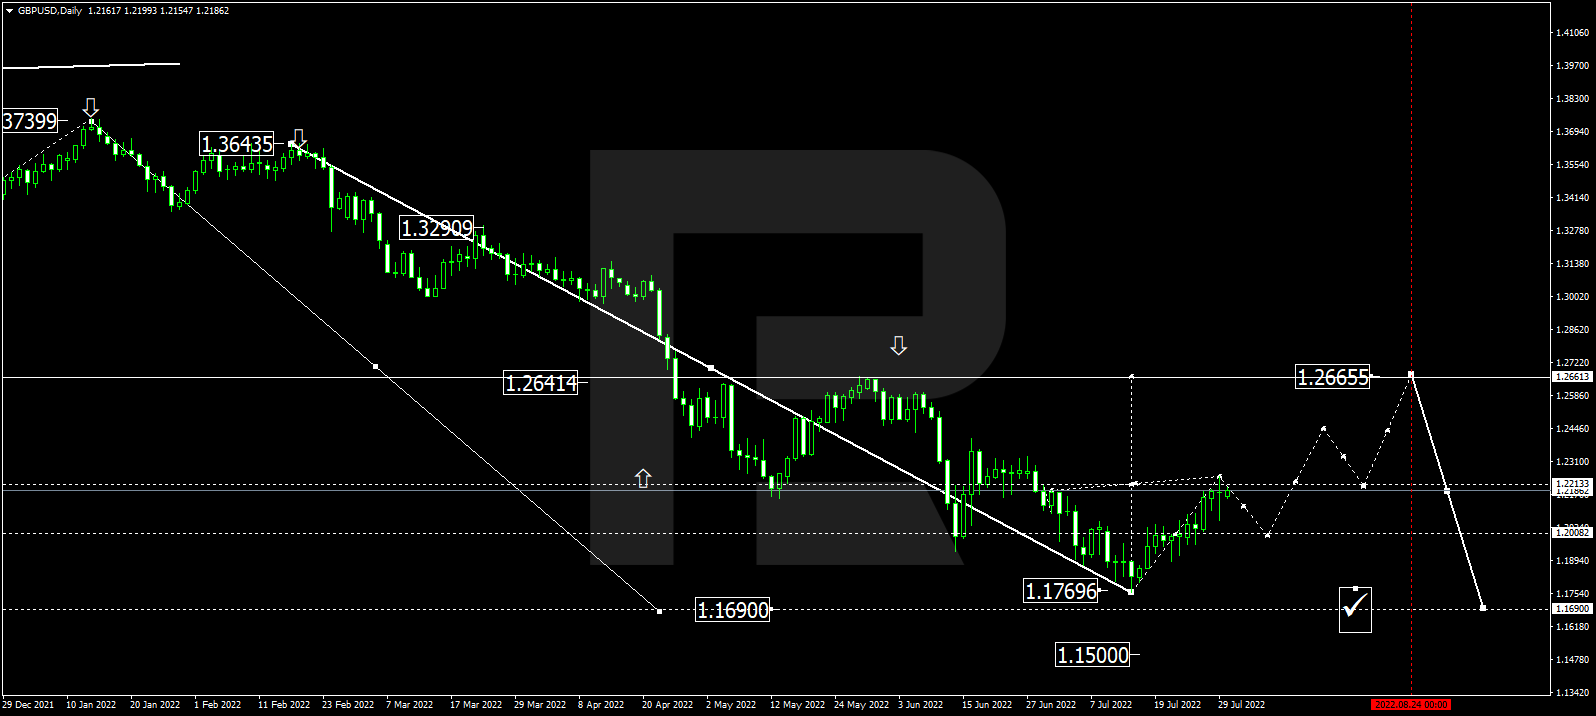
The GBP/USD currency pair
- Prev Open: 1.2164
- Prev Close: 1.2254
- % chg. over the last day: +0.74%
The UK manufacturing PMI declined from 52.8 to 52.1, which is better than the rest of Europe. Output fell for the first time in more than two years as new orders and export shipments continued to fall. The PMI held above the 50 mark thanks to faster job growth, increased inventories of purchases, and longer lead times for suppliers. Manufacturing output declined for the first time since May 2020, largely reflecting the downturn in the consumer and intermediate goods sub-sectors.
- Support levels: 1.2203, 1.2150, 1.2114, 1.2063, 1.1907, 1.1803
- Resistance levels: 1.2294
From the technical point of view, the GBP/USD currency pair trend on the hourly time frame is bullish. The price reached the daily resistance level. The MACD indicator is in the positive zone but shows signs of divergence already in several time frames. Under such market conditions, it is better to look for buy trades on the intraday time frames from the support level 1.2203, but only with confirmation. Sell trades can be considered from the resistance level of 1.2294, but only after additional confirmation and with short targets.
Alternative scenario: if the price breaks down through the 1.2006 support level and fixes below, the downtrend will likely resume.

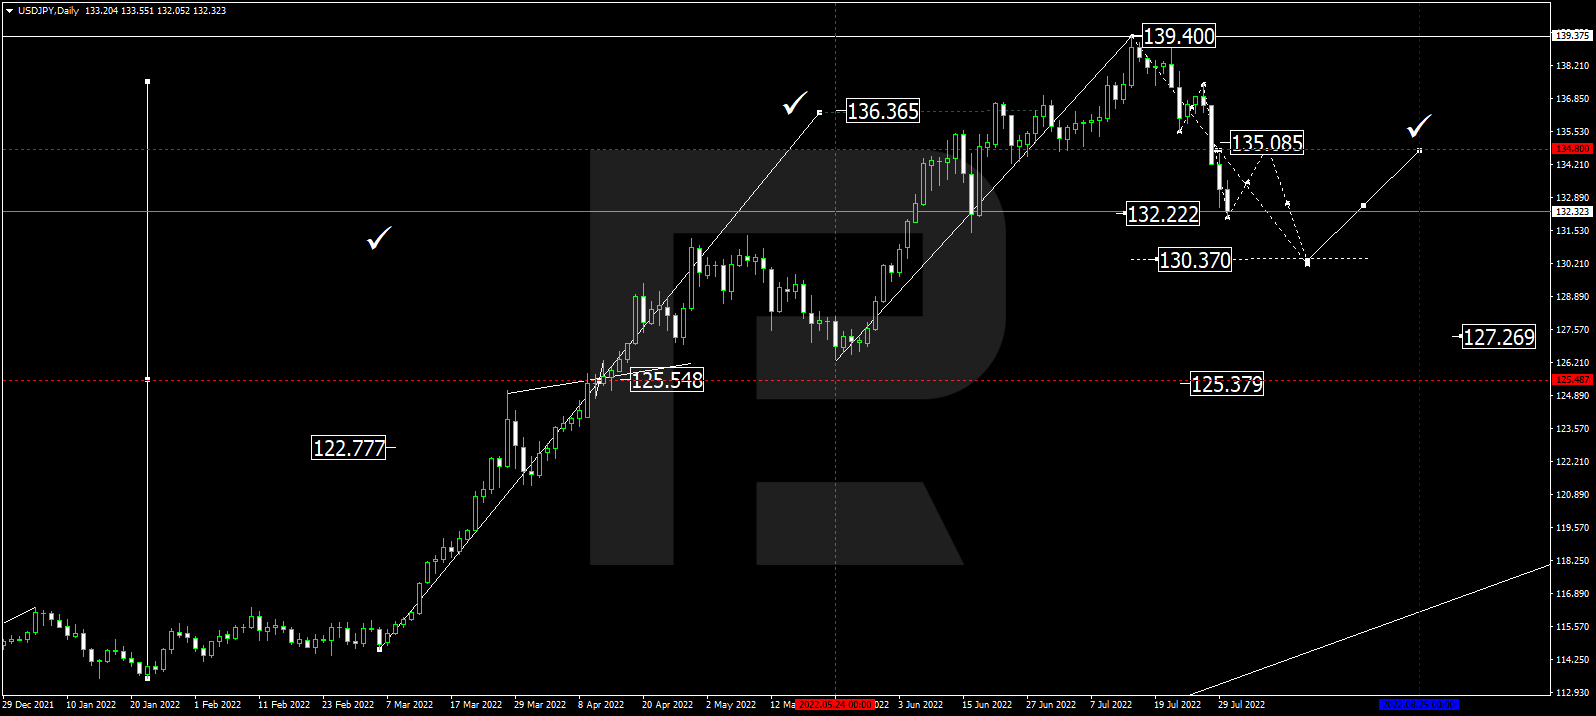
The USD/JPY currency pair
- Prev Open: 133.25
- Prev Close: 131.60
- % chg. over the last day: -1.25%
The Japanese yen is strengthening amid a decline in US yields. The dollar also declined, falling to its lowest level in two months. Nervousness over an upcoming visit to Taiwan by US House Speaker Nancy Pelosi also led to an influx of capital into the yen and put pressure on other Asian currencies. However, it should not be noted that the difference between the US and Japanese interest rates is not in favor of the Japanese yen, so at any time, upward movement on the currency pair USD/JPY may resume.
- Support levels: 130.85
- Resistance levels: 131.37, 133.17, 134.00, 135.10, 136.03, 137.11
From the technical point of view, the medium-term trend on the USD/JPY currency pair is bearish. In the last trading sessions, the Japanese yen is getting stronger. The MACD indicator is in the negative zone, and the sellers’ pressure is still there, but there are signs of divergence. Under such market conditions, buy trades can be sought from the support level of 130.85, but with additional confirmation. Resistance levels of 131.37 may be considered for sell deals, but only with additional confirmation and short targets.
Alternative scenario: If the price fixes above 136.03, the uptrend will likely resume.

The USD/CAD currency pair
- Prev Open: 1.2808
- Prev Close: 1.2837
- % chg. over the last day: +0.22%
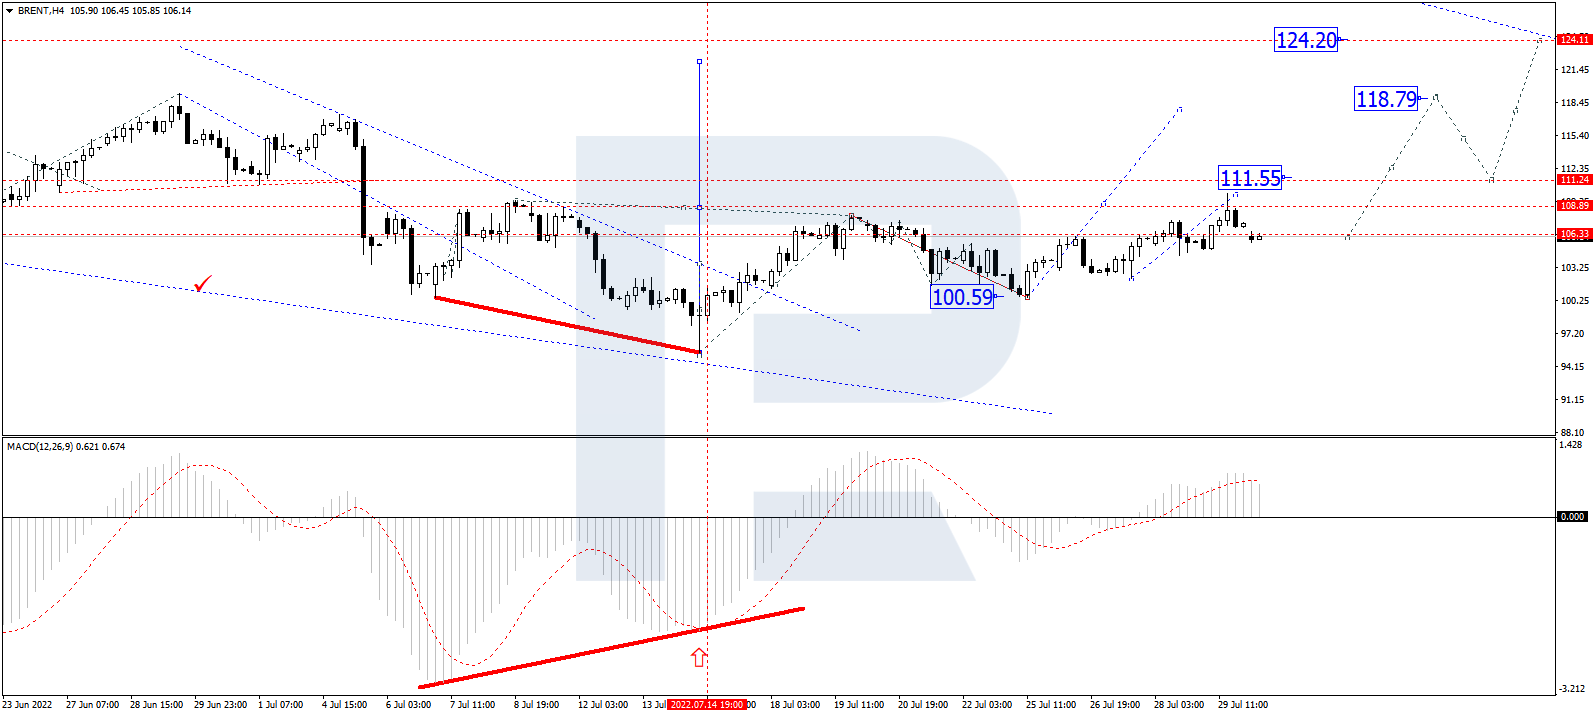
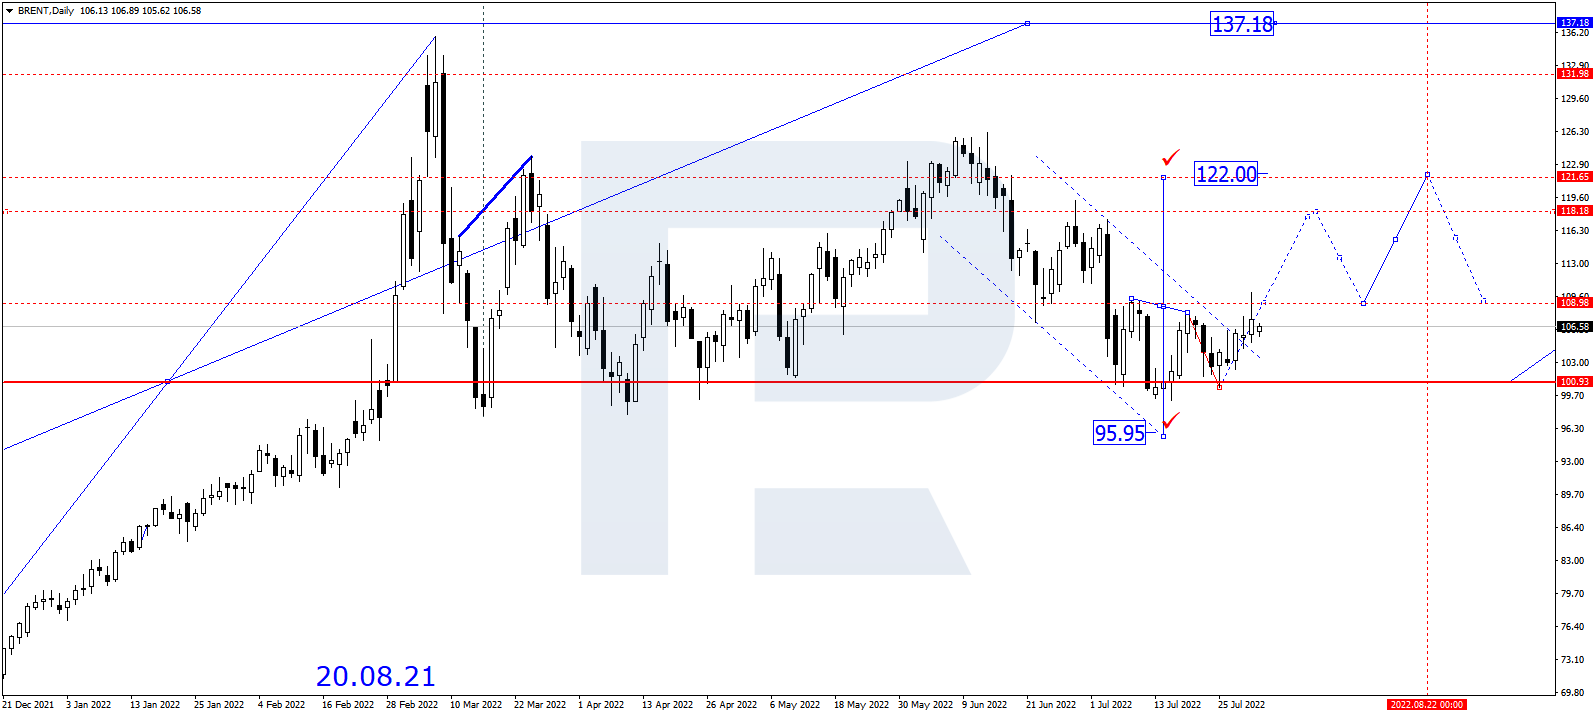
Oil decreased by almost 5% due to negative Chinese data. China is the world’s largest importer of crude oil, while the Canadian dollar is a commodity currency and depends on oil prices. Falling oil prices are weakening the Canadian dollar. It also should be noted that the Central Banks of the US and Canada keep their interest rates at the same level (2.5%), so there is no significant imbalance in this currency pair to form a long-term trend. At the same time, employment growth in Canada could affect the USD/CAD exchange rate as the Bank of Canada (BoC) wants to accelerate the path to higher interest rates. An improvement in the labor market could lead to a more aggressive rate hike.
- Support levels: 1.2786
- Resistance levels: 1.2880, 1.2923, 1.3006, 1.3085, 1.3154
In terms of technical analysis, the USD/CAD currency pair trend is bearish. At the moment, the price is forming a wide balance. The MACD indicator is in the negative zone, but there is a divergence, which indicates that it is harder for the price to move lower. Under such market conditions, it is better to consider sell deals from the resistance level of 1.2880, but with confirmation. Buy trades should be considered on the lower time frames from the support level of 1.2786 or from the lower border of the channel, but only with confirmation and short targets.
Alternative scenario: if the price breaks out and consolidates above the 1.3006 resistance level, the uptrend will likely resume.

By JustForex
This article reflects a personal opinion and should not be interpreted as an investment advice, and/or offer, and/or a persistent request for carrying out financial transactions, and/or a guarantee, and/or a forecast of future events.