
Article By RoboForex.com
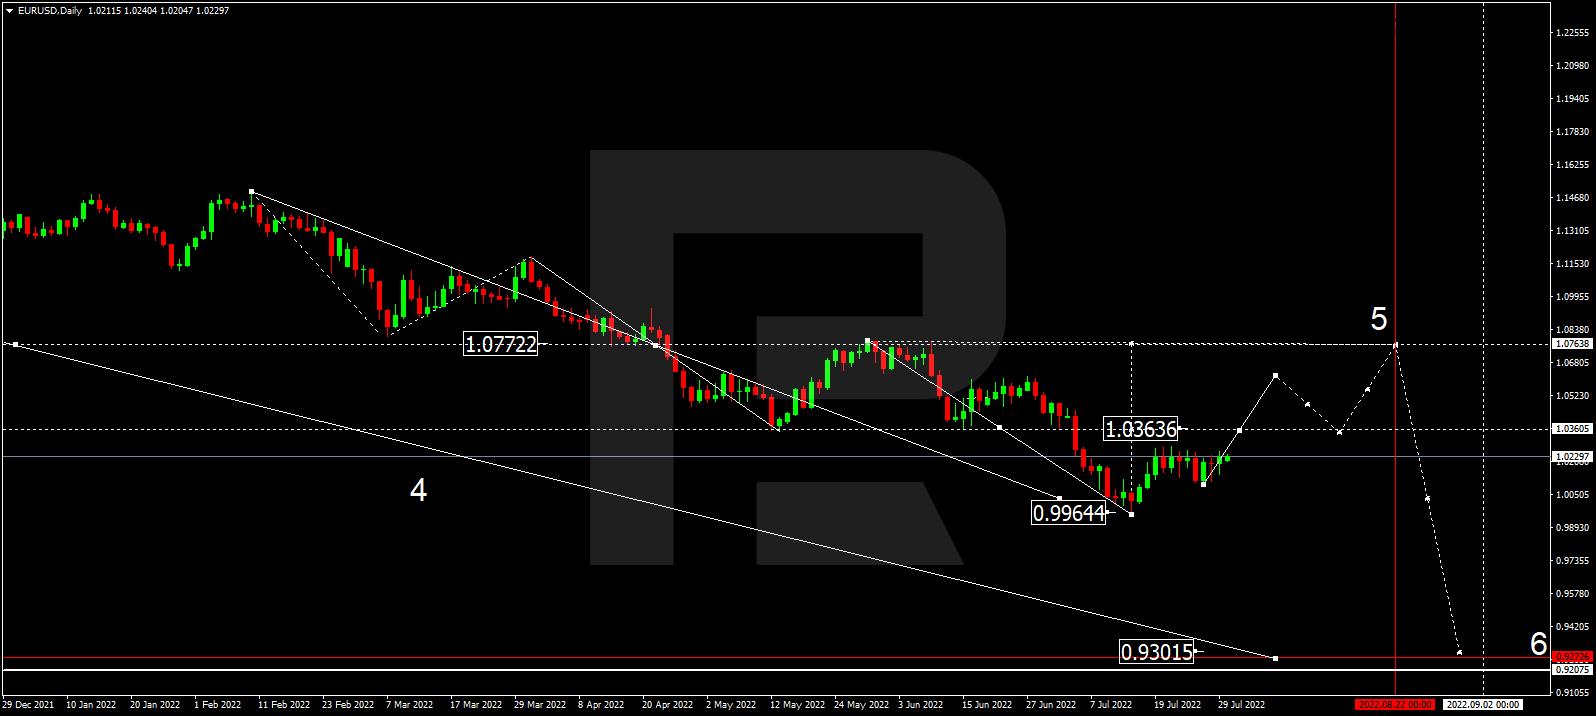
EURUSD, “Euro vs US Dollar”
As we can see in the daily chart, after reaching the short-term downside target at 0.9964, EURUSD has completed the ascending impulse along with the correction; right now, it is forming one more ascending structure towards 1.0360 and may later consolidate there. If the price breaks the range to the upside, the market may start another growth with the short-term target at 1.0616 or even extend this correctional wave up to 1.0764. After that, the instrument may resume trading within the downtrend to reach 0.9300.

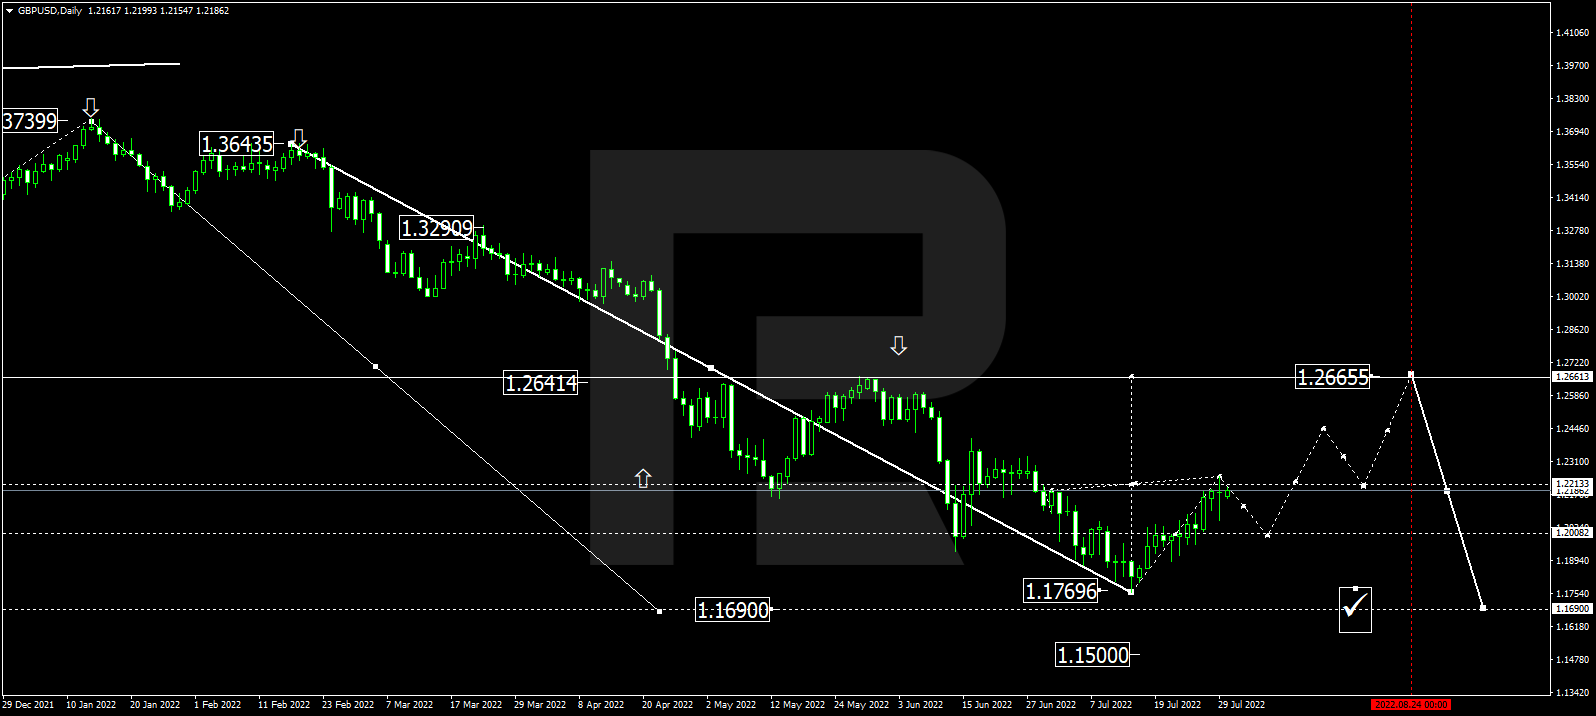
GBPUSD, “Great Britain Pound vs US Dollar”
On the daily chart, GBPUSD has finished the ascending impulse at 1.2222. Possibly, the pair may correct down to 1.2000 and then resume growing with the short-term target at 1.2444. The entire ascending structure is considered a correction of the previous decline towards 1.2665. After the correction is over, the instrument may start a new decline with the target at 1.1690, or even extend this wave down to 1.1500.
Free Reports:
 Get our Weekly Commitment of Traders Reports - See where the biggest traders (Hedge Funds and Commercial Hedgers) are positioned in the futures markets on a weekly basis.
 Download Our Metatrader 4 Indicators – Put Our Free MetaTrader 4 Custom Indicators on your charts when you join our Weekly Newsletter
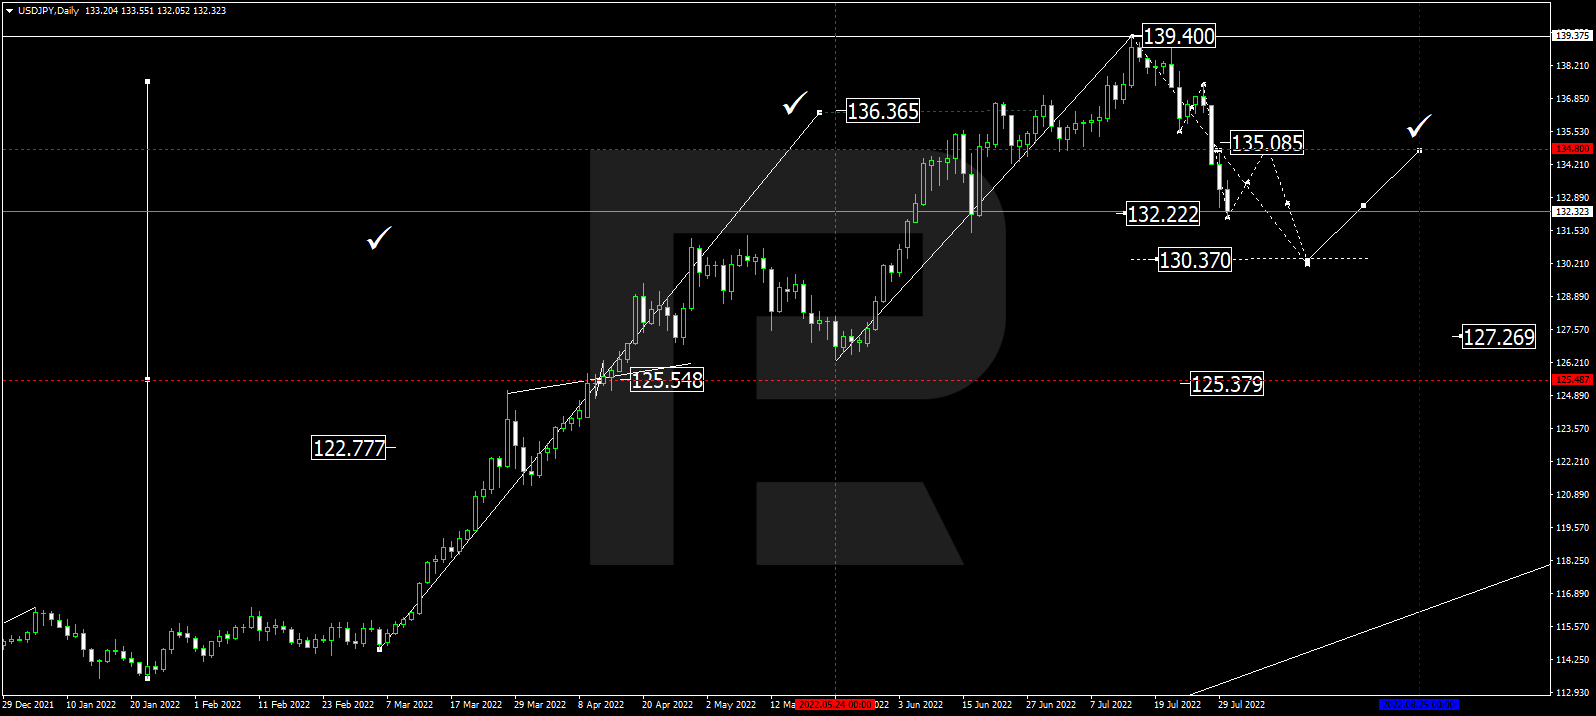
USDJPY, “US Dollar vs Japanese Yen”
On the daily chart, having completed the descending wave at 132.22, USDJPY is expected to grow and test 135.08 from below. Later, the market may resume falling with the first target at 130.37 and then start another correction up to 135.10.
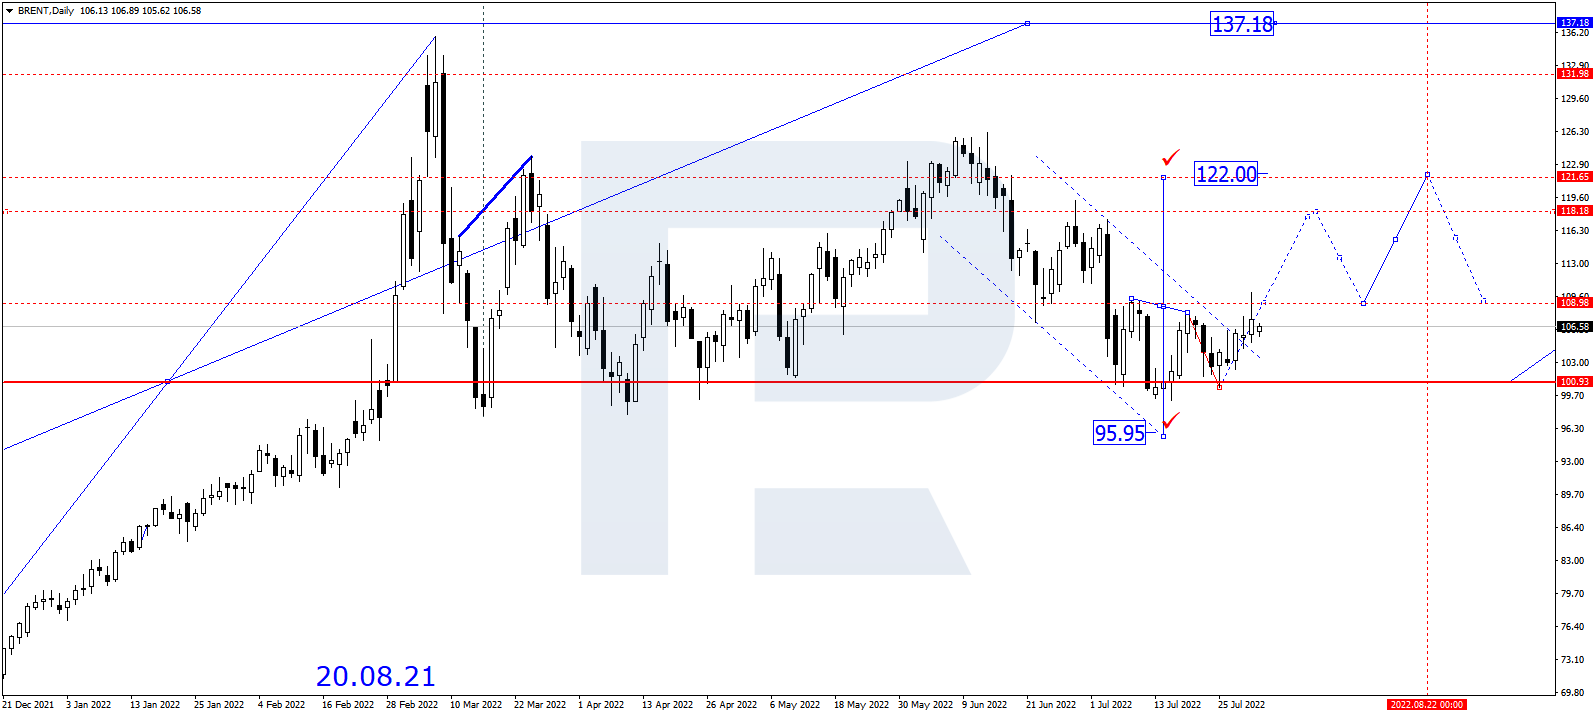
BRENT
As we can see in the daily chart, after finishing the first ascending impulse at 108.00 along with the correction down to 100.00, Brent is expected to form the third ascending wave towards 118.18. Later, the market may correct to test 108.00 from above and then continue growing with the first target at 122.00.
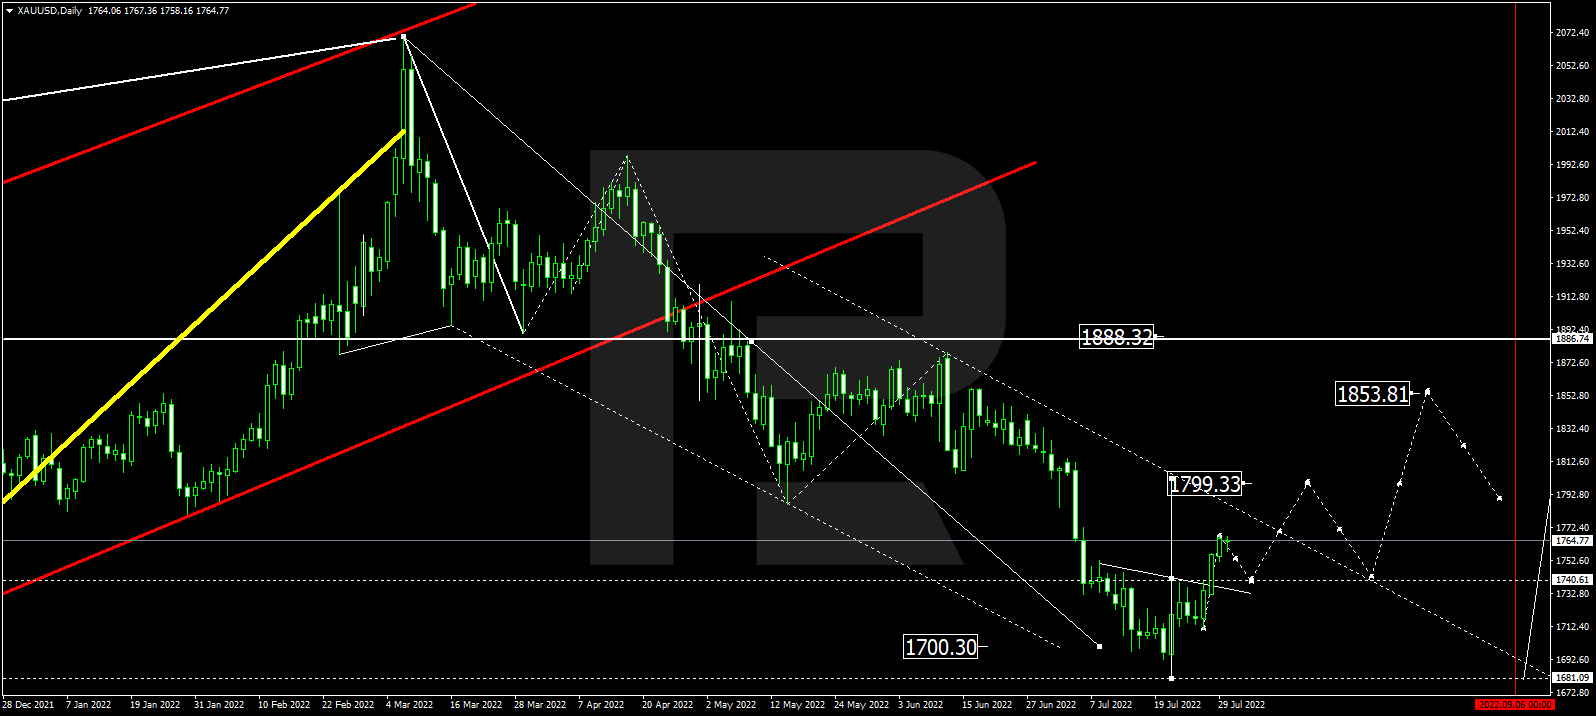
XAUUSD, “Gold vs US Dollar”
On the daily chart, having completed the first ascending impulse along with the correction, Gold is forming one more ascending wave with the first target at 1799.33. After that, the instrument may correct down to 1740.00, and then resume growing to reach 1855.00, or even extend this structure up to 1888.30.
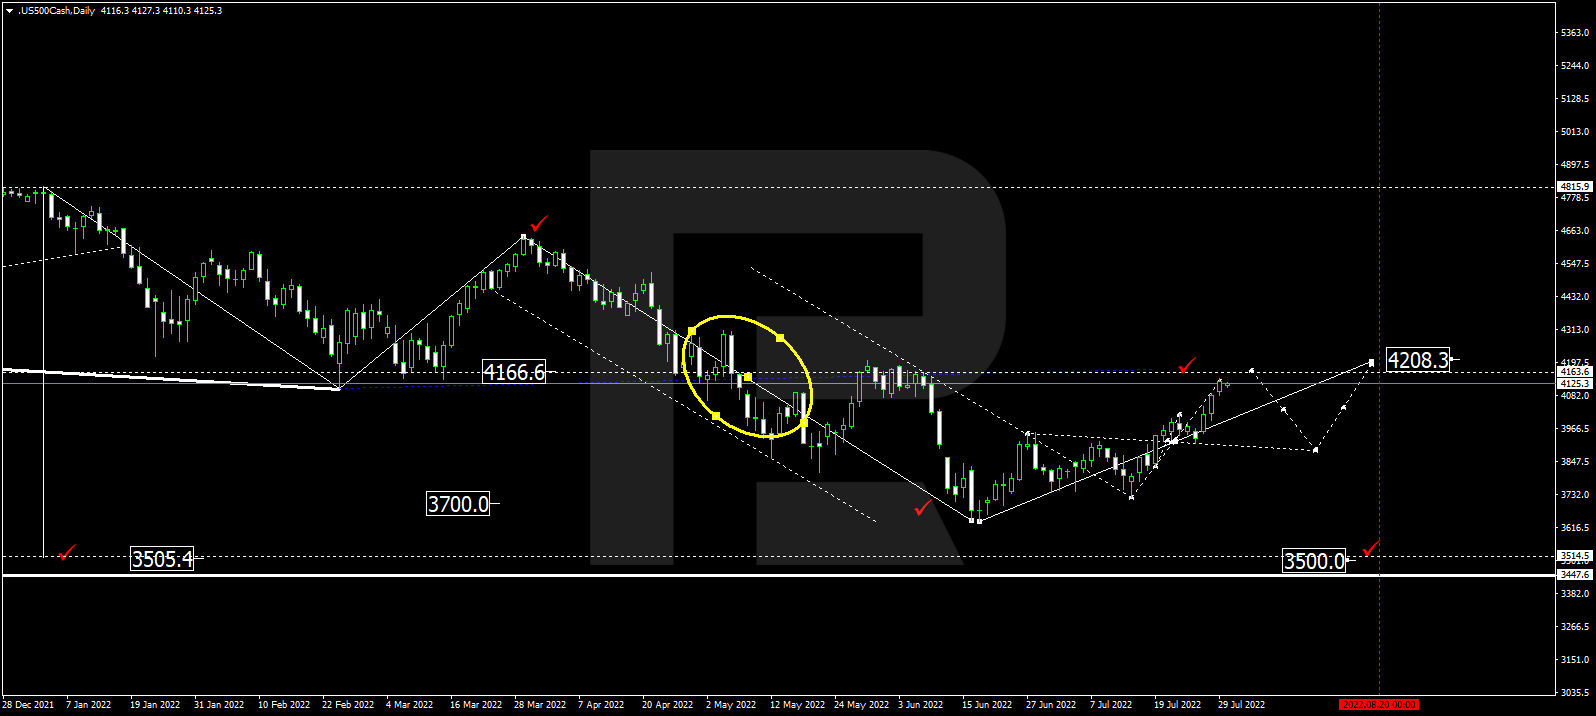
S&P 500
On the daily chart, the S&P index is still correcting up 4163.6 and may later start a new decline towards 3900.0. After that, the instrument may complete this ascending wave by reaching 4208.0, and then resume trading downwards with the target at 3500.0.
Article By RoboForex.com
Attention!
Forecasts presented in this section only reflect the author’s private opinion and should not be considered as guidance for trading. RoboForex LP bears no responsibility for trading results based on trading recommendations described in these analytical reviews.

- Geopolitical and macroeconomic conditions continue to pressure market sentiment Jul 20, 2026
- USD/JPY Poised to Continue Gains as Expensive Oil and Lack of Support Weigh on Yen Jul 20, 2026
- COT Metals Charts: Weekly Speculator Bets led by Copper & Steel Jul 18, 2026
- COT Bonds Charts: Weekly Speculator Bets led by 2-Year, SOFR 3M & 5-Year Bonds Jul 18, 2026
- COT Energy Charts: Weekly Speculator Bets led by Brent Oil & Heating Oil Jul 18, 2026
- COT Soft Commodities Charts: Weekly Speculator Bets led by Wheat, Corn & Soybean Meal Jul 18, 2026
- The Bank of Canada kept its interest rate unchanged. Platinum prices reached a three‑week high Jul 16, 2026
- Stock indices rose after the release of US inflation data. China’s GDP slowed sharply Jul 15, 2026
- GBP/USD Awaits Political News: What Will Happen Next Jul 15, 2026
- USD/JPY Holds at Highs: Pressure Lingers on Yen Jul 14, 2026