– Earlier this month, I updated on the crypto market with a title, ‘It Ain’t Over Yet”. I considered the recent strength in the main cryptocurrencies a “dead-cat bounce” within a classic sideways consolidation with a high probability of resuming collapse.
This time, I spotted new signals as the chart moves to the right building new bars over time. Let us start with the main coin in the weekly chart below.
Source: TradingView
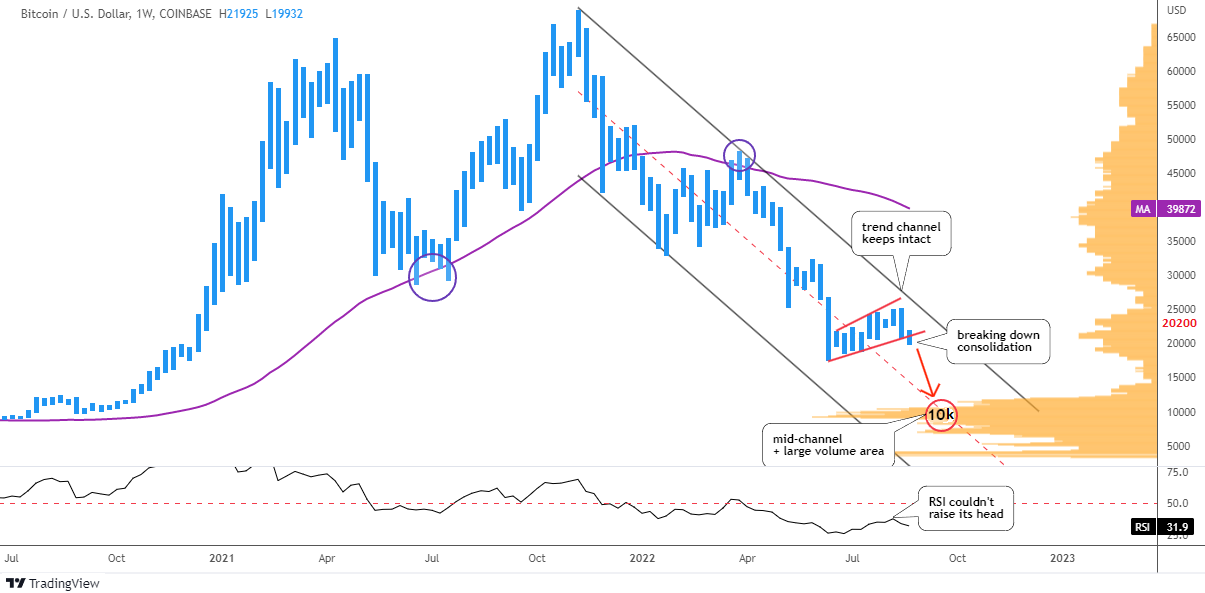
The price of Bitcoin moves within large bearish trend channel (black). The top of above-mentioned sideways consolidation within red trendlines did not even approach the resistance, it stays intact.
The RSI indicator could not raise its head to test the “waterline” of 50 level. This means that the market has considered this short-term strength as a “dead-cat bounce” as well.
The chart bar of last week has punctured below the red support. This is a harbinger of another drop. The main coin indeed is looking into the abyss as the strong support appears only after the price halves down. The largest area of the Volume Profile histogram (orange) is located between $9k and $10k. The mid-channel (red dashed) fortifies that support with its intersection.
Your biggest bet last time was the drop of the Bitcoin down to $12.2k, where the second leg down is equal to the first one. It almost coincides with the above-mentioned double support. The next volume area is located at the $4k level and this option was your least favorite.
This time I added the simple moving average (purple) covering the preceding 52 weeks (1 year). It has been offering a strong support to the price starting from 2020. This year it has flipped to become a strong resistance after the price has dropped below it. The $40k level is the barrier to break to confirm the new bullish cycle.
A rather interesting situation has developed for the main coin. The price should either half down to find support or it should double up from this level to crack the bearish cycle.
Now, let us check the Ethereum chart.
Source: TradingView
In spite of all the hype around the upcoming transition of Ethereum onto the proof-of-stake (PoS) mechanism, the shadow of falling Bitcoin remains a backbreaking burden.
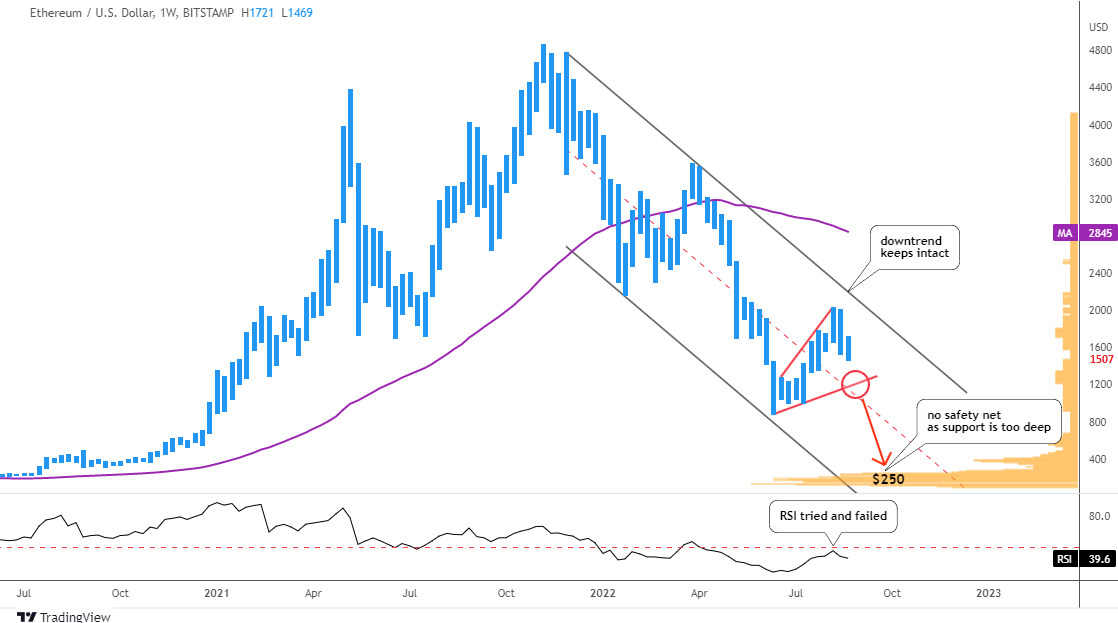
The black downtrend remains intact for the second largest coin also. There is a visible difference with the Bitcoin chart. The red mid-channel intersects with the red trendline support that contours consolidation.
Although the RSI was stronger here as it approached the barrier, it failed to break up and then dropped. Thus, the bearish mode continues.
Indeed, there is no safety net once the price slides below the red trendline support and the mid-channel until it touches the Volume Profile (orange) support of $250. It accords with the total annihilation modelposted in May. Most of you agreed with this doomed forecast earlier.
The simple moving average (purple) for the preceding year stands at $2,845. The price should almost double to touch this resistance. This is a similar situation with Bitcoin. However, the downside gap is worse for Ethereum.
The forecasted collapse should show us for sure if the RSI will establish a new valley or not building the Bullish Divergence. HODL-ers will watch this event closely.
Disclosure: This contributor has no positions in any stocks mentioned in this article. This article is the opinion of the contributor themselves. The above is a matter of opinion provided for general information purposes only and is not intended as investment advice. This contributor is not receiving compensation (other than from INO.com) for their opinion.
Russian forces occupy Europe’s largest nuclear power plant, the Zaporizhzhia Nuclear Power Station in the Ukrainian city of Enerhodar. Russian and Ukrainian forces are fighting nearby, and shelling has damaged power and communication lines to the plant, prompting fears for the plant’s safety and evoking painful memories in a country still scarred by the world’s worst nuclear accident, at Chernobyl in 1986.
In addition, Russian authorities have developed plans to disconnect the plant from Ukraine’s power grid – in the event of damage to the plant, according to the Russians, as a prelude to switching the plant to the grid in Russian-occupied territory, according to the Ukrainians. Disconnecting the plant from the grid is a risky operation.
The Conversation asked Najmedin Meshkati, a professor and nuclear safety expert at the University of Southern California, to explain the risks of warfare taking place in and around nuclear power plants.
How safe was the Zaporizhzhia power plant before the Russian attack?
The facility at Zaporizhzhia is the largest nuclear plant in Europe and one of the largest in the world. It has six pressurized water reactors, which use water to both sustain the fission reaction and cool the reactor. These differ from the RBMK reactors at Chernobyl, which used graphite instead of water to sustain the fission reaction. RBMK reactors are not seen as very safe, and there are only eight remaining in use in the world, all in Russia.
The reactors at Zaporizhzhia are of moderately good design, and the plant has a decent safety record, with a good operating background.
The Zaporizhzhia nuclear power plant uses pressurized water reactors.
Ukrainian authorities tried to keep the war away from the site by asking Russia to observe a 30-kilometer (nearly 19-mile) safety buffer. But Russian troops surrounded the facility and seized it in March.
What are the risks to a nuclear plant in a conflict zone?
Nuclear power plants are built for peacetime operations, not wars.
The worst thing that could happen is if a site is deliberately or accidentally shelled. If a shell hit the plant’s spent fuel pool – which contains the still-radioactive spent fuel – or if fire spread to the spent fuel pool, it could release radiation. This spent fuel pool isn’t in the containment building, and as such is more vulnerable.
Containment buildings, which house nuclear reactors, are also not protected against deliberate shelling. They are built to withstand a minor internal explosion of, say, a pressurized water pipe. But they are not designed to withstand a huge explosion.
As to the reactors in the containment building, it depends on the weapons being used. The worst-case scenario is that a bunker-buster missile breaches the containment dome – consisting of a thick shell of reinforced concrete on top of the reactor – and explodes. That would badly damage the nuclear reactor and release radiation into the atmosphere, which would make it difficult to send in first responders to contain any resulting fire. It could be another Chernobyl.
What are the concerns going forward?
The safety problems I see are twofold:
1) Human error
The workers at the facility are working under incredible stress, reportedly at gunpoint. Stress increases the chance of error and poor performance.
There is a human element in running a nuclear power plant – operators are the first and last layers of defense for the facility and the public. They are the first people to detect any anomaly and to stop any incident. Or if there’s an accident, they will be the first to heroically try to contain it.
2) Power failure
The second problem is that the nuclear plant needs constant electricity, and that is harder to maintain in wartime.
Even if you shut down the reactors, the plant will need off-site power to run the huge cooling system to remove the residual heat in the reactor and bring it to what is called a cold shutdown. Water circulation is always needed to make sure the spent fuel doesn’t overheat.
Spent fuel pools also need constant water circulation to keep them cool, and they need cooling for several years before they can be put in dry casks. One of the problems in the 2011 Fukushima disaster in Japan was the emergency generators intended to replace lost off-site power got inundated with water and failed. In situations like that, you get “station blackout” – and that is one of the worst things that could happen. It means no electricity to run the cooling system.
In that circumstance, the spent fuel overheats and its zirconium cladding can create hydrogen bubbles. If you can’t vent these bubbles, they will explode, spreading radiation.
If there is a loss of outside power, operators will have to rely on emergency generators. But emergency generators are huge machines – finicky, unreliable gas guzzlers. And you still need cooling waters for the generators themselves.
My biggest worry is that Ukraine suffers from a sustained power grid failure. The likelihood of this increases during a conflict because power line pylons may come down under shelling, or gas power plants might get damaged and cease to operate. And though Ukrainian intelligence services claim that the Russians intend to stockpile diesel fuel to keep these emergency generators going, it is unlikely that Russian troops will have excess fuel given their need to fuel their own vehicles.
How else does a war affect the safety of nuclear plants?
One of the overarching concerns about the effects of war on nuclear plants is that war degrades safety culture, which is crucial in running a plant. I believe that safety culture is analogous to the human body’s immune system, which protects against pathogens and diseases. Safety culture is pervasive and has a widespread impact. “It can affect all elements in a system for good or ill,” according topsychologist James Reason.
The tragic situation at the Zaporizhzhia nuclear power plant violates every universally accepted tenet of healthy nuclear safety culture, especially the maintenance of an environment where personnel can raise safety concerns.
War adversely affects safety culture in a number of ways. Operators are stressed and fatigued and may be scared to death to speak out if something is going wrong. Then there is the maintenance of a plant, which may be compromised by lack of staff or unavailability of spare parts.
Governance, regulation and oversight – all crucial for the safe running of a nuclear industry – are also disrupted, as is local infrastructure, such as the capability of local firefighters. In war, everything is harder.
So what can be done to better protect Ukraine’s nuclear power plants?
I believe an optimal though not ideal solution is to bring the two operating reactors to a cold shutdown before any further loss of off-site power and risk of station blackout, store more fuel for emergency diesel generators at different locations at the plant site, and keep only a skeleton caretaker staff to look after the spent fuel pools.
Admittedly, this is only a stopgap measure. In parallel with the International Atomic Energy Agency’s effort under the leadership of its Director, General Rafael Mariano Grossi, I believe that the U.N. Security Council should immediately empower a special commission to mediate between the warring parties. It could be modeled after the United Nations Monitoring, Verification and Inspection Commission in 2000, and appoint a prominent, senior international statesman as its head.
I believe the person should be of the caliber and in the mold of the legendary former director general of the IAEA, Hans Blix of Sweden. Blix led the agency at the time of the Chernobyl accident in 1986 and commands respect in today’s Russia and Ukraine.
War, in my opinion, is the worst enemy of nuclear safety. This is an unprecedented and volatile situation. Only through active, pragmatic engineering and nuclear diplomacy can an amenable and lasting solution to this vexing problem be found.
This is an updated version of an article originally published on March 4, 2022.
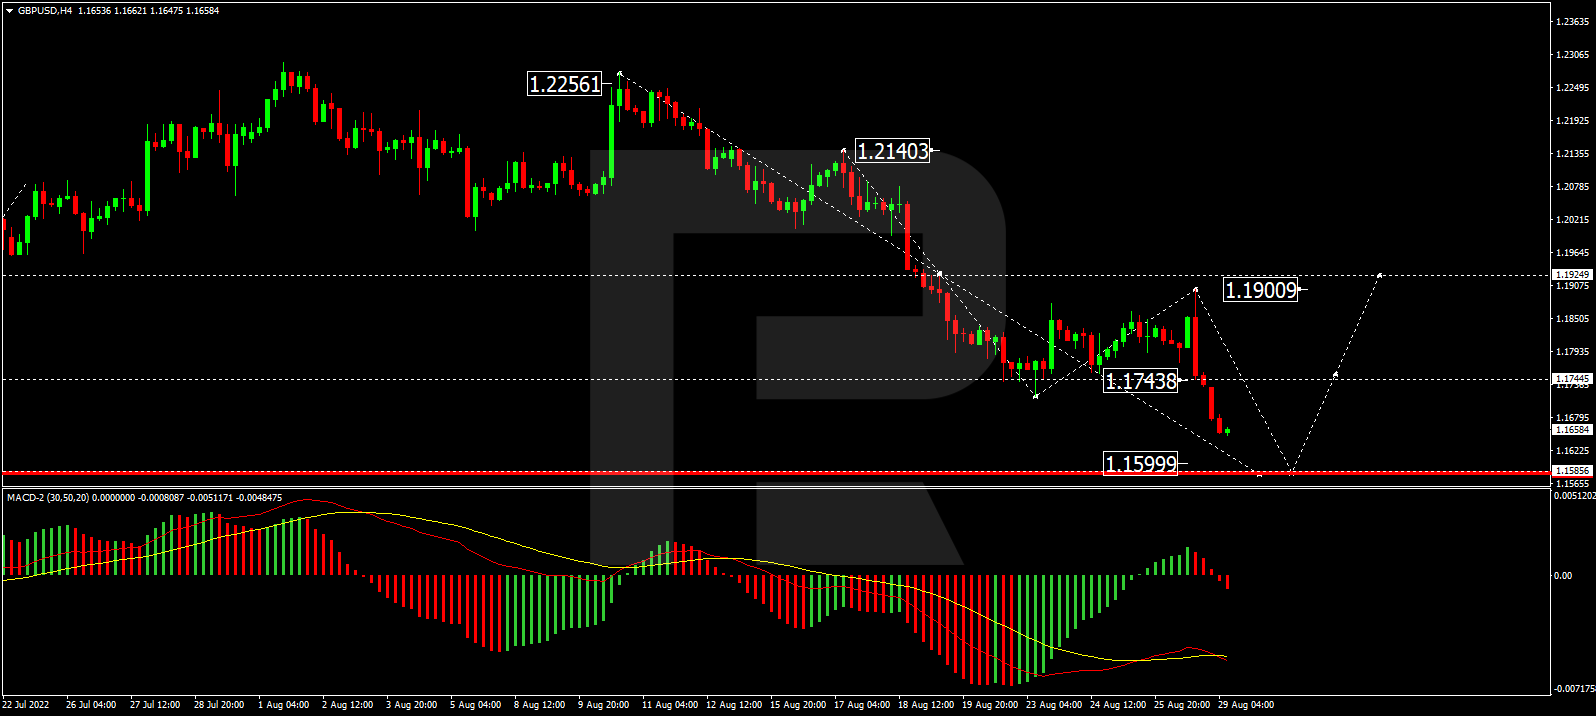
The Pound Sterling continues plummeting against the USD; by now, it has already dropped to 1.1660.
Apart from the strong USD factor, the Pound is being significantly pressured by domestic news. Britain’s energy regulator announced Friday that energy bills for households in the UK would rise by 80% in October. In response to that, the HM Treasury said that it was thoroughly working on developing new options to support households and defuse cost loading from energy price surges. However, all these words didn’t help the Pound at all.
The bearish pressure on the Pound is currently too strong to expect a quick and miraculous recovery.
Systematic issues inside the British economy might seriously escalate in the near future due to the energy crisis, making the national currency much cheaper.
As we can see in the H4 chart, having finished the correctional structure at 1.1900 and rebounded from this level, GBP/USD is forming a new descending structure towards 1.1600. Later, the market may start another correction to reach 1.1750 and then resume trading downwards with the target at 1.1550. From the technical point of view, this scenario is confirmed by the MACD Oscillator: its signal line is moving below 0 and may continue falling to reach new lows soon.
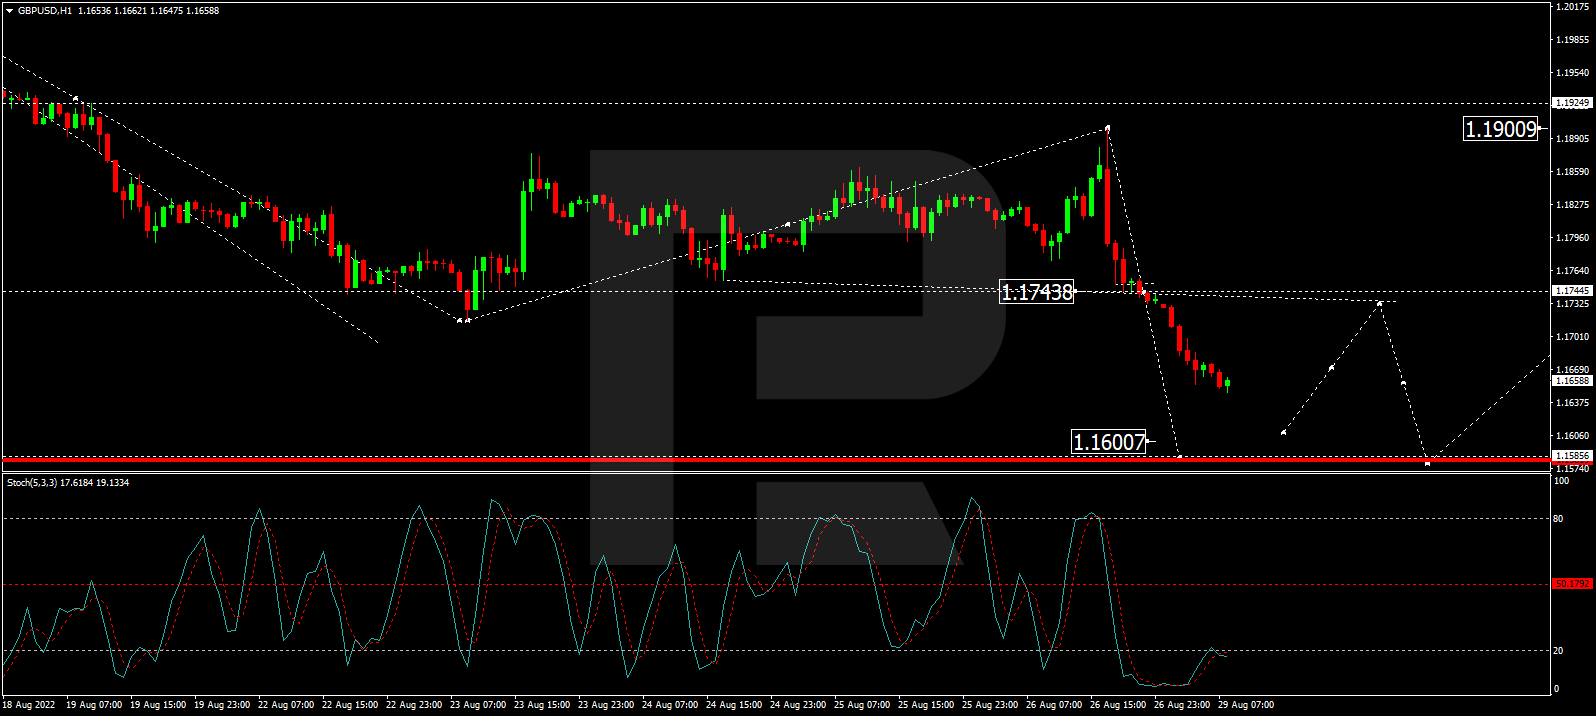
In the H1 chart, after completing the correction at 1.1900, breaking the correctional channel at 1.1744, and then forming a new consolidating range there, GBP/USD has broken it downwards and may continue falling towards 1.1600. Later, the market may correct to test 1.1744 from below and then resume trading downwards with the target at 1.1550. From the technical point of view, this scenario is confirmed by the Stochastic Oscillator: its signal line is moving below 20. In the future, it may grow to rebound from 50 and resume falling to return to 20.
Disclaimer
Any forecasts contained herein are based on the author’s particular opinion. This analysis may not be treated as trading advice. RoboForex bears no responsibility for trading results based on trading recommendations and reviews contained herein.
At the start of this new trading week, spot gold has been dragged down to closer to the $1700 mark, although prices have trimmed losses at the time of writing.
And depending on how this Friday’s US nonfarm payrolls report turns out, the precious metal could retest that psychologically-important level for support.
Why has gold tumbled again?
The precious metal is clearly wilting in the wake of the scorching US dollar and the uptrend in Treasury yields.
These moves (gold down, dollar/Treasury yields up) have been fuelled by revived bets that US interest rates will move higher, and more importantly – stay elevated, for longer.
Markets have been gripped by Fed Chair Jerome Powell’s hawkish speech delivered at Jackson Hole this past Friday.
Here are the key takeaways:
The Fed is set to persist with sending US interest rates higher.
US interest rates are set to stay higher “for some time” (as in, the Fed isn’t likely to unwind its rate hikes in a hurry, as some segments of the markets had predicted up until recently).
In essence, the US central bank remains committed to subduing in inflationary pressures, even if it results in some pain for the economy.
Such language heralds a stronger US dollar and Treasury yields marching higher: a bad mix for bullion bulls.
What does the upcoming US jobs report have to do with gold prices?
Depending on the demonstrated strength of the US jobs market, that would inform the Fed as to how high it could send US interest rates.
A still-resilient US labour market would essentially give the green light for the Fed to send its benchmark rates even higher. In turn, that should heap more downward pressure on gold.
Signs that the US labour market is starting to creak under the weight of higher interest rates may force the Fed to adopt a more gradual approach with its rate hikes; thus spelling some relief for gold.
What to look out for in this Friday’s US jobs report?
As things stand, markets are forecasting the following:
US labour market added a further 300,000 jobs in August, judging by the headline US nonfarm payrolls (NFP) figure. If so, that would mark a 20th consecutive month of job gains.
However, an official print of 300k would also mark its lowest number of jobs added since December 2019.
The August unemployment rate would stay at 3.5% – at its pre-pandemic lows.
Overall, the US jobs market is expected to remain resilient, even though the Fed has been hiking interest rates since March.
How might gold react to the upcoming NFP?
If the US labour market adds more jobs than forecasted, that could lead to more declines in gold prices.
Potential support levels:
$1712: using the downward trendline that has gone from resistance to support level.
$1700: stronger support should arrive at this psychologically-important line, noting that previous dips below $1700 have proved short-lived in recent years.
Such declines would be based on the notion that still-robust hiring in the US is likely to give the green light to the Fed to continue sending interest rates higher, which in turn should heap more downward pressure on gold prices.
However, if the US jobs market is starting to creak, that could force the Fed to adopt a more ‘gradual’ approach with its rate hikes.
That is to say policymakers may be more comfortable with triggering rate hikes that are relatively smaller than the 75bps hikes it has already triggered at each of its past two policy meetings. Smaller rate hikes may then be the way forward for policymakers, if they begin to fear choking the US jobs market and sending the US economy into a deep recession.
Such a narrative could then prompt a short-term rebound in spot gold.
Potential resistance levels:
$1764: around 50-day simple moving average (SMA)
$1800: stronger resistance set to arrive at psychologically-important mark
In summary:
Markets are currently forecasting a slightly higher chance (21.5%) of spot gold touching $1700, rather than prices reaching its 50-day SMA (20.8%) around $1764.
Ultimately, it could all come down to whether or not this Friday’s US nonfarm payrolls reports exceeds market expectations.
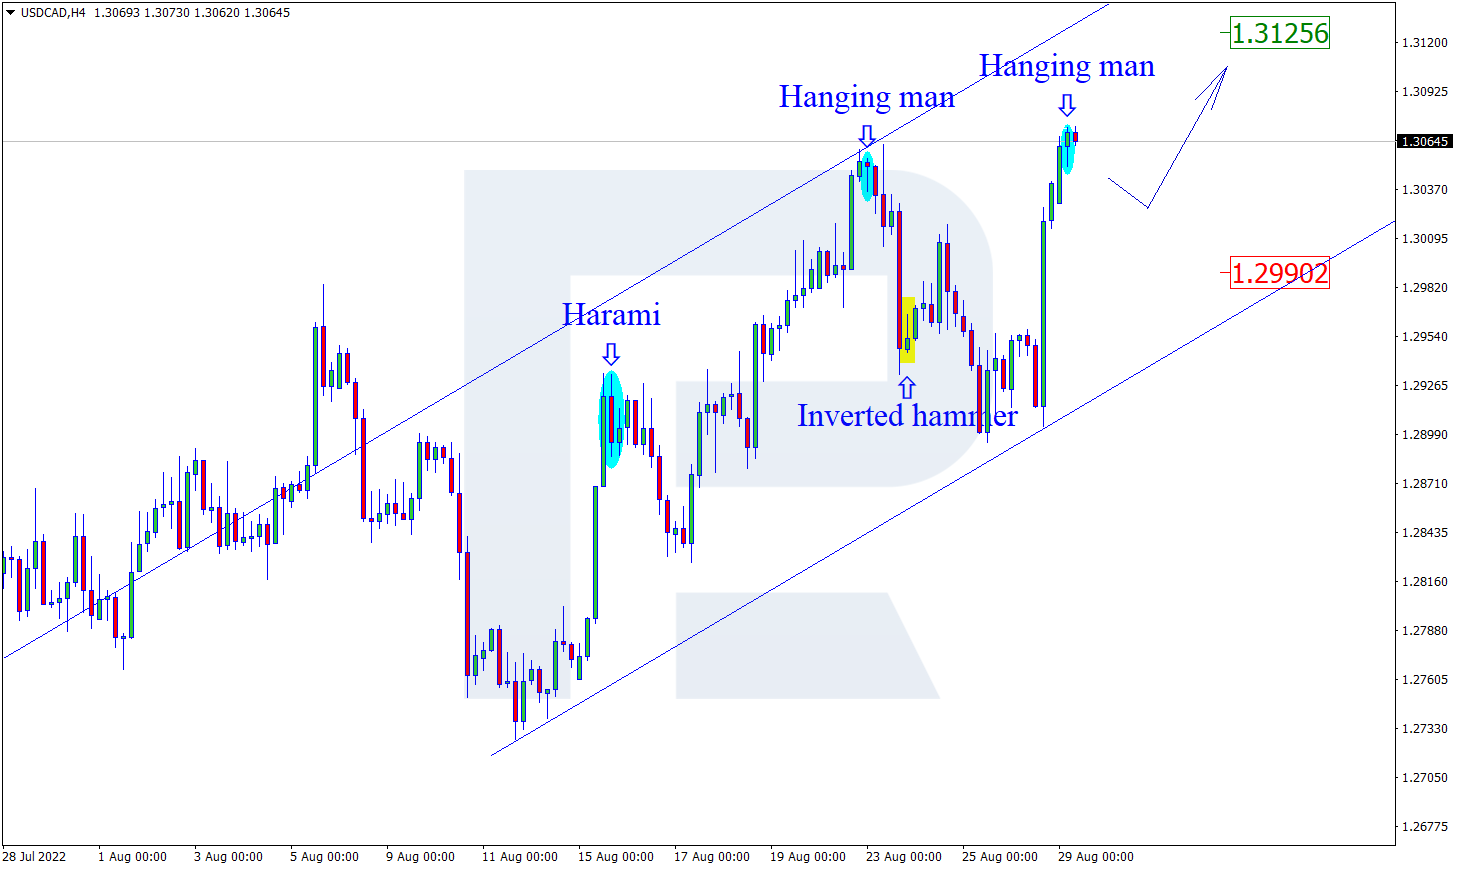
As we can see in the H4 chart, after forming a Hanging Man reversal pattern close to the resistance level, USDCAD may reverse in the form of a new descending impulse. In this case, the downside correctional target may be at 1.2990. Later, the market may rebound from this level and resume growing. However, an alternative scenario implies that the asset may continue growing to reach 1.3125 without any pullbacks down to the support area.
AUDUSD, “Australian Dollar vs US Dollar”
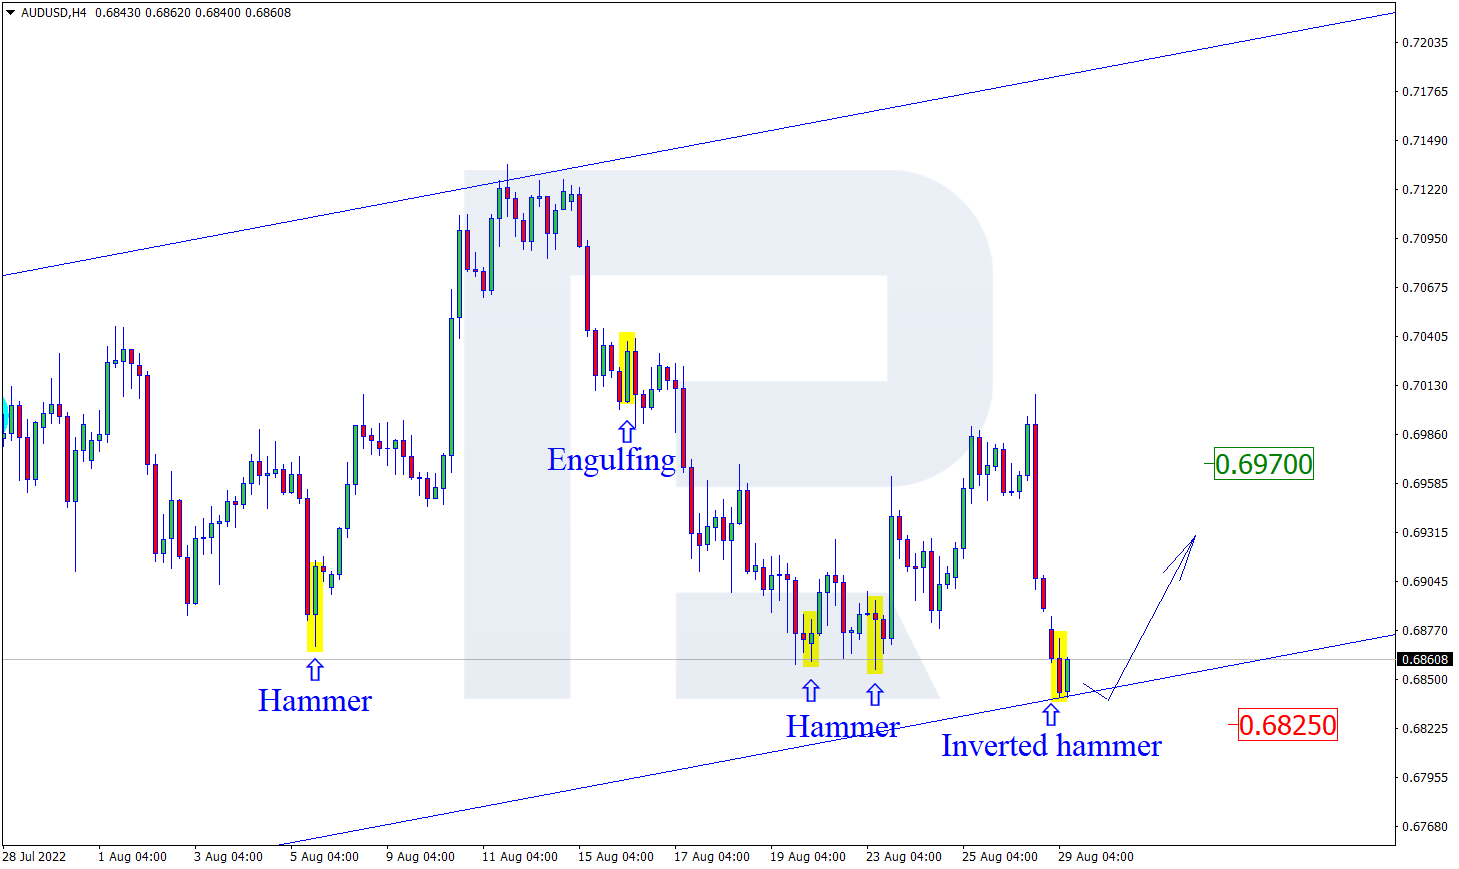
As we can see in the H4 chart, AUDUSD has formed an Inverted Hammer reversal pattern near the support area. At the moment, the asset is reversing in the form of a new rising impulse. In this case, the upside target may be the resistance level at 0.6970. After testing the level, the price may break it and continue the ascending tendency. At the same time, the opposite scenario implies that the price may correct to reach 0.6825 and continue the uptrend only after the pullback down to support area.
USDCHF, “US Dollar vs Swiss Franc”
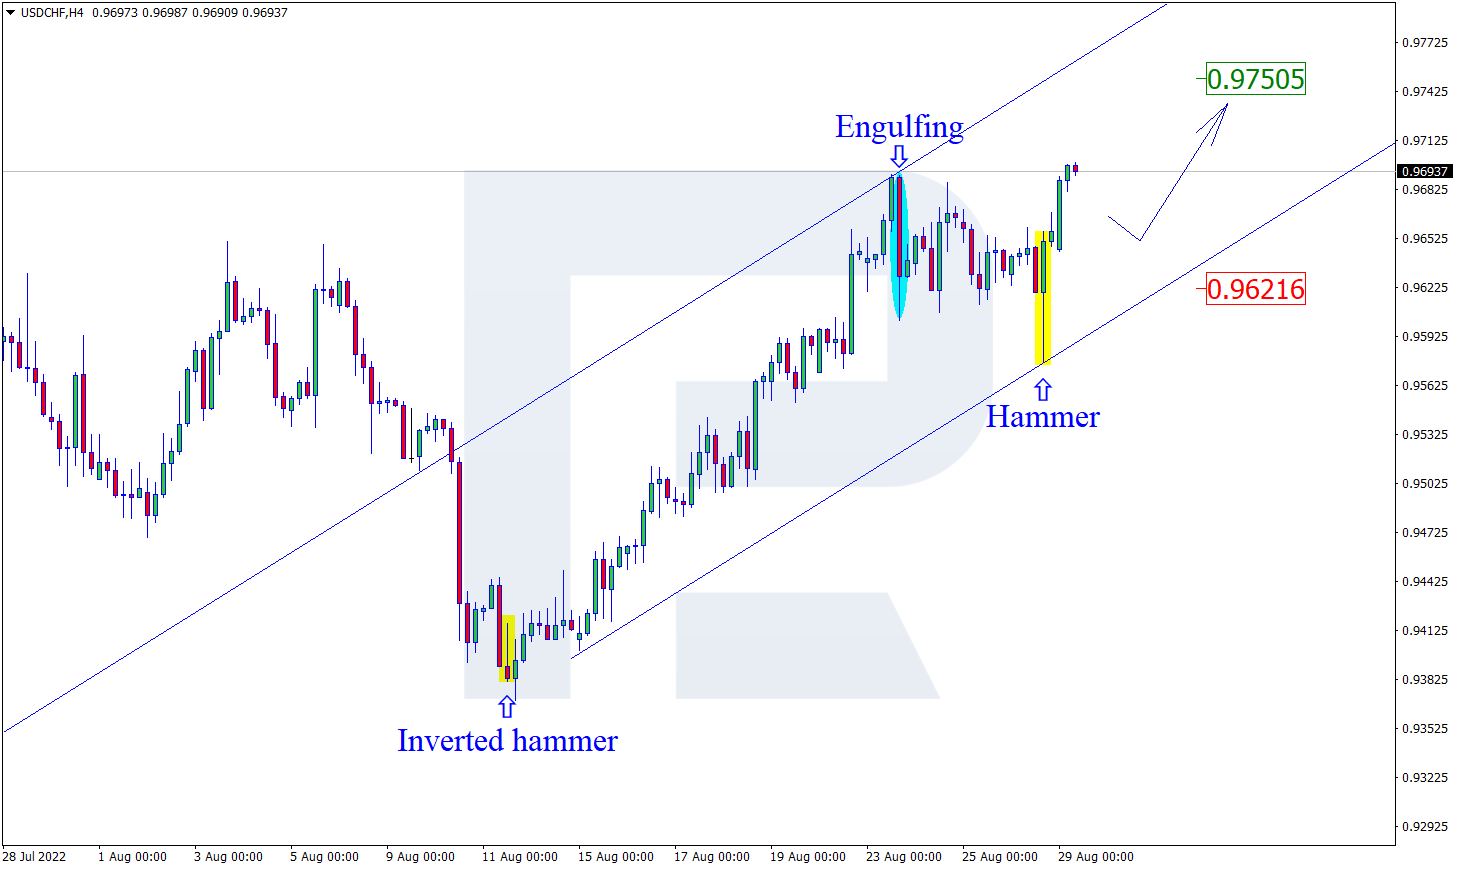
As we can see in the H4 chart, after testing the support area, the pair has formed a Hammer reversal pattern. At the moment, USDCHF may reverse in the form of a new ascending impulse. In this case, the upside target may be the resistance level at 0.9750. After testing this level, the price may break it and continue trading upwards. Still, there might be an alternative scenario, in which the asset may correct to reach 0.9621 and continue the ascending tendency only after the pullback.
Attention! Forecasts presented in this section only reflect the author’s private opinion and should not be considered as guidance for trading. RoboForex LP bears no responsibility for trading results based on trading recommendations described in these analytical reviews.
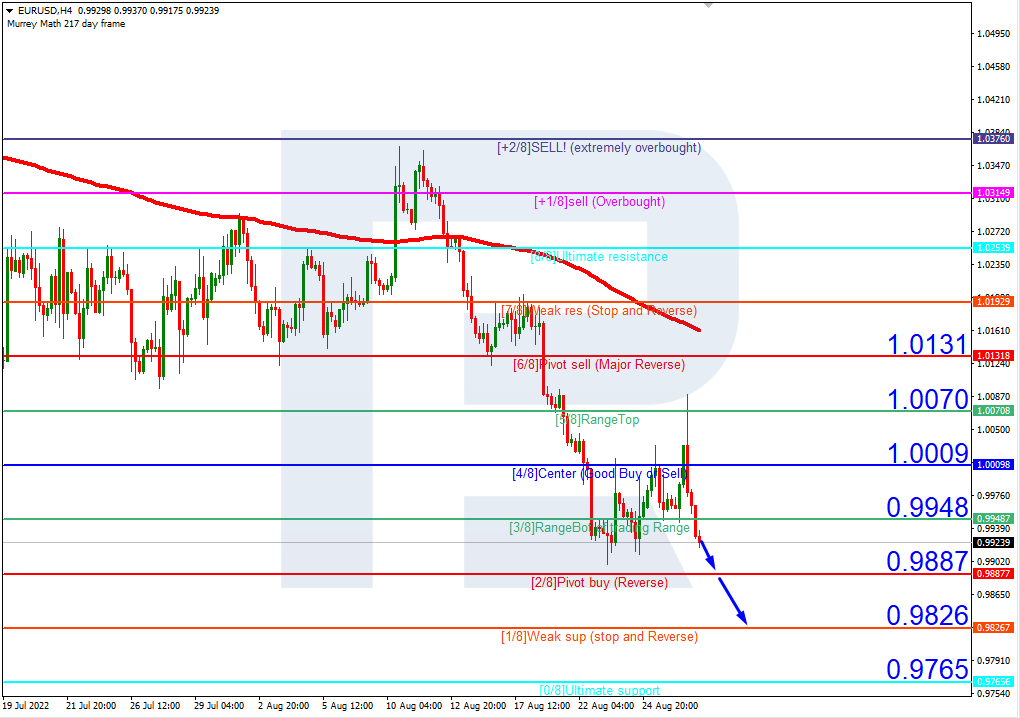
In the H4 chart, EURUSD is trading below the 200-day Moving Average to indicate a possible descending tendency. In this case, the price is expected to test 2/8, break it, and then continue falling to reach the support at 1/8. Still, this scenario may no longer be valid if the price breaks the resistance at 3/8 to the upside. After that, the instrument may reverse and grow towards 5/8.
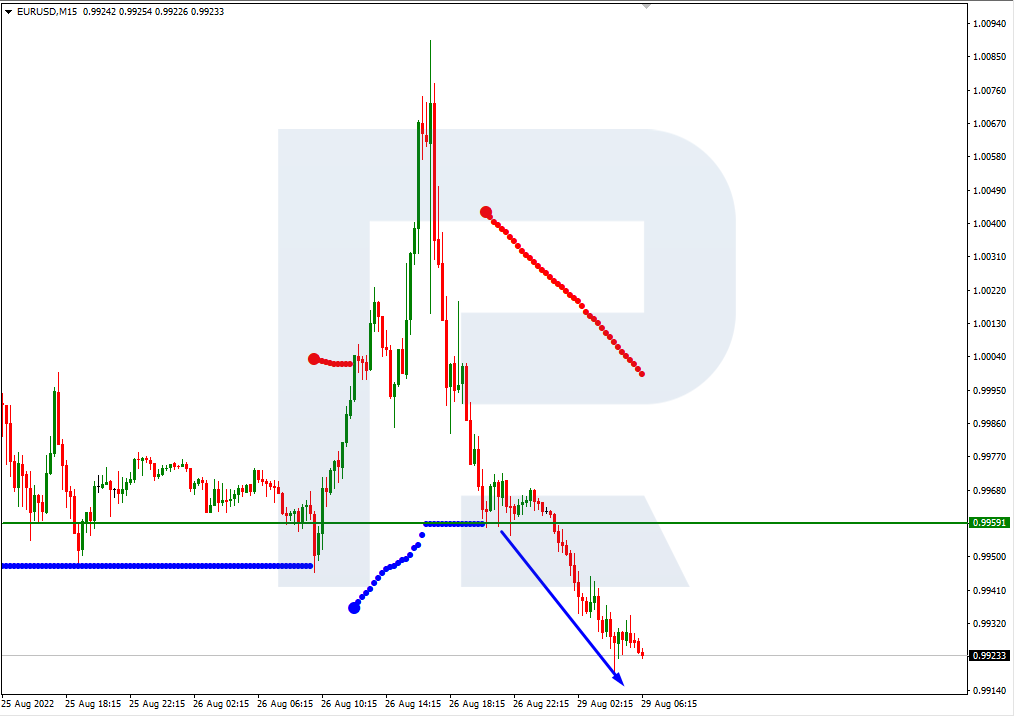
As we can see in the M15 chart, the pair has broken the downside line of the VoltyChannel indicator and, as a result, may continue its decline.
GBPUSD, “Great Britain Pound vs US Dollar”
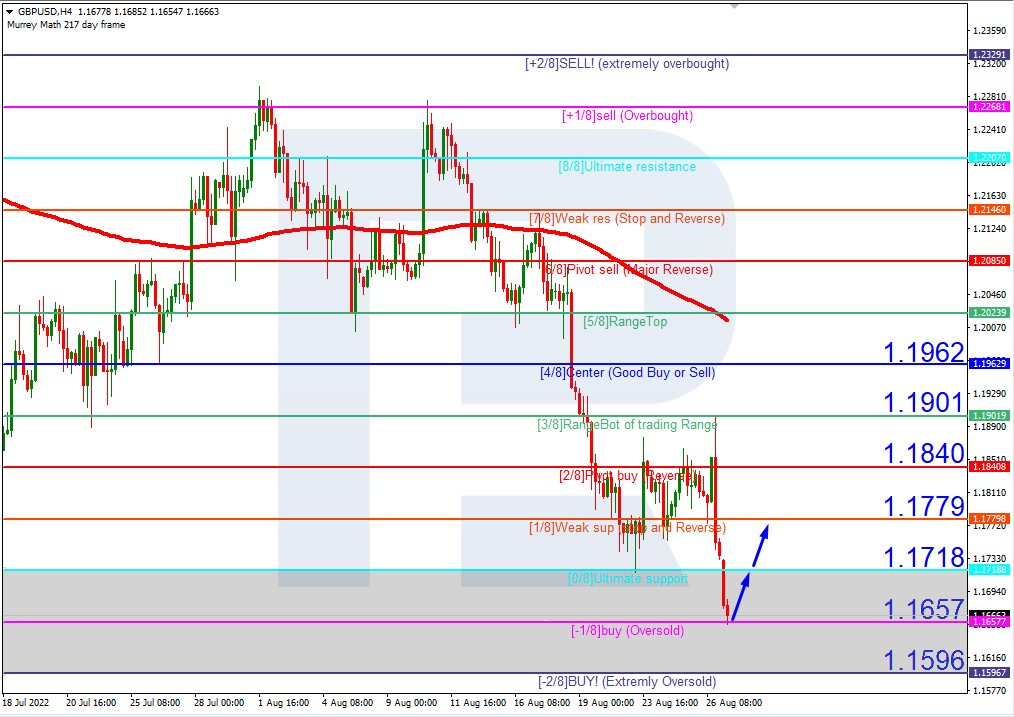
In the H4 chart, GBPUSD is moving inside the “oversold area”. In this case, the price is expected to rebound from -1/8 and resume growing to reach the resistance at 2/8. However, this scenario may no longer be valid if the price breaks -1/8 to the downside. After that, the instrument may continue falling towards the support at -2/8.
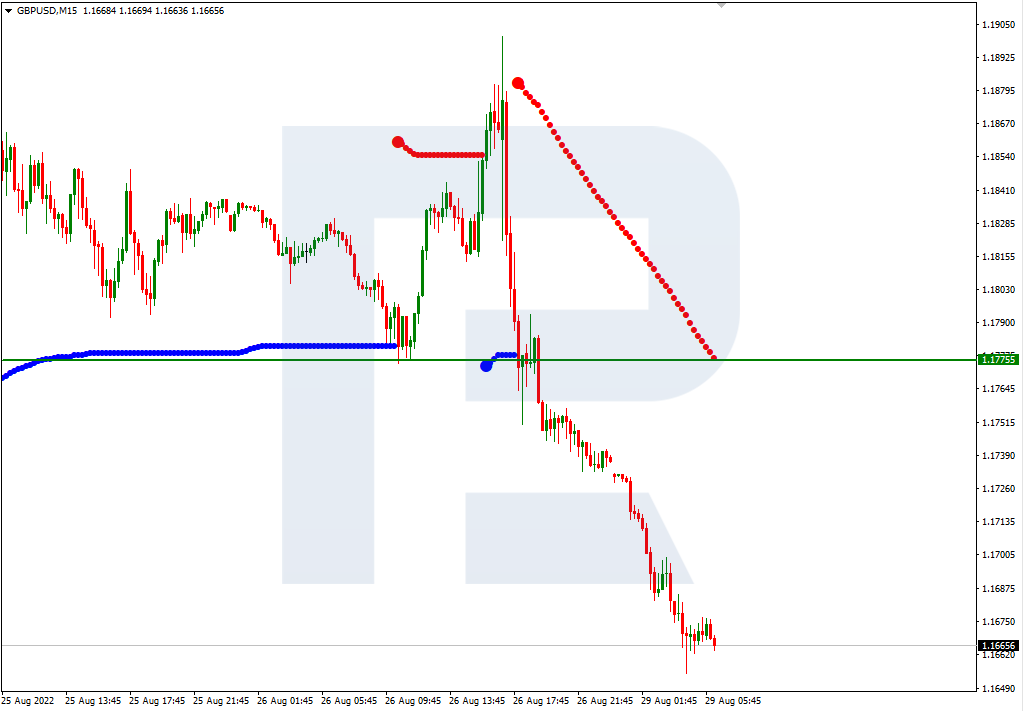
As we can see in the M15 chart, the upside line of the VoltyChannel indicator is pretty far away from the price, that’s why the pair may resume trading upwards only after rebounding from -1/8 in the H4 chart.
Attention! Forecasts presented in this section only reflect the author’s private opinion and should not be considered as guidance for trading. RoboForex LP bears no responsibility for trading results based on trading recommendations described in these analytical reviews.
A recession in the Eurozone is now very likely. Still, it alone will not lower inflation, and the European Central Bank should opt for a significant interest rate hike next month, ECB policymaker Martins Kazaks said on Saturday. The ECB raised rates by 50 basis points in July, and a similar move is scheduled for September 8, but some policymakers have begun talking about even more hikes as the outlook for inflation worsens. Mr. Kazacs also added that with zero rates now, the ECB is still supporting the economy, and by the first quarter of next year, the bank should reach a neutral level that does not slow or stimulate the economy.
From the technical point of view, the trend on the EUR/USD currency pair on the hourly time frame is bearish. The price is trading below the moving averages again. The MACD indicator has become negative. Under such market conditions, buy trades are best sought on intraday time frames from the support level of 0.9931, but with confirmation. Sell trades can be considered from resistance levels of 1.0032, but only after the additional confirmation.
Alternative scenario: if the price breaks out of the 1.0146 resistance level and fixes above, the uptrend will likely resume.
News feed for 2022.08.29:
– US FOMC Member Brainard Speaks at 21:15 (GMT+3).
The GBP/USD currency pair
Technical indicators of the currency pair:
Prev Open: 1.1833
Prev Close: 1.1737
% chg. over the last day: -0.82%
Amid talk that inflation will exceed 18% next year and families across the country are likely to face energy poverty this winter, Britain’s economic woes are worsening by the day. Analysts agree that the Bank of England will have no choice but to plunge the economy into a serious recession and cause massive job cuts to curb price pressures. Rising energy prices are fueling financial markets with higher inflation forecasts, leading traders to believe the Bank of England should be more aggressive. Money markets are now showing expectations of a 4.25% rise in the benchmark interest rate next year, the highest level since 2008.
From the technical point of view, the trend on the GBP/USD currency pair on the hourly time frame is bearish. The British pound is losing ground again and doing it faster than the euro. The MACD indicator has turned negative, and prices are below the moving levels again. At the moment, it is better to look for sell trades from the resistance level of 1.1838 or 1.1901, but only after the additional confirmation. Buy trades can be considered on intraday time frames from the support level of 1.1659, but only with confirmation and short targets.
Alternative scenario: if the price breaks out through the 1.1994 resistance level and fixes above, the uptrend will likely resume.
There is no news feed for today.
The USD/JPY currency pair
Technical indicators of the currency pair:
Prev Open: 136.48
Prev Close: 137.52
% chg. over the last day: +0.76%
According to analysts, wage growth in Japan will lag behind inflation for the next 12 months. And that’s bad news for the economy. And it is one of the reasons why the Bank of Japan should keep its massive monetary stimulus and dovish policy until wages show more clear signs of growth. Thus, the Japanese yen will be under the pressure of low rates at least till the end of the year, which will contribute to the further growth of USD/JPY quotes amid the tightening of the policy by the US Fed.
Trading recommendations
Support levels: 136.85, 135.89, 135.35, 134.23, 133.47, 132.27, 131.08, 130.85
Resistance levels: 138.55
From the technical point of view, the medium-term trend on the currency pair USD/JPY is bullish. The price is trading above the moving average lines again, and the buyers’ pressure is increasing. The MACD indicator has become positive. Under such market conditions, buy trades can be searched for from the support level of 136.85, but with additional confirmation. For sell deals, it is possible to consider the resistance level of 138.55, but only with additional confirmation, as fundamentally, USD/JPY quotes are inclined to grow.
Alternative scenario: If the price fixes below 135.35, the downtrend will likely resume.
There is no news feed for today.
The USD/CAD currency pair
Technical indicators of the currency pair:
Prev Open: 1.2927
Prev Close: 1.3027
% chg. over the last day: +0.77%
The US Energy Information Administration says oil and natural gas will remain the dominant energy sources through 2050. Although renewables will expand rapidly, 70% of the world’s energy in 2050 will still come from fossil fuels. Canada is the world’s fifth-largest producer and fourth-largest exporter of oil and natural gas. The future of Canada’s oil and gas sector is to produce them with the lowest possible greenhouse gas emissions. This takes advantage of the fact that G7 countries, including Canada and the European Union, classify natural gas as a transitional form of green energy. Thus, the Canadian dollar will be even more dependent on the dynamics of oil and natural gas prices. And that is the reason why rising energy prices, along with monetary tightening by the Bank of Canada, are keeping the Canadian dollar in line with the US dollar.
Trading recommendations
Support levels: 1.3036, 1.2965, 1.2943, 1.2900, 1.2858, 1.2809, 1.2761
Resistance levels: 1.3090, 1.3105
From the point of view of technical analysis, the trend on the USD/CAD currency pair is bullish. The price is currently trading at the resistance level, with buyer pressure temporarily prevailing. Under such market conditions, buy trades should be considered on the lower time frames from the support level of 1.3036, but only with confirmation. For sell deals, it is best to consider the resistance level of 1.3090, but only with short targets.
Alternative scenario: if the price breaks down and consolidates below the 1.2900 support level, the downtrend will likely resume.
This article reflects a personal opinion and should not be interpreted as an investment advice, and/or offer, and/or a persistent request for carrying out financial transactions, and/or a guarantee, and/or a forecast of future events.
Federal Reserve Chairman Jerome Powell signaled at a speech in Jackson Hole that the US Сentral Bank will likely continue to raise interest rates and leave them elevated for a while to suppress inflation, and rejected any idea that the Fed would change course soon. Powell added that lowering inflation to the 2% target is the Сentral Bank’s top priority right now, even though consumers and businesses will feel the economic pain. He reiterated that another unusually large increase in the benchmark lending rate might be appropriate when officials meet next month. Amid these statements, the US stock indices saw a sell-off on Friday. The Dow Jones (US30) decreased by 3.03% (-3.88% for the week). The S&P 500 (US500) fell by 3.37% (-3.28% for the week) at Friday’s close of the stock market. The NASDAQ Technology Index (US100) was down by 3.94% (-3.05% for the week).
Two-year Treasury yields rose on Powell’s statements to 3.44%. Mark Spindel, chief investment officer at MBB Capital Partners, said the strong tone of Powell’s speech points to another big 75 basis point rate hike next month.
In a new report on factors driving Canada’s provincial economies from 2022 to 2024, the nonprofit think tank says growth will come mainly from oil and gas. With regions like Saskatchewan and Alberta leading the way in that sector.
Equity markets in Europe fell mostly on Friday. German DAX (DE30) decreased by 2.26% (-3.71% for the week), French CAC 40 (FR40) lost 1.68% (-2.71% for the week), Spanish IBEX 35 (ES35) fell by 1.51% (-2.75% for the week), British FTSE 100 (UK100) was 0.70% down (-1.63% for the week).
Isabel Schnabel of the European Central Bank’s Executive Board urged policymakers to act decisively to bring stubbornly high inflation back under control and warned against backing down at the first sign that price pressures might be easing. Another ECB Governing Council spokesman, François Villrois de Galleau, said during the same discussion that policymakers must be determined to fight record inflation so as not to be forced to resort to “unnecessarily harsh” interest rate changes later on. The ECB raised rates by 50 basis points in July, and a similar move is scheduled for September 8, but some policymakers have begun talking about even more hikes as the outlook for inflation worsens.
The UK inflation hit a 40-year high of 10.1% year-over-year last month, and Citigroup Inc. said it could surpass 18% in January. According to consulting firm Baringa Partners, more than half of British households are at risk of energy poverty this winter because of soaring bills. In theory, higher rates should lead to a stronger currency. But the opposite is true for the UK right now. Investors believe that further aggressive increases in borrowing costs, necessary to reduce rising prices, will exacerbate Britain’s economic malaise, putting the country in a worse position than the US and the Eurozone.
The spot price of gas in Europe has once again hit a 5-month high. The price of the nearest TTF futures on the ICE Futures exchange reached $3456 per thousand cubic meters in September. The historical maximum for the gas price in Europe was recorded on March 7, 2022, when the April futures price was $3,898 at one point.
According to the Financial Times, EU foreign ministers are set to suspend the visa agreement with Russia as early as this week.
On Friday, OPEC+ states such as Iraq, Venezuela, and Kazakhstan expressed willingness as part of an alliance of 23 oil producers to step in and restore balance to the oil market. The word “balance” is OPEC+’s key phrase for production cuts, a situation OPEC+ considers necessary whenever oil prices are at risk of falling. But the problem with any OPEC+ production cut is that it will raise not only the price of oil but also the price of gasoline, which the Biden administration is trying hard to prevent. Thus the situation in the oil market remains uncertain. On top of that, Russia is selling its oil at a discount of $30 a barrel to Brent in order to keep its economy running under widespread sanctions and to get money for the war with Ukraine, with China and India being the main buyers of Russian oil.
Asian markets traded without a single dynamic last week. Japan’s Nikkei 225 (JP225) decreased by 0.04% over the week, Hong Kong’s Hang Seng (HK50) gained 3.05% last week, and Australia’s S&P/ASX 200 (AU200) ended the week down by 0.15%.
In China, the real estate market crisis has flared up, and sales have been falling there for several months. Because of this, developers are becoming cheaper to tear down the new building than to keep it. The authorities support the demolition by offsetting the costs. Already 2/3 of developers have gone bankrupt or are at the stage of bankruptcy. According to Citigroup, by cutting key rates in August, the People’s Bank of China (PBOC) may cut banks’ required reserves as early as next month.
In the commodities market, futures on coffee (+12.05%), wheat (+7.63%), corn (+6.23%), Brent oil (+4.01%), WTI oil (+2.8%), and sugar (+2.05%) showed the biggest gains over the week. Futures on gasoline (-5.57%), lumber (-4.85%), platinum (-4.05%), orange juice (-4.04%), and soybeans (-1.61%) showed the biggest drop.
S&P 500 (F) (US500) 4,057.66 −141.46 (−3.37%)
Dow Jones (US30) 32,283.40 −1,008.38 (−3.03%)
DAX (DE40) 12,971.47 −300.49 (−2.26%)
FTSE 100 (UK100) 7,427.31 −52.43 (−0.70%)
USD Index 108.84 +0.37 (+0.34%)
Important events for today:
– Australia Retail Sales (m/m) at 04:30 (GMT+3);
– US FOMC Member Brainard Speaks at 21:15 (GMT+3).
This article reflects a personal opinion and should not be interpreted as an investment advice, and/or offer, and/or a persistent request for carrying out financial transactions, and/or a guarantee, and/or a forecast of future events.
“Traders are convinced the market volatility will remain subdued”
By Elliott Wave International
When things get quiet in a horror movie, that’s when you need to really brace yourself. The monster or the killer will soon be on the scene.
That’s a close enough analogy to what can happen in the stock market. Just when investors get comfortable with a stretch of low volatility — wham! — volatility picks up in a major way.
Back on Nov. 27, 2019, our U.S. Short Term Update, a thrice weekly Elliott Wave International publication which provides near-term forecasts for major U.S. financial markets, showed a chart titled “Calm Before the Craziness,” and said:
The CBOE volatility Index (VIX) closed below 12.00 for the third straight session… In fact, investors are so complacent that, paradoxically, it signals a coming pick up in volatility.
About three months later, our Feb. 24, 2020 U.S. Short Term Update noted:
The VIX surged 69% intraday and is now up 130% since the November 26 low. The VIX should eventually move even higher as stocks prices work lower.
As you may recall, a hair-raising stock market decline that had started in mid-February continued to plummet into March 23 of that year.
What does this have to do with today?
This chart and commentary from our August 15, 2022 U.S. Short Term Update provides the answer:
We have inverted the scale to align the VIX with prices. The DSI Indicator (trade-futures.com) has declined to 15, the lowest reading since March 29 (DSI of 13), which coincided with [an Elliott wave high]. The VIX itself declined to 19.12 on August 12 and traders are convinced the market volatility will remain subdued. As shown by the vertical dashed lines, the prior two times that traders were equally confident that volatility will remain muted occurred at or near prior market highs.
Indeed, an August Yahoo Finance headline reflects an example of this confidence:
10 reasons to be bullish on stocks right now, according to [a strategist at the largest U.S. bank]
That strategist may turn out to be correct.
On the other hand, volatility has already picked up since our August 15 analysis published. Of course, during periods of high volatility, there’s the potential for big moves on the up- as well as downside.
Now it’s time to learn what the Elliott wave pattern of the stock market is suggesting.
If you’re new to Elliott wave analysis or need a refresher, you may want to read Elliott Wave Principle: Key to Market Behavior by Frost & Prechter. Here’s a quote from the book:
It is a thrilling experience to pinpoint a turn, and the Wave Principle is the only approach that can occasionally provide the opportunity to do so.
The ability to identify such junctures is remarkable enough, but the Wave Principle is the only method of analysis that also provides guidelines for forecasting.
You can read the entirety of this Wall Street classic for free once you become a member of Club EWI, the world’s largest Elliott wave educational community (about 500,000 worldwide members).
You can join Club EWI for free and members enjoy complimentary access to a wealth of Elliott wave resources on financial markets, investing and trading without any obligations.
This article was syndicated by Elliott Wave International and was originally published under the headline Why You Should Expect a Pickup in Stock-Market Volatility. EWI is the world’s largest market forecasting firm. Its staff of full-time analysts led by Chartered Market Technician Robert Prechter provides 24-hour-a-day market analysis to institutional and private investors around the world.
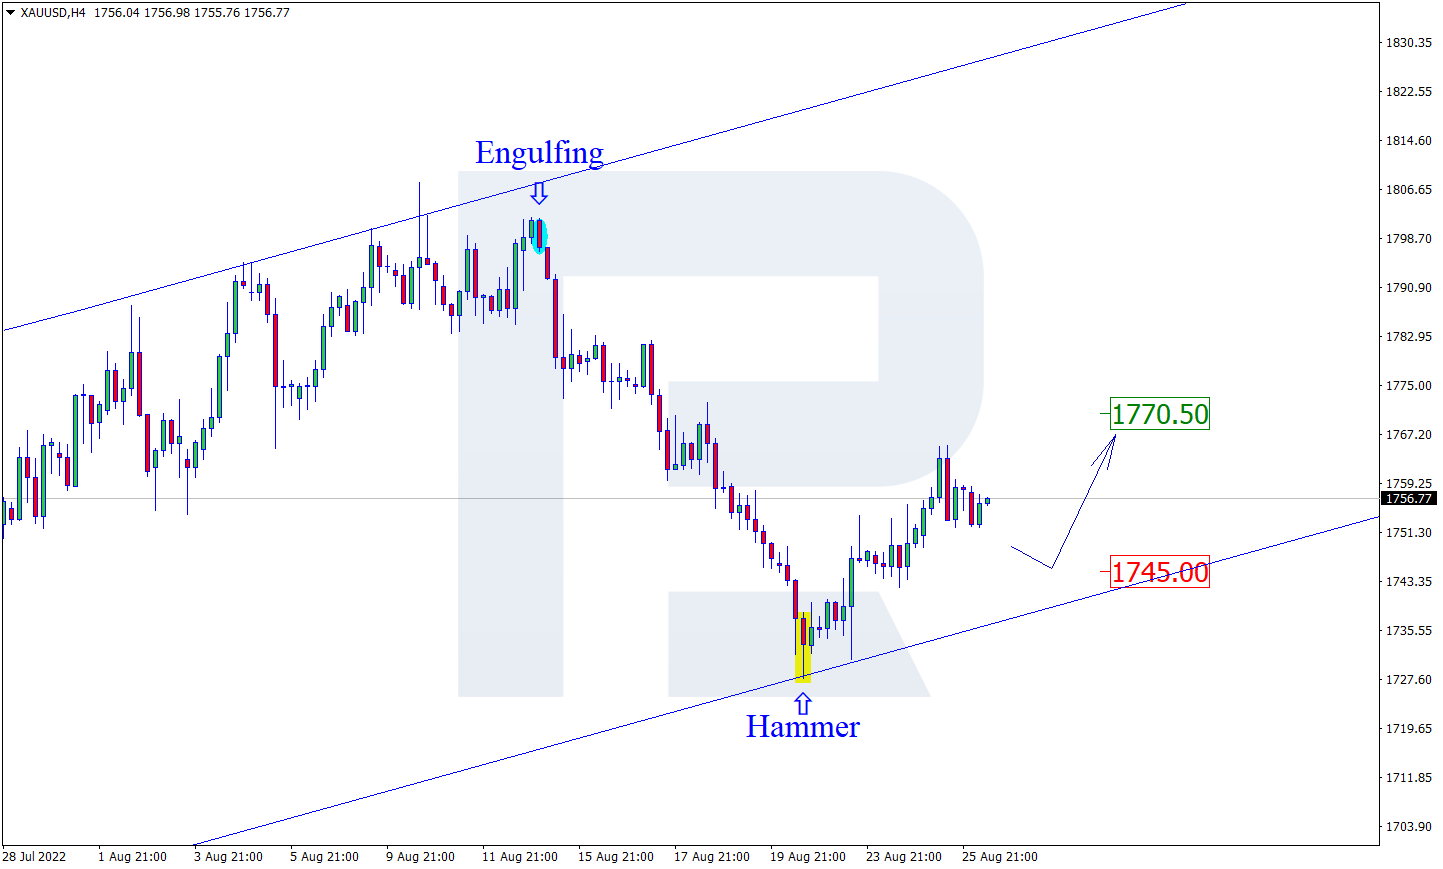
As we can see in the H4 chart, XAUUSD has formed a Hammer reversal pattern not far from the support area. At the moment, the asset may reverse in the form of a new ascending impulse. In this case, the upside target may be at 1770.50. At the same time, the opposite scenario implies that the price may correct to reach 1745.00 first and then resume trading upwards.
NZDUSD, “New Zealand vs US Dollar”
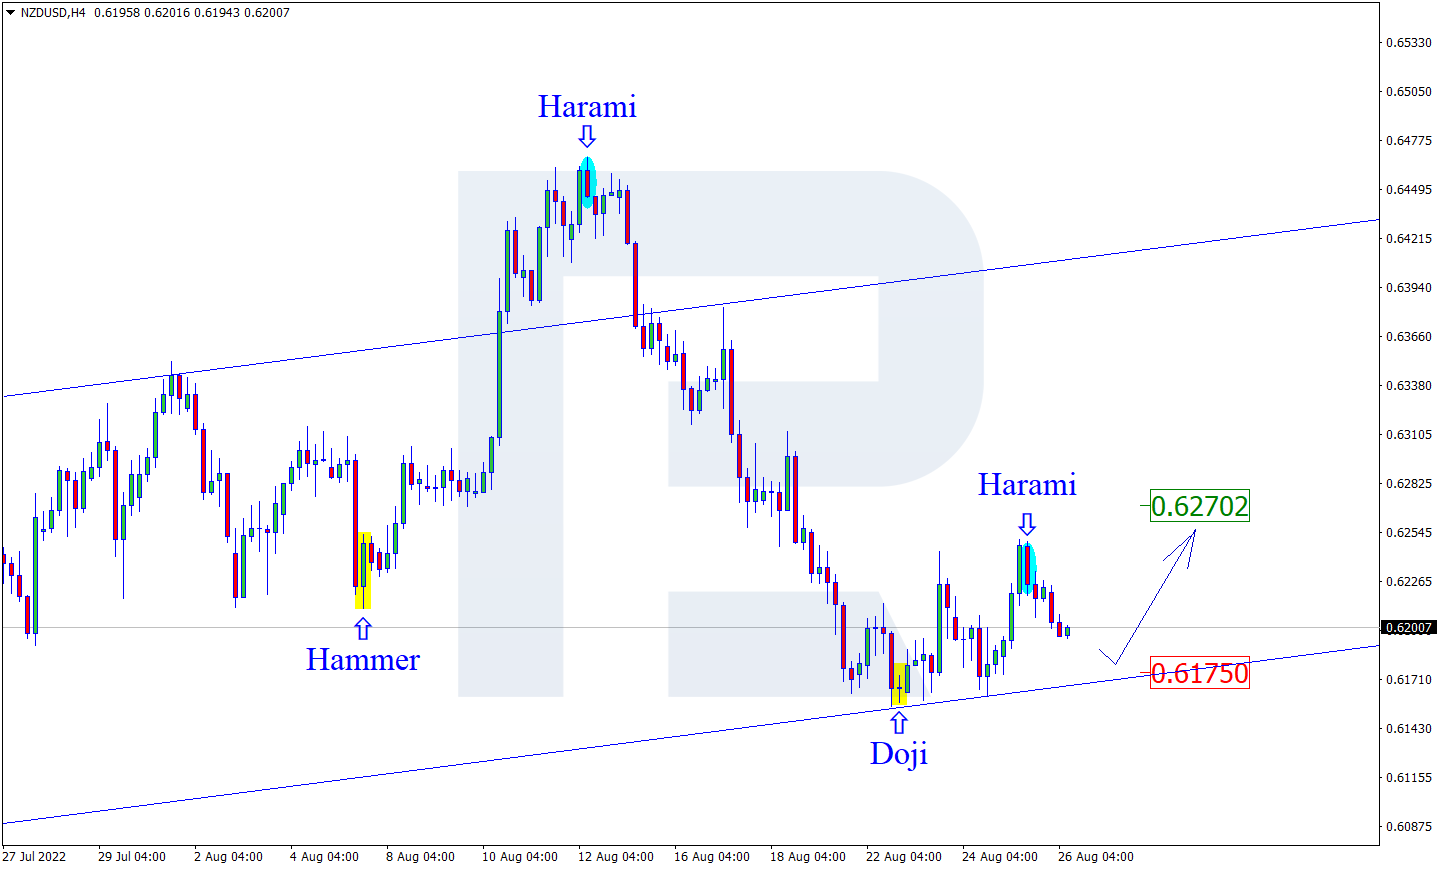
As we can see in the H4 chart, during the pullback, NZDUSD has formed a Harami reversal pattern close to the resistance area. At the moment, the asset is reversing in the form of another descending impulse. In this case, the downside correctional target may be at 0.6175. After that, the asset may rebound from the support level and resume moving upwards. However, an alternative scenario implies that the price may grow to reach 0.6270 without testing the support level.
GBPUSD, “Great Britain Pound vs US Dollar”
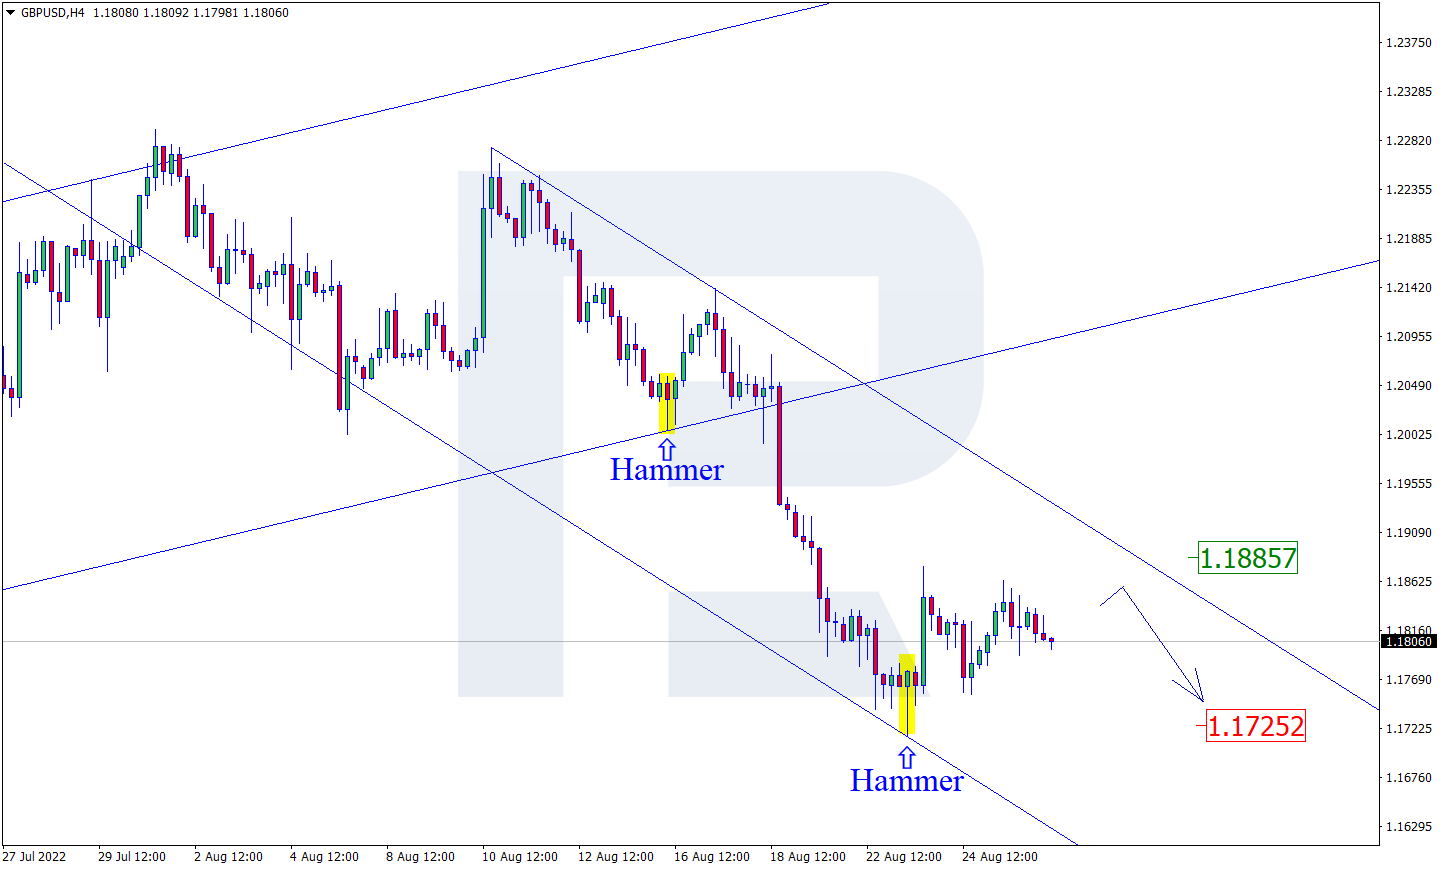
As we can see in the H4 chart, GBPUSD has formed a Hammer reversal pattern near the support level. At the moment, the pair may reverse in the form of a new ascending impulse. In this case, the upside target may be the resistance area at 1.1885. Later, the market may rebound from this level and resume falling. Still, there might be an alternative scenario, in which the asset may continue falling to reach the support level at 1.1725 without testing the resistance area.
Attention! Forecasts presented in this section only reflect the author’s private opinion and should not be considered as guidance for trading. RoboForex LP bears no responsibility for trading results based on trading recommendations described in these analytical reviews.







 Article by