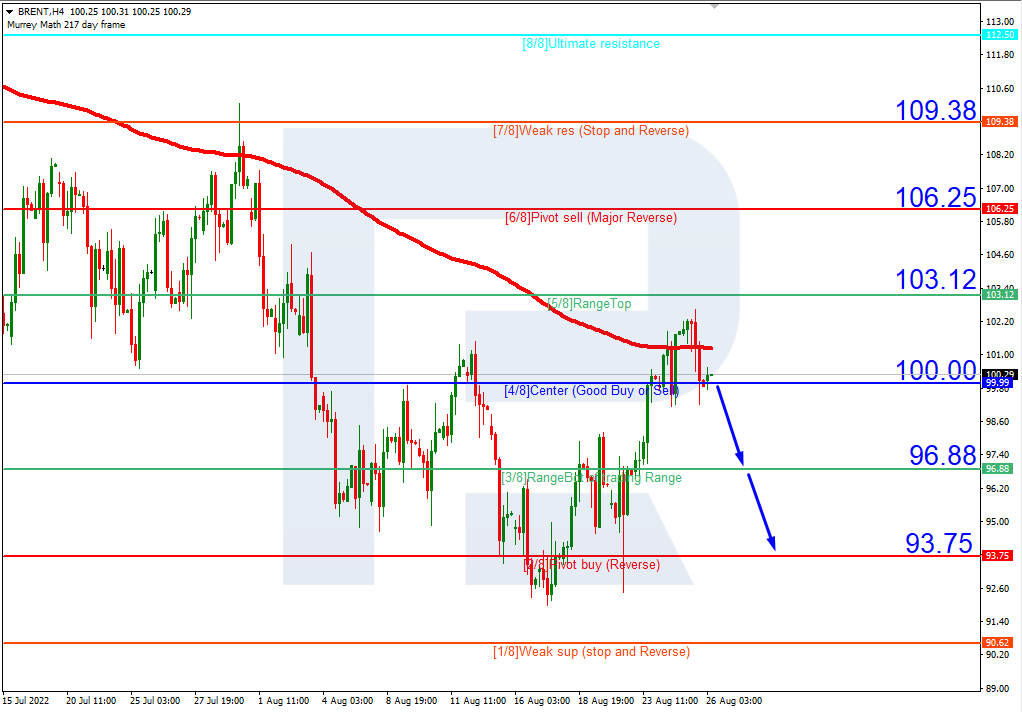
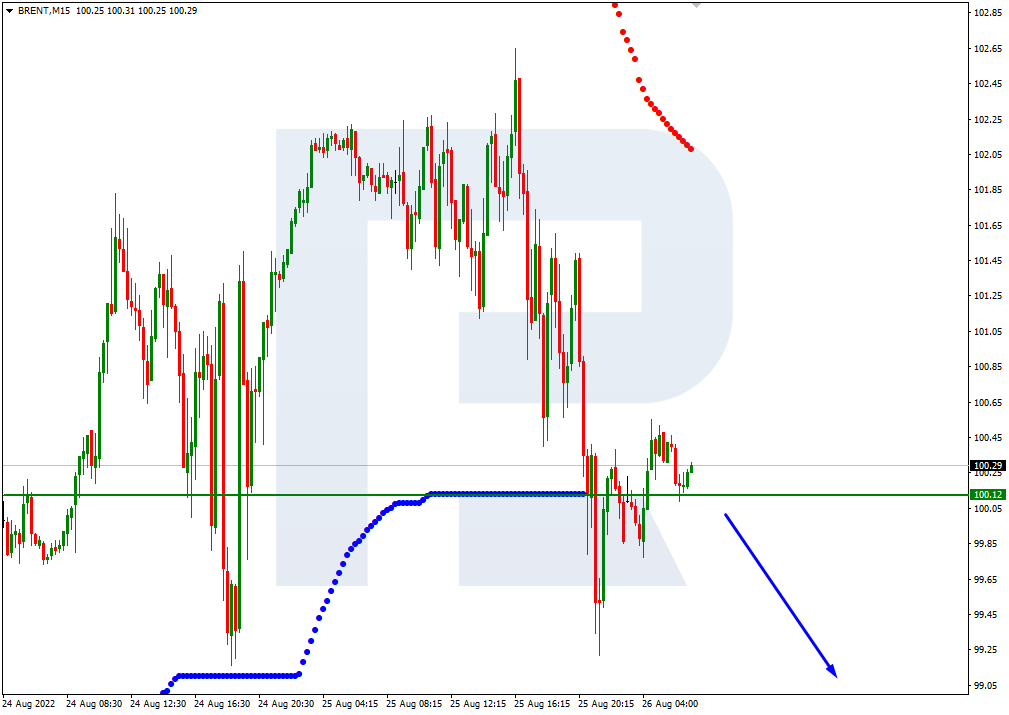
As we can see in the H4 chart, Brent is trading below the 200-day Moving Average, thus indicating a descending tendency. In this case, the price is expected to break 4/8 and continue moving downwards to reach the support at 3/8. However, this scenario may no longer be valid if the asset breaks 5/8 to the upside. After that, the instrument may reverse and grow to return to the resistance at 6/8.
In the M15 chart, the pair may break the downside line of the VoltyChannel indicator and, as a result, continue its decline.
S&P 500
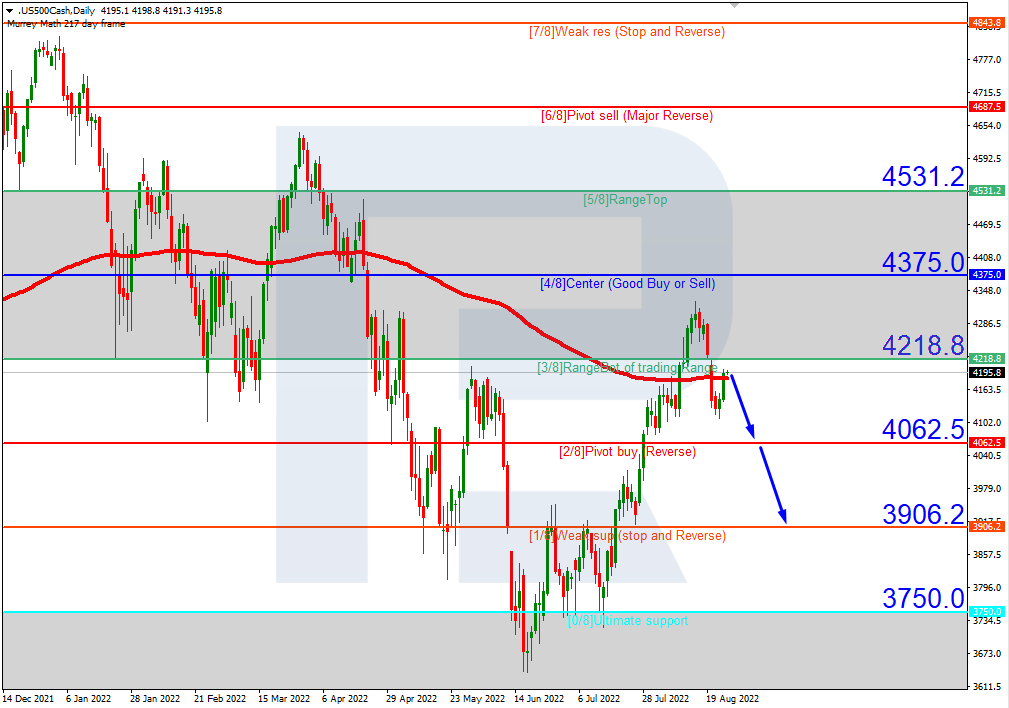
As we can see in the H4 chart, after breaking the consolidation range, the S&P Index is trading below 3/8. In this case, the price is expected to test 2/8, break it, and then continue falling towards the support at 1/8. However, this scenario may no longer be valid if the asset breaks the resistance at 3/8 to the upside. After that, the instrument may reverse and grow to reach 4/8.
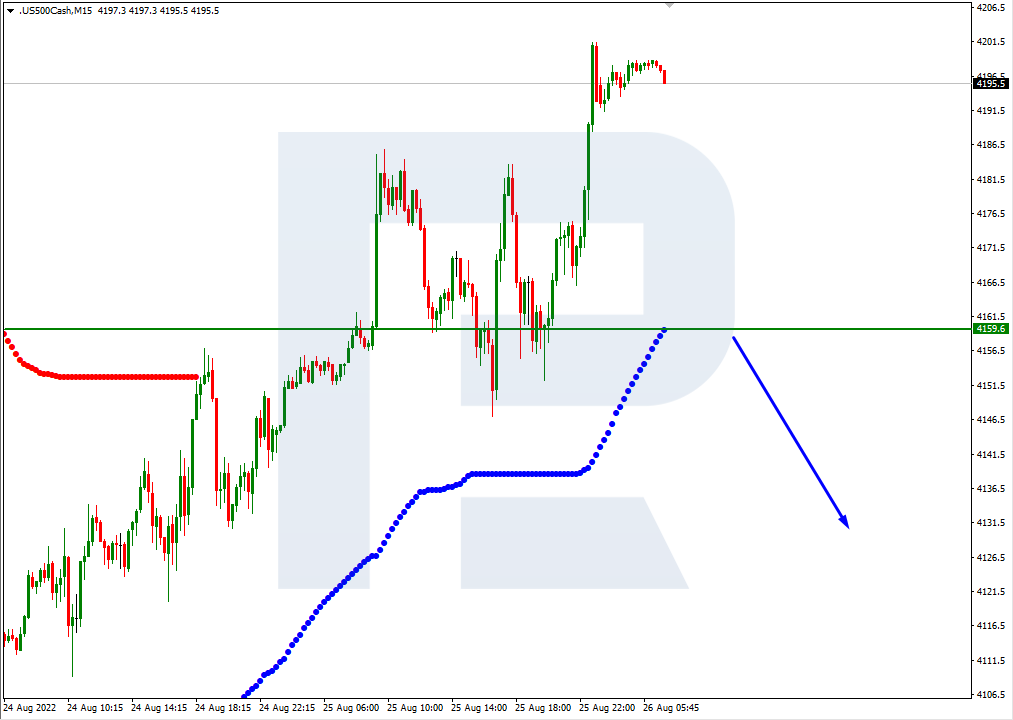
In the M15 chart, the pair may break the downside line of the VoltyChannel indicator and, as a result, continue trading downwards to reach 1/8 from the H4 chart.
Attention! Forecasts presented in this section only reflect the author’s private opinion and should not be considered as guidance for trading. RoboForex LP bears no responsibility for trading results based on trading recommendations described in these analytical reviews.
Allow me to begin with an important note: this article was published before Fed Chair Jerome Powell is due to make his Jackson Hole speech later today (Friday, August 26th), which may trigger an almighty reaction across global financial markets.
Still, that shouldn’t stop us from already giving you a heads up on major economic data releases and events for the coming week:
Monday, August 29
AUD: Australia July retail sales
UK markets closed
Tuesday, August 30
JPY: Japan July jobless rate
EUR: Eurozone August economic confidence, Germany August CPI
USD: US August consumer confidence, New York Fed President John Williams speech
Wednesday, August 31
JPY: Japan July industrial production, retail sales, August consumer confidence
CNH: China August PMIs
EUR: Eurozone August CPI, Germany August unemployment
EUR: Russian gas flow to Europe halted for 3 days due to Nord Stream pipeline maintenance
CAD: Canada June/2Q GDP
USD: Fed speak – Cleveland Fed President Loretta Mester, Atlanta Fed President Raphael Bostic
US crude: EIA weekly oil inventory report
Thursday, September 1
AUD: Australia August manufacturing PMI
CNH: Caixin China August manufacturing PMI
EUR: Eurozone July unemployment, August manufacturing PMI (final)
GBP: UK August manufacturing PMI (final)
USD: US weekly jobless claims, ISM August manufacturing
Friday, September 2
USD: US August nonfarm payrolls
The euro has already been beleaguered by a confluence of economic woes, including record-high inflation, the ECB’s apparent lag behind the Fed in its own rate hikes, and a darkening economic outlook (no thanks to the war that’s still raging off its eastern borders).
All that has already combined to drag EURUSD below parity, down to levels not seen in 20 years!
And the shared currency may find little solace from the data dump due out of the Eurozone in the coming week:
August economic confidence (due Tuesday, Aug 30): forecasted to slip further to 97.8 compared to 99.0 in the month prior
August CPI (due Wednesday, Aug 31): 8.8% estimate, a slight reprieve in the year-on-year headline inflation figure from July’s 8.9% – a record high.
Even an upside surprise in the headline CPI print to a fresh record high (above 8.9%) which potentially pushes the European Central Bank into a steeper rate-hiking cycle, may not be enough to offer support for the euro currency, considering the major concerns swirling about the Eurozone economy.
Worsening energy crisis for Europe?
Also crucially, EU policymakers fear that Russian gas flows may be halted, after the Wednesday-Friday maintenance to the crucial Nord Stream pipeline is completed.
Such a drastic event would only exacerbate Europe’s energy crisis, while dragging EURUSD to lower depths!
US jobs report to have major say on EURUSD
And of course, the USD half of EURUSD will also hold tremendous sway over the world’s most popularly-traded currency pair.
And markets will be keenly awaiting the August US nonfarm payrolls report, due on September 2nd.
The median estimate in Bloomberg’s survey of economists predict a 300,000 increase in US jobs created this month. If so, that would be lower than July’s 528k print, and also the lowest number of monthly jobs created since December 2019.
However, the US unemployment rate is forecasted to remain at a five-decade low of 3.5%.
Investors and traders worldwide may still interpret the relatively lower headline NFP print as a sign that US jobs growth momentum is waning.
That may suggest that the Fed will take a more gradual approach with its rate hikes (shy away from supersized 75 basis point hikes and instead be more comfortable with 50-bps hikes or even back to the customary 25bps adjustments).
Such a narrative may translate into a softer US dollar which in turn alleviates the downward pressure on EURUSD and lift this currency pair back above parity.
EURUSD forecasted to remain below parity going into September
As things stand (again, before Powell’s speech due later today at Jackson Hole), here are some probabilities over potential EURUSD levels for you to mull over:
Using 2002’s price action for reference, further declines for EURUSD below its recent cycle low of 0.99 should see stronger support around the 0.96 region. However, markets are only pricing in a mere 1.8% chance of such a drastic drop to such lows in the week ahead (at the time of writing).
To the upside, the 1.0000 parity level now plays the crucial role as immediate resistance, with stronger resistance set to arrive around 1.009 (late-July cycle lows), following by EURUSD’s 50-day simple moving average around 1.02.
Overall, there appears to be a greater-than-even chance (58%) that EURUSD should stay below parity over the coming week.
In summary, as long as king dollar remains well bid in anticipation of more supersized Fed rate hikes, coupled with growing pessimism surrounding the Eurozone, that should heap more downward pressure on EURUSD.
The US GDP contraction in the second quarter was revised to 0.6% from 0.9%. Weekly jobless claims fell by 2,000 to 243,000. Thus the US labor market remains strong, and the economy is contracting, but not as fast as originally anticipated. All these signs give the US Federal Reserve the room to raise interest rates further aggressively.
From the technical point of view, the trend on the EUR/USD currency pair on the hourly time frame is bearish. In the run-up to the Fed head’s speech, volatility has decreased, and the price forms a balance. The MACD indicator has become inactive. Under such market conditions, buy trades are best to be sought on intraday time frames from the support level of 0.9941, but with confirmation. Sell trades can be considered from resistance levels of 0.9996, but only after additional confirmation, as the level has already been tested twice.
Alternative scenario: if the price breaks out of the 1.0146 resistance level and fixes above, the uptrend will likely resume.
News feed for 2022.08.26:
– US PCE Price index (m/m) at 15:30 (GMT+3);
– Jackson Hole Symposium at 16:00 (GMT+3);
– US Fed Chair Powell Speaks at 17:00 (GMT+3);
– US Michigan Consumer Sentiment (m/m) at 17:00 (GMT+3).
The GBP/USD currency pair
Technical indicators of the currency pair:
Prev Open: 1.1791
Prev Close: 1.1835
% chg. over the last day: +0.37%
Economic observers are warning of a harsh winter in the UK as utilities prepare for an unprecedented increase in energy bills in October, followed by another increase in January. The British pound is under pressure for three main reasons: the energy crisis, the interest rate differential between the US Fed and the Bank of England, and policy uncertainty.
From the technical point of view, the trend on the GBP/USD currency pair on the hourly time frame is bearish. The price is now forming an accumulation zone. The MACD indicator has become inactive, and the sellers’ pressure has slightly decreased, but the main priority is still downward. At the moment, it is better to look for sell deals from the resistance level of 1.1903 or 1.2000, but only after the additional confirmation. Buy trades can be considered on intraday time frames from the support level of 1.1787, but only with confirmation and short targets.
Alternative scenario: if the price breaks out through the 1.2000 resistance level and fixes above, the uptrend will likely resume.
There is no news feed for today.
The USD/JPY currency pair
Technical indicators of the currency pair:
Prev Open: 136.99
Prev Close: 136.50
% chg. over the last day: -0.36%
“Moving to tighten monetary policy when demand remains inadequate to supply will hurt Japan’s economy and be a major constraint on households and business activity,” a Bank of Japan official said yesterday. According to policymakers, although core consumer inflation is slowly accelerating due to rising energy, food, and durable goods prices, such growth is likely to dissipate by the end of the year. For this reason, the Bank of Japan continues to maintain an ultra-soft monetary policy while other central banks worldwide are raising interest rates.
Trading recommendations
Support levels: 135.89, 135.35, 134.23, 133.47, 132.27, 131.08, 130.85
Resistance levels: 137.01, 137.43, 138.25
From the technical point of view, the medium-term trend on the currency pair USD/JPY is bullish. The USD/JPY has corrected to the levels of the moving averages and is forming a balance. The MACD indicator has become inactive. Under such market conditions, buy trades can be sought from the support level of 135.89 or 135.35, but with additional confirmation. For sell deals, traders can consider the resistance level of 137.01, but only with additional confirmation, as fundamentally, USD/JPY quotes are inclined to grow.
Alternative scenario: If the price fixes below 135.35, the downtrend will likely resume.
News feed for 2022.08.26:
– Japan Tokyo Core CPI (m/m) at 02:30 (GMT+3).
The USD/CAD currency pair
Technical indicators of the currency pair:
Prev Open: 1.2966
Prev Close: 1.2922
% chg. over the last day: -0.34%
Oil prices declined on Thursday due to volatile trade as investors prepare for the possible return of sanctioned Iranian oil exports to global markets and fears that rising US interest rates will dampen fuel demand. On the other hand, the prospect that the OPEC+ producer group may limit oil supplies limits the fall in oil prices. The Canadian dollar is a commodity currency, so it is highly dependent on indicators such as the dollar index as well as oil prices. Fundamentally, traders should not expect any medium-term trends in the currency pair USD/CAD.
Trading recommendations
Support levels: 1.2900, 1.2858, 1.2809, 1.2761
Resistance levels: 1.2985, 1.3016, 1.3090, 1.3105
From the point of view of technical analysis, the trend on the USD/CAD currency pair is bullish. The price is now trading at the levels of the moving averages, with the sellers’ pressure temporarily prevailing. Under such market conditions, buy trades should be considered on the lower time frames from the support level of 1.2900, but only with confirmation. For sell deals, it is better to consider the resistance level of 1.2985.
Alternative scenario: if the price breaks down and consolidates below the 1.2900 support level, the downtrend will likely resume.
This article reflects a personal opinion and should not be interpreted as an investment advice, and/or offer, and/or a persistent request for carrying out financial transactions, and/or a guarantee, and/or a forecast of future events.
RoboMarkets won the title of “Best ECN Broker – Europe” at the annual Global Brands Awards 2022. In the past, organisers have rewarded RoboMarkets with this nomination twice – in 2020 and 2021.
The event organiser, Global Brands Magazine, is the leading media in providing the latest and most detailed analytics and information about global brands from various segments, which demonstrate outstanding results in different business areas. Global Brands Awards are given to the most successful representatives in the spheres of finance, education, tourism, lifestyle, technology, and the car industry. The major goal is building the awareness of the most outstanding brands in their areas to reward them for their effort in achieving leading positions in the market.
Denis Golomedov, Chief Marketing Officer at RoboMarkets, says: “RoboMarkets has been named the “Best ECN Broker – Europe” for the third consecutive year, and it has become a good tradition with us. We’d like to express our profound gratitude to the jury panel and promise to do our utmost to make the list of winners next year”.
About RoboMarkets
RoboMarkets is an investment company with the CySEC license No. 191/13. RoboMarkets offers investment services in many European countries by providing traders, who work on financial market, with access to its proprietary trading platforms. More detailed information about the Company’s products and activities can be found on the official website at www.robomarkets.com.
RoboForex announces receiving the “Best Investment Products – Global” accolade at the Global Brands Awards 2022. In the past, Global Brands Awards have rewarded RoboForex for the best investment products on three occasions – in 2019, 2020, and 2021.
Global Brands Awards was established to honour companies, which demonstrate outstanding results in different business areas. The organising committee gives awards to the most successful representatives in the spheres of finance, education, tourism, lifestyle, technology, and the car industry.
Robert Stephenson, Chief Business Officer at RoboForex, commented: “We’re very proud of receiving this award for some years now. For us, it’s a criterion of success of the direction the Company chose, and a motivation to excel ourselves next year and compete for a win again. We’d like to express our profound gratitude to organisers and the jury panel, who gave such a high appraisal of our investment products.”
About Global Brands Awards
Global Brands Awards rewards the best companies that have an obvious advantage over competitors due to providing their clients with high quality services. The event is organised by Global Brands Magazine, one of the leading online medias, that publishes the latest news, reviews, opinions, and polls about leading global brands in various market segments.
About RoboForex
RoboForex is a company which delivers brokerage services. The company provides traders who work on financial markets with access to its proprietary trading platforms. RoboForex Ltd has the brokerage licence FSC 000138/333. More detailed information about the Company’s products and activities can be found on the official website at roboforex.com.
The US indices rose on Thursday, thanks to support from growth and semiconductor stocks, as investors watched the Federal Reserve’s conference in Jackson Hole to gain insight into the future outlook for monetary policy. Fed Chairman Jerome Powell will give a speech today that will be analyzed for any indication that the economic slowdown may change the Central Bank’s strategy. The US GDP data showed yesterday that the US economy contracted at a more moderate pace in the second quarter than originally thought, as consumer spending partially cushioned resistance to the sharp slowdown in inventory accumulation, dispelling fears that the recession was continuing. Nobel Prize-winning economist Richard Thaler said the US economy was showing more signs of strength than weakness.
The National Bureau of Economic Research, the official arbiter of recessions in the United States, defines a recession as a significant decline in economic activity that extends throughout the economy, lasting more than several months, usually manifested in production, employment, and real income.
As the stock market closed yesterday, the Dow Jones Index (US30) increased by 0.98%, and the S&P 500 Index (US500) added 1.41%. The NASDAQ Technology Index (US100) gained 1.67%.
Federal Reserve Bank of Kansas City President Esther George said yesterday that it is too early to predict how much the US Central Bank will raise interest rates next month because key inflation and labor market reports are still to come. Atlanta Fed President Raphael Bostic also said he has not yet decided whether the Fed should raise interest rates by 50 or 75 basis points at its policy meeting next month. Traders of Fed funds futures contracts estimate a 59% chance that the Fed will raise rates another 75 basis points at its September meeting and a 41% chance of a 50 bps hike.
Graphics chip maker Nvidia Corp forecasts a sharp drop in revenue for the current quarter amid a weakening gaming industry. Analysts believe Nvidia could see further declines in the crypto-mining and data center markets as well.
Equity markets in Europe traded yesterday without a single dynamic. German DAX (DE30) gained 0.39%, French CAC 40 (FR40) fell by 0.08%, Spanish IBEX 35 (ES35) lost 0.15%, British FTSE 100 (UK100) closed on Wednesday at plus 0.11%.
According to July’s ECB monetary policy minutes, most central bank officials agreed to a more aggressive 50 bps rate hike at the next meeting in the context of the recent deterioration in inflation prospects as well as the deteriorating economic conditions in the Eurozone.
Germany’s IFO business climate Index fell to 88.5 points in August from a revised 88.7 points in July. The IFO index is based on a survey of about 9,000 companies in manufacturing, services, trade, and construction. Business confidence in Germany worsened in August as companies became more pessimistic about rising energy prices and the threat of gas shortages.
The situation in the oil market remains uncertain. Oil prices fell yesterday as investors prepare for the possible return of sanctioned Iranian oil exports to global markets and over concerns that rising US interest rates will weaken fuel demand. On the other hand, the prospect that the OPEC+ group of producers may limit oil supplies limits the fall in oil prices.
Asian markets were mostly up yesterday. Japan’s Nikkei 225 (JP225) gained 0.58%, Hong Kong’s Hang Seng (HK50) jumped by 3.63%, and Australia’s S&P/ASX 200 (AU200) added 0.70% yesterday.
S&P 500 (F) (US500) 4,199.12 +58.35 (+1.41%)
Dow Jones (US30) 33,291.78 +322.55 (+0.98%)
DAX (DE40) 13,271.96 +51.90 (+0.39%)
FTSE 100 (UK100) 7,479.74 +8.23 (+0.11%)
USD Index 108.44 −0.24 (−0.22%)
Important events for today:
– New Zealand RBNZ Gov Orr Speaks at 01:30 (GMT+3);
– Japan Tokyo Core CPI (m/m) at 02:30 (GMT+3);
– US PCE Price index (m/m) at 15:30 (GMT+3);
– Jackson Hole Symposium at 16:00 (GMT+3);
– US Fed Chair Powell Speaks at 17:00 (GMT+3);
– US Michigan Consumer Sentiment (m/m) at 17:00 (GMT+3).
This article reflects a personal opinion and should not be interpreted as an investment advice, and/or offer, and/or a persistent request for carrying out financial transactions, and/or a guarantee, and/or a forecast of future events.
The new Inflation Reduction Act is stuffed with subsidies for everything from electric vehicles to heat pumps, and incentives for just about every form of clean energy. But pouring money into technology is just one step toward solving the climate change problem.
Wind and solar farms won’t be built without enough power lines to connect their electricity to customers. Captured carbon and clean hydrogen won’t get far without pipelines. Too few contractors are trained to install heat pumps. And EV buyers will think twice if there aren’t enough charging stations.
In my new book about climate solutions, I discuss these and other obstacles standing in the way of a clean energy transition. Surmounting them is the next step as the country figures out how to turn the goals of the most ambitious climate legislation Congress has ever passed into reality.
Two outcomes matter: how deeply U.S. actions slash emissions domestically, and how effectively they cut the costs of clean technologies so that other countries can slash their emissions too.
Infrastructure and obstacles
Various studiespredictthat the Inflation Reduction Act will cut U.S. greenhouse gas emissions to around 40% below their 2005 levels by 2030. That’s a cut of roughly 1 billion tons per year, far more than any other U.S. legislation has achieved.
But it still leaves a roughly 10 percentage point gap from President Joe Biden’s target of at least a 50% reduction in emissions by 2030.
What will it take to close that gap?
The Inflation Reduction Act’s subsidies will make clean technologies cheaper, but the biggest need domestically is for more infrastructure and stricter environmental regulations.
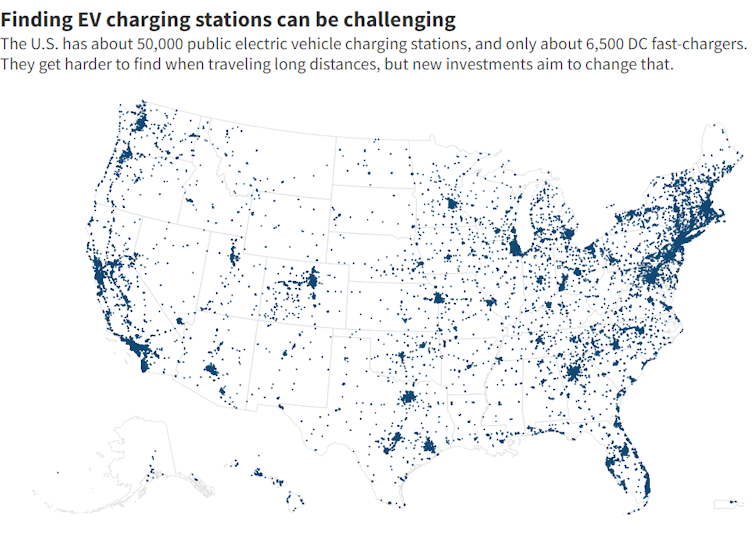
For infrastructure, tax credits for electric cars will do little good without enough publicly available chargers. The U.S. has around 145,000 gas stations, but only about 6,500 fast-charging stations that can power up a battery quickly for a driver on the go.
Over 1,300 gigawatts of wind, solar and battery projects – several times the existing capacity – are already waiting to be built, but they’ve been delayed for years by a lack of grid connections and backlogged approval processes by regional grid operators.
The Infrastructure Investment and Jobs Act passed by Congress last year provides some funding for chargers, power lines and pipelines, but nowhere near enough. For example, it sets aside only a few billion dollars for high-voltage power lines, a tiny share of the hundreds of billions of dollars needed to chart a path toward net-zero emissions. Its $7.5 billion for chargers is just a third of what electric car advocates project will be needed.
Even more important is to clear the regulatory obstacles to building clean energy infrastructure.
Democratic leaders of the Senate and House have pledged to pass legislation to make it easier to obtain permits for power lines and pipelines, but doing so would require bipartisan support, and that remains in doubt.
State and local governments and regional grid operators also play pivotal roles in approving new infrastructure and clean energy projects. They must overcome not-in-my-backyard opposition – some of it from policymakers themselves – to the power lines, pipelines and facilities that will be needed for clean energy, and simplify approval processes for rooftop solar panels.
It can’t all be carrots: Sticks are needed, too
We’ll also need regulatory sticks to supplement the Inflation Reduction Act’s carrot cake buffet.
By tightening emissions limits for greenhouse gases and other air pollutants under its Clean Air Act authority, the Environmental Protection Agency can spur the closure of old fossil-fueled power plants, require carbon capture at new ones and drive emissions reductions across a range of industries.
Stricter emissions limits could force gasoline and diesel vehicles to become more efficient and accelerate the adoption of electric ones. Tougher reporting rules and better monitoring of methane leaks will be needed to back up the one stick in the Inflation Reduction Act – its tax on methane emissions.
States wield powerful regulatory sticks too. Ten states have already set 100% clean or renewable electricity standards. California and Oregon have set requirements for cleaner fuels, and states like New York and Washington are implementing comprehensive climate strategies. The more states follow their lead, the more quickly emissions can be cut. The new federal subsidies will ease the path to doing so.
Ramping up research and global impact
All the new spending has the potential to achieve deep emissions cuts domestically, but they will have little impact abroad without further action.
Other countries will only adopt clean technologies if they’re affordable, but the Inflation Reduction Act’s subsidy buffet is only available to U.S. citizens and companies. Its rewards for domestic solar manufacturers may help them gain market share in the U.S., but they’ll likely do little to reduce prices in markets dominated by low-cost Asian manufacturers.
More progress abroad may be driven in future decades by the boosts in funding for emerging technologies. For example, the Inflation Reduction Act provides billions of dollars for clean hydrogen and carbon capture technologies that are not yet commercially viable but could become so with greater deployment. Carbon capture should be targeted toward locking up carbon from difficult-to-decarbonize industries like biofuel production, rather than to prolong the use of coal power plants or subsidize oil and gas production.
The CHIPS and Science Act Biden signed in early August 2022 authorizes $67 billion in funding for zero-carbon industries and climate research, although subsequent legislation will be needed to ensure that those funds are actually appropriated.
It would double the budget for the Department of Energy’s ARPA-E program, which funds research into the most cutting-edge energy technologies. As I discuss in my book, that could be especially important for making clean hydrogen cheap, making geothermal viable in more places, and developing new forms of energy storage. Together with the subsidies provided by the Inflation Reduction Act, that could jump-start the research, development and deployment needed to make these technologies affordable worldwide in the decades ahead.
After years of gridlock, there’s reason to celebrate Congress passing three bills that will do more to cut U.S. emissions than any legislation in history. But much more will be needed to reach the nation’s climate goals and to make clean energy more affordable at home and abroad.
The new movie “Fall” is a survival-thriller about two young women, Becky and Hunter, who are avid rock climbers. To mark the one-year anniversary of Becky’s husband’s death in a climbing accident, they decide to climb an abandoned 2,000-foot TV tower.
But a ladder breaks, and they find themselves stranded atop the rusty steel latticework. Ironically, at the top of the communication tower, the climbers are too high in the air to get a phone signal to call for rescue.
Other recent movies have also featured terrifying communication towers.
Take the 2016 film “Cell,” which is based on a Stephen King novel. In it, a cell tower signal turns normal people into zombies, a literal version of the cliché about the effect mobile phones have on users. The 2018 Indian sci-fi blockbuster “2.0” features a gigantic Kaiju monster – akin to Godzilla or Mothra – made of cellphones. It rises to avenge the deaths of millions of birds supposedly killed by cell tower radiation. (Millions of birds do die every year by crashing into towers, but probably because they become disoriented by their lights, not from the radiation they emit.)
Why are communication towers so scary? Why, in “Fall,” is the steel tower somehow more disturbing than the rocky cliff face where Becky’s husband died?
As anthropologist Shannon Mattern has argued, towers and antennas are visible manifestations of vast invisible networks – mostly wireless or underground – that can be hard for people to wrap their heads around, even as they grow increasingly dependent on them.
They’re a reminder of something that most of us would rather forget: that we’re immersed in an electromagnetic soup of radio waves, walking around every day in what design scholar Anthony Dunne has called “hertzian space.” Those same invisible waves also signal the possibility of ubiquitous surveillance and manipulation.
So a latticework steel tower or a sleek monopole mast with an array of rectangular antenna panels clustered at its top can elicit powerful responses.
On the one hand, there’s denial – you might half-consciously “unsee” them and pretend they’re not there.
On the other hand, they can become a source of paranoia, which sometimes metastasizes into conspiracy theories.
Hidden in plain sight
Cell towers are often designed to hide in plain sight. Some are even disguised as pine trees or palm trees – rather poorly, in most cases. But stealth towers like these aren’t actually meant to pass for the natural objects they imitate.
Like all camouflage, they’re just supposed to distract our attention long enough for us to overlook them. The brown painted “bark” and green plastic “leaves,” or the rows of rectangular antenna panels painted to blend into building façades, are simply prompts to our unseeing – cues to look away. Nothing to see here, they say.
In recent years, 5G antennas have started showing up everywhere, often as unlabeled boxes or cylinders on standalone poles or streetlights.
Known as small-cell networks, these faster and more powerful 5G systems require many more antennas spaced closer together. This greater density has provoked increased fears about potential risks to health and security, along with more paranoid reactions linking cellular radiation to cancer – a link not supported by scientific research. Some people even wrongly blamed 5G for the COVID-19 pandemic.
Some of the extreme reactions against cell towers may be the result of displaced anxiety about the very real risks of everyday technology.
Most of us sense – though we often prefer to forget – that each steel cell tower or sleek 5G box is just the tip of the iceberg. It’s a visible sign of mostly invisible global communication networks, tied to centers of commercial and political power, that are gradually eroding our privacy and autonomy.
During the long seafaring voyages of the 15th and 16th centuries, a period known as the Age of Discovery, sailors reported experiencing visions of sublime foods and verdant fields. The discovery that these were nothing more than hallucinations after months at sea was agonizing. Some sailors wept in longing; others threw themselves overboard.
The cure for these harrowing mirages turned out to be not a concoction of complex chemicals, as once suspected, but rather the simple antidote of lemon juice. These sailors suffered from scurvy, a disease caused by a deficiency of vitamin C, an essential micronutrient that people acquire from eating fruits and vegetables.
Vitamin C is important for the production and release of neurotransmitters, the chemical messengers of the brain. In its absence, brain cells do not communicate effectively with one another, which can lead to hallucinations.
Beyond that, my research is also focused on understanding how food can influence our thoughts, moods and behaviors. While we can’t yet prevent or treat brain conditions with diet, researchers like me are learning a great deal about the role that nutrition plays in the everyday brain processes that make us who we are.
Perhaps not surprisingly, a delicate balance of nutrients is key for brain health: Deficiencies or excesses in vitamins, sugars, fats and amino acids can influence brain and behavior in either negative or positive ways.
As with vitamin C, deficits in other vitamins and minerals can also precipitate nutritional diseases that adversely impact the brain in humans. For example, low dietary levels of vitamin B3/niacin – typically found in meat and fish – cause pellagra, a disease in which people develop dementia.
Niacin is essential to turn food into energy and building blocks, protect the genetic blueprint from environmental damage and control how much of certain gene products are made. In the absence of these critical processes, brain cells, also known as neurons, malfunction and die prematurely, leading to dementia.
In animal models, decreasing or blocking the production of niacin in the brain promotes neuronal damage and cell death. Conversely, enhancing niacin levels has been shown to mitigate the effects of neurodegenerative diseases such as Alzheimer’s, Huntington’s and Parkinson’s. Observational studies in humans suggest that sufficient levels of niacin may protect against these diseases, but the results are still inconclusive.
Interestingly, niacin deficiency caused by consumption of excessive amounts of alcohol can lead to similar effects as those found with pellagra.
Another example of how a nutrient deficiency affects brain function can be found in the element iodine, which, like niacin, must be acquired from one’s diet. Iodine, which is present in seafood and seaweed, is an essential building block for thyroid hormones – signaling molecules that are important for many aspects of human biology, including development, metabolism, appetite and sleep. Low iodine levels prevent the production of adequate amounts of thyroid hormones, impairing these essential physiological processes.
Not all dietary deficiencies are detrimental to the brain. In fact, studies show that people with drug-resistant epilepsy – a condition in which brain cells fire uncontrollably – can reduce the number of seizures by adopting an ultralow-carbohydrate regimen, known as a ketogenic diet, in which 80% to 90% of calories are obtained from fat.
Carbohydrates are the preferred energy source for the body. When they are not available – either because of fasting or because of a ketogenic diet – cells obtain fuel by breaking down fats into compounds called ketones. Utilization of ketones for energy leads to profound shifts in metabolism and physiology, including the levels of hormones circulating in the body, the amount of neurotransmitters produced by the brain and the types of bacteria living in the gut.
Researchers think that these diet-dependent changes, especially the higher production of brain chemicals that can quiet down neurons and decrease levels of inflammatory molecules, may play a role in the ketogenic diet’s ability to lower the number of seizures. These changes may also explain the benefits of a ketogenic state – either through diet or fasting – on cognitive function and mood.
Some foods can negatively affect your memory and mood.
Sugar, saturated fats and ultraprocessed foods
Excess levels of some nutrients can also have detrimental effects on the brain. In humans and animal models, elevated consumption of refined sugars and saturated fats – a combination commonly found in ultraprocessed foods – promotes eating by desensitizing the brain to the hormonal signals known to regulate satiety.
Interestingly, a diet high in these foods also desensitizes the taste system, making animals and humans perceive food as less sweet. These sensory alterations may affect food choice as well as the reward we get from food. For example, research shows that people’s responses to ice cream in brain areas important for taste and reward are dulled when they eat it every day for two weeks. Some researchers think this decrease in food reward signals may enhance cravings for even more fatty and sugary foods, similar to the way smokers crave cigarettes.
High-fat and processed-food diets are also associated with lower cognitive function and memory in humans and animal models as well as a higher incidence of neurodegenerative diseases. However, researchers still don’t know if these effects are due to these foods or to the weight gain and insulin resistance that develop with long-term consumption of these diets.
Time scales
This brings us to a critical aspect of the effect of diet on the brain: time. Some foods can influence brain function and behavior acutely – such as over hours or days – while others take weeks, months or even years to have an effect. For instance, eating a slice of cake rapidly shifts the fat-burning, ketogenic metabolism of an individual with drug-resistant epilepsy into a carbohydrate-burning metabolism, increasing the risk of seizures. In contrast, it takes weeks of sugar consumption for taste and the brain’s reward pathways to change, and months of vitamin C deficiency to develop scurvy. Finally, when it comes to diseases like Alzheimer’s and Parkinson’s, risk is influenced by years of dietary exposures in combination with other genetic or lifestyle factors such as smoking.
In the end, the relationship between food and the brain is a bit like the delicate Goldilocks: We need not too little, not too much but just enough of each nutrient.
Having completed the descending wave at 0.9909, EURUSD is growing towards 1.0030. After that, the instrument may start another with the target at 0.9950, or even extend this structure down to 0.9807.
GBPUSD, “Great Britain Pound vs US Dollar”
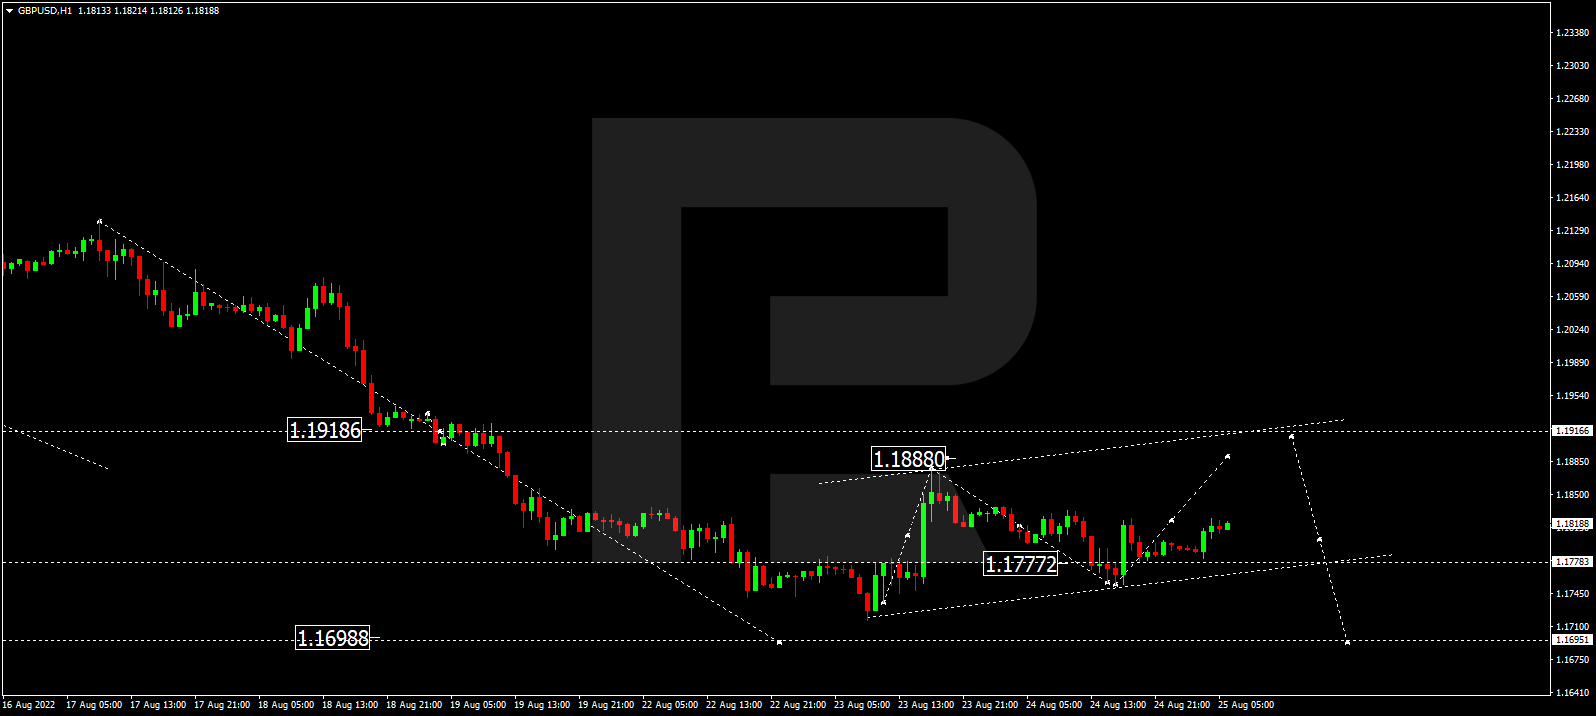
After finishing the descending wave at 1.1755, GBPUSD is growing towards 1.1885. Later, the market may start a new decline to break 1.1777 and then resume trading downwards with the target at 1.1695.
USDJPY, “US Dollar vs Japanese Yen”
USDJPY is consolidating around 136.50. Today, the pair may fall towards 135.70 and then form one more ascending structure to test 136.00 from below. After that, the instrument may resume trading downwards with the target at 134.66.
USDCHF, “US Dollar vs Swiss Franc”
USDCHF is still consolidating around 0.9645. Possibly, today the pair may fall towards 0.9600. If later the price breaks this range to the upside, the market may resume trading upwards with the target at 0.9715; if to the downside – start a new correction to reach 0.9515.
AUDUSD, “Australian Dollar vs US Dollar”
AUDUSD is consolidating around 0.6900. Today, the pair may grow towards 0.6970 and then start another decline with the target at 0.6900.
BRENT
Brent has reached its upside target at 102.22; right now, it is consolidating there. Possibly, the asset may expand the range up to 102.33 and then start a new decline with the target at 99.70, or even extend this correctional structure down to 97.40.
XAUUSD, “Gold vs US Dollar”
After finishing the ascending wave at 1757.30, Gold is expected to consolidate there. Possibly, the metal may break the range to the downside and continue the correction down to 1742.42. Later, the market may form one more ascending structure with the target at 1772.00.
S&P 500
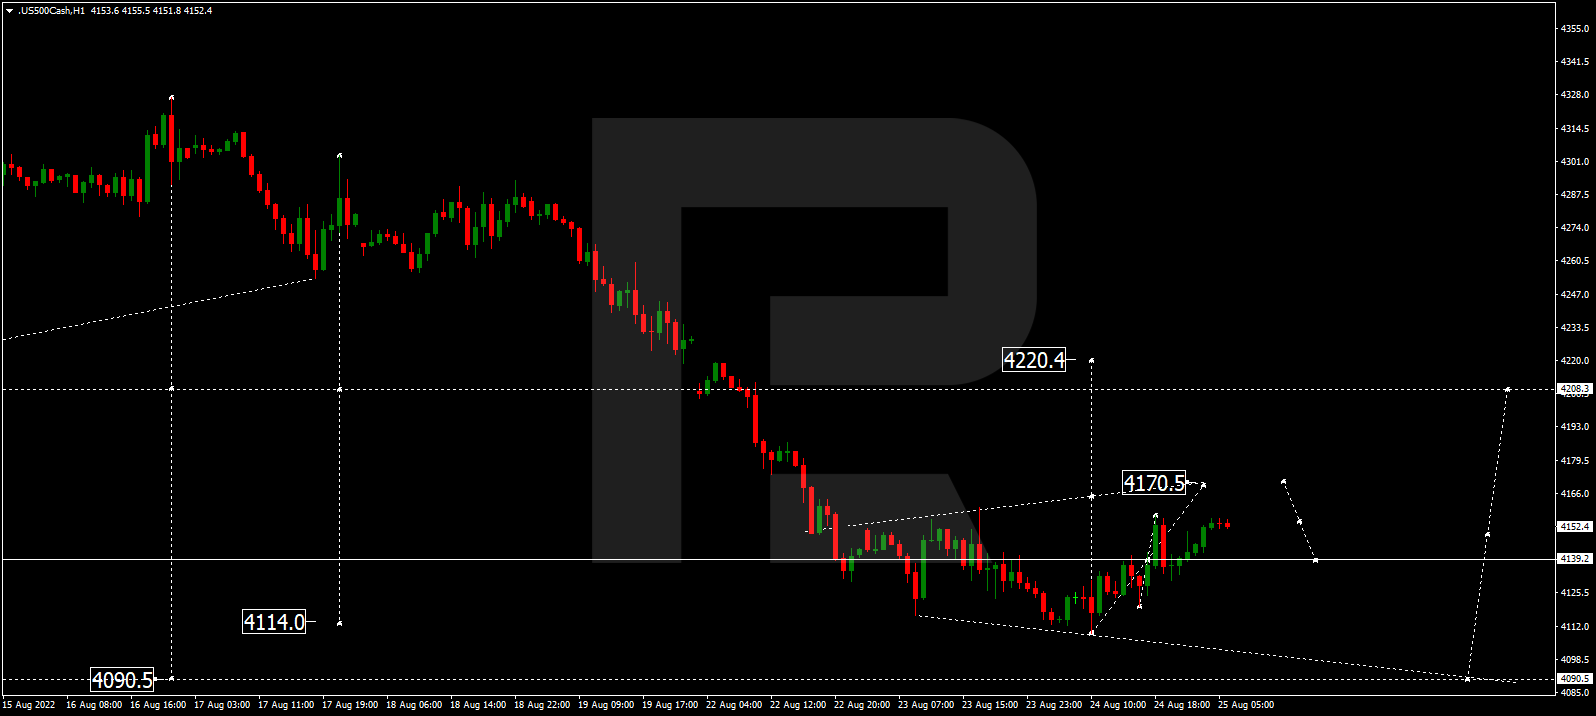
The S&P index has completed the descending wave at 4110.0; right now, it is consolidating around 4139.0. Possibly, today the asset may grow towards 4170.0 and then fall to return to 4139.0. If later the price breaks this range to the upside, the market may start a new growth to reach 4222.0; if to the downside –resume trading downwards with the target at 4090.0.
Attention! Forecasts presented in this section only reflect the author’s private opinion and should not be considered as guidance for trading. RoboForex LP bears no responsibility for trading results based on trading recommendations described in these analytical reviews.




 Article by