Speculators sharply raised their SP500-Mini bets for 2nd week to least bearish level since June

By InvestMacro

COT Stock Futures Open Interest Comparison

Here are the latest charts and statistics for the Commitment of Traders (COT) data published by the Commodities Futures Trading Commission (CFTC).

The latest COT data is updated through Tuesday September 27th and shows a quick view of how large traders (for-profit speculators and commercial entities) were positioned in the futures markets.

Weekly Speculator Changes led by S&P500 Mini and Nikkei 225

Stocks Futures Speculator Net Position Changes

The COT stock market speculator bets were slightly higher this week as four out of the seven stock markets we cover had higher positioning on the week while the other three markets had lower contracts.

Leading the gains for stock markets was the S&P500 Mini (69,250 contracts) with the Nikkei 225 USD (6,161 contracts), MSCI EAFE Mini (4,434 contracts) and the Russell 2000 Mini (777 contracts) also showing positive weeks.

The stock markets leading the declines in speculator bets this week were the Dow Jones Industrial Average Mini (-3,796 contracts), Nasdaq Mini (-3,533 contracts) and the VIX (-926 contracts).

Highlighting the COT Stocks data this week is another week of big moves in the SP500-Mini speculator contracts. The SP500-Mini speculator bets rebounded sharply for a second straight week and gained by more than +60,000 contracts for the second consecutive week. The past 2-week rise in speculator bets now totals +130,803 contracts. The SP500-Mini speculator position is now below the -200,000 contracts for the first time since July 5th and at the least bearish level since June 28th. Despite the positive speculator sentiment last week, the SP500 index sold off sharply to end the week and closed at its lowest level since November of 2020.


Data Snapshot of Stock Market Traders | Columns Legend
Sep-27-2022OIOI-IndexSpec-NetSpec-IndexCom-NetCOM-IndexSmalls-NetSmalls-Index
S&P500-Mini2,233,8785-150,20128232,96781-82,7669
Nikkei 22514,070101,52085-1,541222129
Nasdaq-Mini282,05461-487524,47342-24,4256
DowJones-Mini67,05524-19,2301420,42886-1,19832
VIX331,04236-82,7246890,37833-7,65454
Nikkei 225 Yen43,11519-6503214,38367-13,73347


Strength Scores

Strength Scores (a normalized measure of Speculator positions over a 3-Year range, from 0 to 100 where above 80 is extreme bullish and below 20 is extreme bearish) showed that the Nikkei USD (84.7 percent) leads the stock markets and is in a bullish extreme position (above 80 percent). The Nasdaq-Mini (75.0 percent) and the VIX (67.8 percent) come in as the next highest stock markets in strength scores.

On the downside, the Russell 2000-Mini (7.8 percent) comes in at the lowest strength level currently and is followed by the DowJones-Mini (13.8 percent) with both being in bearish extreme levels (below 20 percent).

Strength Statistics:
VIX (67.8 percent) vs VIX previous week (68.3 percent)
S&P500-Mini (28.4 percent) vs S&P500-Mini previous week (15.5 percent)
DowJones-Mini (13.8 percent) vs DowJones-Mini previous week (19.3 percent)
Nasdaq-Mini (75.0 percent) vs Nasdaq-Mini previous week (77.0 percent)
Russell2000-Mini (7.8 percent) vs Russell2000-Mini previous week (7.4 percent)
Nikkei USD (84.7 percent) vs Nikkei USD previous week (55.4 percent)
EAFE-Mini (27.3 percent) vs EAFE-Mini previous week (22.4 percent)

Strength Trends

Strength Score Trends (or move index, calculates the 6-week changes in strength scores) showed that the EAFE-Mini (27.3 percent) and the S&P500-Mini (25.5 percent) lead the past six weeks trends for stocks. The Nikkei USD (22.1 percent), the VIX (9.7 percent) and the Russell 2000-Mini (5.8 percent) round out the other positive movers in the latest trends data.

The DowJones-Mini (-17.7 percent) leads the downside trend scores currently while the next market with lower trend scores was the Nasdaq-Mini (-3.9 percent).


Strength Trend Statistics:
VIX (9.7 percent) vs VIX previous week (8.2 percent)
S&P500-Mini (25.5 percent) vs S&P500-Mini previous week (4.6 percent)
DowJones-Mini (-17.7 percent) vs DowJones-Mini previous week (-3.9 percent)
Nasdaq-Mini (-3.9 percent) vs Nasdaq-Mini previous week (-9.8 percent)
Russell2000-Mini (5.8 percent) vs Russell2000-Mini previous week (3.4 percent)
Nikkei USD (22.1 percent) vs Nikkei USD previous week (-12.8 percent)
EAFE-Mini (27.3 percent) vs EAFE-Mini previous week (7.8 percent)


Individual Markets:

VIX Volatility Futures:

VIX Volatility Futures COT ChartThe VIX Volatility large speculator standing this week recorded a net position of -82,724 contracts in the data reported through Tuesday. This was a weekly fall of -926 contracts from the previous week which had a total of -81,798 net contracts.

This week’s current strength score (the trader positioning range over the past three years, measured from 0 to 100) shows the speculators are currently Bullish with a score of 67.8 percent. The commercials are Bearish with a score of 33.1 percent and the small traders (not shown in chart) are Bullish with a score of 54.2 percent.

VIX Volatility Futures StatisticsSPECULATORSCOMMERCIALSSMALL TRADERS
– Percent of Open Interest Longs:17.855.07.2
– Percent of Open Interest Shorts:42.827.79.6
– Net Position:-82,72490,378-7,654
– Gross Longs:58,980182,09723,991
– Gross Shorts:141,70491,71931,645
– Long to Short Ratio:0.4 to 12.0 to 10.8 to 1
NET POSITION TREND:
– Strength Index Score (3 Year Range Pct):67.833.154.2
– Strength Index Reading (3 Year Range):BullishBearishBullish
NET POSITION MOVEMENT INDEX:
– 6-Week Change in Strength Index:9.7-7.3-22.0


S&P500 Mini Futures:

SP500 Mini Futures COT ChartThe S&P500 Mini large speculator standing this week recorded a net position of -150,201 contracts in the data reported through Tuesday. This was a weekly boost of 69,250 contracts from the previous week which had a total of -219,451 net contracts.

This week’s current strength score (the trader positioning range over the past three years, measured from 0 to 100) shows the speculators are currently Bearish with a score of 28.4 percent. The commercials are Bullish-Extreme with a score of 81.4 percent and the small traders (not shown in chart) are Bearish-Extreme with a score of 9.0 percent.

S&P500 Mini Futures StatisticsSPECULATORSCOMMERCIALSSMALL TRADERS
– Percent of Open Interest Longs:11.876.98.4
– Percent of Open Interest Shorts:18.566.512.1
– Net Position:-150,201232,967-82,766
– Gross Longs:262,7971,717,571186,623
– Gross Shorts:412,9981,484,604269,389
– Long to Short Ratio:0.6 to 11.2 to 10.7 to 1
NET POSITION TREND:
– Strength Index Score (3 Year Range Pct):28.481.49.0
– Strength Index Reading (3 Year Range):BearishBullish-ExtremeBearish-Extreme
NET POSITION MOVEMENT INDEX:
– 6-Week Change in Strength Index:25.5-16.4-3.5


Dow Jones Mini Futures:

Dow Jones Mini Futures COT ChartThe Dow Jones Mini large speculator standing this week recorded a net position of -19,230 contracts in the data reported through Tuesday. This was a weekly decline of -3,796 contracts from the previous week which had a total of -15,434 net contracts.

This week’s current strength score (the trader positioning range over the past three years, measured from 0 to 100) shows the speculators are currently Bearish-Extreme with a score of 13.8 percent. The commercials are Bullish-Extreme with a score of 85.8 percent and the small traders (not shown in chart) are Bearish with a score of 32.1 percent.

Dow Jones Mini Futures StatisticsSPECULATORSCOMMERCIALSSMALL TRADERS
– Percent of Open Interest Longs:21.360.617.3
– Percent of Open Interest Shorts:50.030.119.1
– Net Position:-19,23020,428-1,198
– Gross Longs:14,30940,63211,590
– Gross Shorts:33,53920,20412,788
– Long to Short Ratio:0.4 to 12.0 to 10.9 to 1
NET POSITION TREND:
– Strength Index Score (3 Year Range Pct):13.885.832.1
– Strength Index Reading (3 Year Range):Bearish-ExtremeBullish-ExtremeBearish
NET POSITION MOVEMENT INDEX:
– 6-Week Change in Strength Index:-17.715.56.4


Nasdaq Mini Futures:

Nasdaq Mini Futures COT ChartThe Nasdaq Mini large speculator standing this week recorded a net position of -48 contracts in the data reported through Tuesday. This was a weekly fall of -3,533 contracts from the previous week which had a total of 3,485 net contracts.

This week’s current strength score (the trader positioning range over the past three years, measured from 0 to 100) shows the speculators are currently Bullish with a score of 75.0 percent. The commercials are Bearish with a score of 41.6 percent and the small traders (not shown in chart) are Bearish-Extreme with a score of 5.6 percent.

Nasdaq Mini Futures StatisticsSPECULATORSCOMMERCIALSSMALL TRADERS
– Percent of Open Interest Longs:26.560.411.6
– Percent of Open Interest Shorts:26.551.720.3
– Net Position:-4824,473-24,425
– Gross Longs:74,731170,35232,818
– Gross Shorts:74,779145,87957,243
– Long to Short Ratio:1.0 to 11.2 to 10.6 to 1
NET POSITION TREND:
– Strength Index Score (3 Year Range Pct):75.041.65.6
– Strength Index Reading (3 Year Range):BullishBearishBearish-Extreme
NET POSITION MOVEMENT INDEX:
– 6-Week Change in Strength Index:-3.95.5-3.9


Russell 2000 Mini Futures:

Russell 2000 Mini Futures COT ChartThe Russell 2000 Mini large speculator standing this week recorded a net position of -106,061 contracts in the data reported through Tuesday. This was a weekly advance of 777 contracts from the previous week which had a total of -106,838 net contracts.

This week’s current strength score (the trader positioning range over the past three years, measured from 0 to 100) shows the speculators are currently Bearish-Extreme with a score of 7.8 percent. The commercials are Bullish-Extreme with a score of 91.3 percent and the small traders (not shown in chart) are Bearish with a score of 23.5 percent.

Russell 2000 Mini Futures StatisticsSPECULATORSCOMMERCIALSSMALL TRADERS
– Percent of Open Interest Longs:7.987.33.8
– Percent of Open Interest Shorts:27.267.84.0
– Net Position:-106,061107,336-1,275
– Gross Longs:43,291479,62220,778
– Gross Shorts:149,352372,28622,053
– Long to Short Ratio:0.3 to 11.3 to 10.9 to 1
NET POSITION TREND:
– Strength Index Score (3 Year Range Pct):7.891.323.5
– Strength Index Reading (3 Year Range):Bearish-ExtremeBullish-ExtremeBearish
NET POSITION MOVEMENT INDEX:
– 6-Week Change in Strength Index:5.8-5.71.9


Nikkei Stock Average (USD) Futures:

Nikkei Stock Average (USD) Futures COT ChartThe Nikkei Stock Average (USD) large speculator standing this week recorded a net position of 1,520 contracts in the data reported through Tuesday. This was a weekly gain of 6,161 contracts from the previous week which had a total of -4,641 net contracts.

This week’s current strength score (the trader positioning range over the past three years, measured from 0 to 100) shows the speculators are currently Bullish-Extreme with a score of 84.7 percent. The commercials are Bearish with a score of 21.9 percent and the small traders (not shown in chart) are Bearish with a score of 28.6 percent.

Nikkei Stock Average Futures StatisticsSPECULATORSCOMMERCIALSSMALL TRADERS
– Percent of Open Interest Longs:34.546.718.6
– Percent of Open Interest Shorts:23.757.618.4
– Net Position:1,520-1,54121
– Gross Longs:4,8606,5692,611
– Gross Shorts:3,3408,1102,590
– Long to Short Ratio:1.5 to 10.8 to 11.0 to 1
NET POSITION TREND:
– Strength Index Score (3 Year Range Pct):84.721.928.6
– Strength Index Reading (3 Year Range):Bullish-ExtremeBearishBearish
NET POSITION MOVEMENT INDEX:
– 6-Week Change in Strength Index:22.1-24.53.0


MSCI EAFE Mini Futures:

MSCI EAFE Mini Futures COT ChartThe MSCI EAFE Mini large speculator standing this week recorded a net position of -11,275 contracts in the data reported through Tuesday. This was a weekly lift of 4,434 contracts from the previous week which had a total of -15,709 net contracts.

This week’s current strength score (the trader positioning range over the past three years, measured from 0 to 100) shows the speculators are currently Bearish with a score of 27.3 percent. The commercials are Bullish with a score of 74.5 percent and the small traders (not shown in chart) are Bearish with a score of 29.0 percent.

MSCI EAFE Mini Futures StatisticsSPECULATORSCOMMERCIALSSMALL TRADERS
– Percent of Open Interest Longs:5.092.22.1
– Percent of Open Interest Shorts:7.989.61.8
– Net Position:-11,27510,1181,157
– Gross Longs:19,991365,7418,306
– Gross Shorts:31,266355,6237,149
– Long to Short Ratio:0.6 to 11.0 to 11.2 to 1
NET POSITION TREND:
– Strength Index Score (3 Year Range Pct):27.374.529.0
– Strength Index Reading (3 Year Range):BearishBullishBearish
NET POSITION MOVEMENT INDEX:
– 6-Week Change in Strength Index:27.3-25.5-10.0


Article By InvestMacroReceive our weekly COT Newsletter

*COT Report: The COT data, released weekly to the public each Friday, is updated through the most recent Tuesday (data is 3 days old) and shows a quick view of how large speculators or non-commercials (for-profit traders) were positioned in the futures markets.

The CFTC categorizes trader positions according to commercial hedgers (traders who use futures contracts for hedging as part of the business), non-commercials (large traders who speculate to realize trading profits) and nonreportable traders (usually small traders/speculators) as well as their open interest (contracts open in the market at time of reporting). See CFTC criteria here.

Weekly Energy COT Speculator Bets led by Natural Gas & Bloomberg Commodity Index

By InvestMacro

Here are the latest charts and statistics for the Commitment of Traders (COT) data published by the Commodities Futures Trading Commission (CFTC).

The latest COT data is updated through Tuesday September 27th and shows a quick view of how large traders (for-profit speculators and commercial hedgers) were positioned in the futures markets.

Weekly Speculator Changes led by Natural Gas and Bloomberg Commodity Index

The COT energy market speculator bets were lower this week as two out of the six energy markets we cover had higher positioning this week while the other four markets had lower contracts.

Leading the gains for energy markets was Natural Gas (3,587 contracts) with the Bloomberg Commodity Index (2,703 contracts) also showing a positive week.

The energy markets leading the declines in speculator bets this week was WTI Crude Oil (-13,798 contracts) with Brent Crude Oil (-3,354 contracts), Gasoline (-3,013 contracts) and Heating Oil (-2,683 contracts) also recording lower bets on the week.


Data Snapshot of Commodity Market Traders | Columns Legend
Sep-27-2022OIOI-IndexSpec-NetSpec-IndexCom-NetCOM-IndexSmalls-NetSmalls-Index
WTI Crude1,504,9913226,0804-246,8729820,79235
Gold457,061152,0810-62,13810010,0571
Silver129,000075815-6,860896,1020
Copper173,66113-27,7561628,88486-1,12819
Palladium6,0801-831181,23682-40520
Platinum58,994201619-2,525932,3640
Natural Gas943,2410-152,12433121,1356930,98954
Brent167,44414-41,2574240,4906176720
Heating Oil290,2653111,41459-21,6254810,21134
Soybeans699,3112780,05138-50,20671-29,84521
Corn1,347,27811296,62268-229,43639-67,1864
Coffee185,149144,68077-46,664271,98418
Sugar710,887248,60147-56,409577,80818
Wheat290,77122,735234,67566-7,41072


Strength Scores

Strength Scores (a normalized measure of Speculator positions over a 3-Year range, from 0 to 100 where above 80 is extreme bullish and below 20 is extreme bearish) showed that the Bloomberg Commodity Index (78.4 percent) and Heating Oil (59.2 percent) lead the energy markets currently. These are the only two markets that have scores above 50 percent or above the midpoint of the 3-year range.

On the downside, the WTI Crude Oil (4.1 percent) comes in at the lowest strength level and is followed by Gasoline at 16.1 percent. Both of these markets are currently in bearish extreme positions with scores below 20 percent.


Strength Statistics:
WTI Crude Oil (4.1 percent) vs WTI Crude Oil previous week (7.7 percent)
Brent Crude Oil (41.9 percent) vs Brent Crude Oil previous week (47.6 percent)
Natural Gas (32.9 percent) vs Natural Gas previous week (31.8 percent)
Gasoline (16.1 percent) vs Gasoline previous week (19.1 percent)
Heating Oil (59.2 percent) vs Heating Oil previous week (63.2 percent)
Bloomberg Commodity Index (78.4 percent) vs Bloomberg Commodity Index previous week (68.0 percent)

Strength Trends

Strength Score Trends (or move index, calculates the 6-week changes in strength scores) showed that the Bloomberg Commodity Index (20.2 percent) leads the past six weeks trends for energy this week. The only other positive mover in the latest trends data was WTI Crude Oil at 2.9 percent.

Heating Oil (-19.9 percent) leads the downside trend scores currently while the next market with lower trend scores was Natural Gas (-9.4 percent) followed by Brent Crude Oil (-8.8 percent).

Strength Trend Statistics:
WTI Crude Oil (2.9 percent) vs WTI Crude Oil previous week (7.7 percent)
Brent Crude Oil (-8.8 percent) vs Brent Crude Oil previous week (-6.2 percent)
Natural Gas (-9.4 percent) vs Natural Gas previous week (-9.1 percent)
Gasoline (-3.6 percent) vs Gasoline previous week (1.6 percent)
Heating Oil (-19.9 percent) vs Heating Oil previous week (-15.3 percent)
Bloomberg Commodity Index (20.2 percent) vs Bloomberg Commodity Index previous week (8.9 percent)


Individual COT Market Charts:

WTI Crude Oil Futures:

WTI Crude Oil Futures COT ChartThe WTI Crude Oil Futures large speculator standing this week reached a net position of 226,080 contracts in the data reported through Tuesday. This was a weekly fall of -13,798 contracts from the previous week which had a total of 239,878 net contracts.

This week’s current strength score (the trader positioning range over the past three years, measured from 0 to 100) shows the speculators are currently Bearish-Extreme with a score of 4.1 percent. The commercials are Bullish-Extreme with a score of 97.6 percent and the small traders (not shown in chart) are Bearish with a score of 34.7 percent.

WTI Crude Oil Futures StatisticsSPECULATORSCOMMERCIALSSMALL TRADERS
– Percent of Open Interest Longs:22.239.85.0
– Percent of Open Interest Shorts:7.256.23.6
– Net Position:226,080-246,87220,792
– Gross Longs:333,933598,42875,054
– Gross Shorts:107,853845,30054,262
– Long to Short Ratio:3.1 to 10.7 to 11.4 to 1
NET POSITION TREND:
– Strength Index Score (3 Year Range Pct):4.197.634.7
– Strength Index Reading (3 Year Range):Bearish-ExtremeBullish-ExtremeBearish
NET POSITION MOVEMENT INDEX:
– 6-Week Change in Strength Index:2.9-2.0-5.9


Brent Crude Oil Futures:

Brent Last Day Crude Oil Futures COT ChartThe Brent Crude Oil Futures large speculator standing this week reached a net position of -41,257 contracts in the data reported through Tuesday. This was a weekly decline of -3,354 contracts from the previous week which had a total of -37,903 net contracts.

This week’s current strength score (the trader positioning range over the past three years, measured from 0 to 100) shows the speculators are currently Bearish with a score of 41.9 percent. The commercials are Bullish with a score of 60.6 percent and the small traders (not shown in chart) are Bearish-Extreme with a score of 19.6 percent.

Brent Crude Oil Futures StatisticsSPECULATORSCOMMERCIALSSMALL TRADERS
– Percent of Open Interest Longs:15.353.24.3
– Percent of Open Interest Shorts:40.029.03.9
– Net Position:-41,25740,490767
– Gross Longs:25,69689,1277,236
– Gross Shorts:66,95348,6376,469
– Long to Short Ratio:0.4 to 11.8 to 11.1 to 1
NET POSITION TREND:
– Strength Index Score (3 Year Range Pct):41.960.619.6
– Strength Index Reading (3 Year Range):BearishBullishBearish-Extreme
NET POSITION MOVEMENT INDEX:
– 6-Week Change in Strength Index:-8.810.3-12.9


Natural Gas Futures:

Natural Gas Futures COT ChartThe Natural Gas Futures large speculator standing this week reached a net position of -152,124 contracts in the data reported through Tuesday. This was a weekly lift of 3,587 contracts from the previous week which had a total of -155,711 net contracts.

This week’s current strength score (the trader positioning range over the past three years, measured from 0 to 100) shows the speculators are currently Bearish with a score of 32.9 percent. The commercials are Bullish with a score of 69.1 percent and the small traders (not shown in chart) are Bullish with a score of 53.6 percent.

Natural Gas Futures StatisticsSPECULATORSCOMMERCIALSSMALL TRADERS
– Percent of Open Interest Longs:15.143.36.5
– Percent of Open Interest Shorts:31.230.53.2
– Net Position:-152,124121,13530,989
– Gross Longs:142,021408,87161,287
– Gross Shorts:294,145287,73630,298
– Long to Short Ratio:0.5 to 11.4 to 12.0 to 1
NET POSITION TREND:
– Strength Index Score (3 Year Range Pct):32.969.153.6
– Strength Index Reading (3 Year Range):BearishBullishBullish
NET POSITION MOVEMENT INDEX:
– 6-Week Change in Strength Index:-9.412.1-16.6


Gasoline Blendstock Futures:

RBOB Gasoline Energy Futures COT ChartThe Gasoline Blendstock Futures large speculator standing this week reached a net position of 44,060 contracts in the data reported through Tuesday. This was a weekly lowering of -3,013 contracts from the previous week which had a total of 47,073 net contracts.

This week’s current strength score (the trader positioning range over the past three years, measured from 0 to 100) shows the speculators are currently Bearish-Extreme with a score of 16.1 percent. The commercials are Bullish-Extreme with a score of 86.4 percent and the small traders (not shown in chart) are Bearish with a score of 31.7 percent.

Nasdaq Mini Futures StatisticsSPECULATORSCOMMERCIALSSMALL TRADERS
– Percent of Open Interest Longs:32.946.87.6
– Percent of Open Interest Shorts:14.566.46.4
– Net Position:44,060-46,9042,844
– Gross Longs:78,843111,94718,200
– Gross Shorts:34,783158,85115,356
– Long to Short Ratio:2.3 to 10.7 to 11.2 to 1
NET POSITION TREND:
– Strength Index Score (3 Year Range Pct):16.186.431.7
– Strength Index Reading (3 Year Range):Bearish-ExtremeBullish-ExtremeBearish
NET POSITION MOVEMENT INDEX:
– 6-Week Change in Strength Index:-3.65.5-14.1


#2 Heating Oil NY-Harbor Futures:

NY Harbor Heating Oil Energy Futures COT ChartThe #2 Heating Oil NY-Harbor Futures large speculator standing this week reached a net position of 11,414 contracts in the data reported through Tuesday. This was a weekly decline of -2,683 contracts from the previous week which had a total of 14,097 net contracts.

This week’s current strength score (the trader positioning range over the past three years, measured from 0 to 100) shows the speculators are currently Bullish with a score of 59.2 percent. The commercials are Bearish with a score of 48.2 percent and the small traders (not shown in chart) are Bearish with a score of 33.7 percent.

Heating Oil Futures StatisticsSPECULATORSCOMMERCIALSSMALL TRADERS
– Percent of Open Interest Longs:13.653.313.2
– Percent of Open Interest Shorts:9.760.89.7
– Net Position:11,414-21,62510,211
– Gross Longs:39,591154,77838,397
– Gross Shorts:28,177176,40328,186
– Long to Short Ratio:1.4 to 10.9 to 11.4 to 1
NET POSITION TREND:
– Strength Index Score (3 Year Range Pct):59.248.233.7
– Strength Index Reading (3 Year Range):BullishBearishBearish
NET POSITION MOVEMENT INDEX:
– 6-Week Change in Strength Index:-19.919.6-16.9


Bloomberg Commodity Index Futures:

Bloomberg Commodity Index Futures COT ChartThe Bloomberg Commodity Index Futures large speculator standing this week reached a net position of -7,614 contracts in the data reported through Tuesday. This was a weekly gain of 2,703 contracts from the previous week which had a total of -10,317 net contracts.

This week’s current strength score (the trader positioning range over the past three years, measured from 0 to 100) shows the speculators are currently Bullish with a score of 78.4 percent. The commercials are Bearish with a score of 21.9 percent and the small traders (not shown in chart) are Bearish-Extreme with a score of 16.1 percent.

Bloomberg Index Futures StatisticsSPECULATORSCOMMERCIALSSMALL TRADERS
– Percent of Open Interest Longs:24.074.10.4
– Percent of Open Interest Shorts:36.461.90.2
– Net Position:-7,6147,445169
– Gross Longs:14,65245,267271
– Gross Shorts:22,26637,822102
– Long to Short Ratio:0.7 to 11.2 to 12.7 to 1
NET POSITION TREND:
– Strength Index Score (3 Year Range Pct):78.421.916.1
– Strength Index Reading (3 Year Range):BullishBearishBearish-Extreme
NET POSITION MOVEMENT INDEX:
– 6-Week Change in Strength Index:20.2-19.8-4.9


Article By InvestMacroReceive our weekly COT Newsletter

*COT Report: The COT data, released weekly to the public each Friday, is updated through the most recent Tuesday (data is 3 days old) and shows a quick view of how large speculators or non-commercials (for-profit traders) were positioned in the futures markets.

The CFTC categorizes trader positions according to commercial hedgers (traders who use futures contracts for hedging as part of the business), non-commercials (large traders who speculate to realize trading profits) and nonreportable traders (usually small traders/speculators) as well as their open interest (contracts open in the market at time of reporting). See CFTC criteria here.


Bank of England bonds rescue has two ugly implications: more inflation and an even weaker pound

By Costas Milas, University of Liverpool 

With UK government bonds and sterling both falling hard in recent days, the Bank of England has been forced to step in. Only a few months after it started tightening monetary policy to fight inflation by raising benchmark interest rates and ending its programme to “create” money through quantitative easing (QE), it has made a U-turn.

It plans to create perhaps £65 billion over a two-week period to buy long-dated government bonds to shore up that market, as well as temporarily putting on hold plans to start unwinding its £838 billion of QE money. So will this work?

The specific reason for the intervention appears to be UK pension funds, which suddenly became very vulnerable because of the bonds plunge. This was because pension funds rely on financial schemes known as liability-driven investment strategies or LDIs.

LDIs are essentially an insurance policy to ensure that funds have enough money to pay people’s pensions, even when bonds are paying very low returns. But when bond prices plunged after the government’s mini-budget, funds were forced to find extra money to cover their LDIs. This forced them to sell more bonds and threatened a domino effect where bond prices would keep falling and some funds could have collapsed.

The bank’s intervention has important implications for the wider economy. It comes when people are under increased financial stress because of higher interest rates, climbing energy bills, wages not keeping up with inflation and volatility in the financial markets.

The economy is growing only weakly and may well tip into recession. According to my recent co-authored work, a recession could depress the UK economy for as many as 20 months – longer than the 15 months predicted by the Bank of England.

Stress in the UK markets

Chart measuring UK financial stress
This chart measures the volatility in the shares, bond and currency markets.
ECB

These conditions are likely to be an additional reason for the bank’s intervention – despite contradicting its efforts at tightening. Since the interest rates (or yields) on bonds rise as their prices fall, stepping into the market to buy bonds aims to push down these rates.

So far it has worked: yields on UK 20-year and 30-year bonds were both north of 5% before the intervention and are now respectively 4.1% and 3.9%. Since the level of these yields sets the tone for borrowing costs in the rest of the economy, this should encourage more consumer spending and business investment.

Yields on 20-year and 30-year UK bonds

Chart showing yields on long-dated uk gilts
Yellow = 30-year and blue = 20-year.
TradingView

The downsides

The bank’s intervention, without even consulting its Monetary Policy Committee (MPC), is a form of what is known as yield curve control. This is a variety of QE in which, instead of just creating a certain amount of money with which to buy bonds, the central bank wants to achieve a specific yield. Such a policy is mainly associated with Japan, where the central bank has been buying bonds to keep yields at very low levels since 2016.

So far the Bank of Japan has achieved its objective, but the yen has lost a lot of value because the bank is having to create more and more money via QE: it now owns some US$3.8 trillion (£3.4 trillion) of Japanese government bonds, over half the total market. Meanwhile, the yen has virtually halved since 2010, and in recent weeks the Bank of Japan had to act to prop it up.

While Japan and the UK’s moves to control bond yields are somewhat different, the Bank of England intervention is also likely to put additional downward pressure on sterling. It is also going to be inflationary. This shows how unappealing the policy options are at present.

The implications

Will the intervention work? The impact of QE on interest rates is the subject of voluminous research. It is difficult to estimate because it depends on the level of the interest rate, as well as the economic conditions. Things are complicated further because central bank studies find QE to be more effective than academic papers do.

But going roughly by the findings in this co-authored paper of mine, an additional £50 billion of QE purchases in the UK might lower bond yields by 12 basis points (0.12 percentage points). That suggests that unless the bank continues with this new scheme far beyond the current October 14 end date, it is unlikely to have much effect.

Moreover, QE partly works by signalling to the markets that it will keep interest rates low for a protracted period. By setting a time limit and also saying that it plans to return to QT in due course, the bank is undermining its new policy.

Also, the credit ratings agencies may well downgrade UK sovereign debt. They usually reduce a country’s credit score when economic policy uncertainty rises significantly, or debt rises to unsustainable levels, or the quality of governance is on the slide.

We’re certainly seeing a big rise in uncertainty. At the same time, the latest World Bank data reveals that in terms of government effectiveness, the UK is down from the top 7% of countries to the top 13% over five years. What remains to be seen is how UK debt will rise, since we currently don’t have official forecasts following the mini-budget.

With no such estimates due to be published until November 23, not to mention the Bank of England’s failure to consult the MPC, the credit ratings agencies will be seriously tempted to downgrade. Such a move would push UK bond yields upwards again, therefore undermining the bank’s intervention.

It’s worth bearing in mind that the main source of the current instability remains the government’s mini-budget and unfunded tax cuts. This is what undermined investor confidence and caused the sell-offs of UK bonds and sterling in the first place, so the best way to reverse this is to tackle the problem at source by the government modifying its plans.

Having said that, such a U-turn would also leave investors very uneasy about economic management. One way or the other, a rocky economic road looks likely until at least the next general election.The Conversation

About the Author:

Costas Milas, Professor of Finance, University of Liverpool

This article is republished from The Conversation under a Creative Commons license. Read the original article.


Why IMF comments on the UK economy spooked traders and investors

By Bernhard Reinsberg, University of Glasgow and Andreas Kern, Georgetown University 

Everyone from political pundits to people on the street have issued forth on the new UK government’s tax cut-laden growth plan recently. But it was a rare public rebuke from the International Monetary Fund (IMF) that really impacted financial markets.

Days after the government made its mini-budget announcement, the IMF warned that “large and untargeted fiscal packages” could work at “cross purposes” to monetary policy, referring to current efforts by central banks around the world to fight rampant inflation. It also suggested the government should reevaluate its tax measures and provide more targeted energy crisis support at its next budget, currently scheduled for November 23.

Investors responded by beating an even hastier exit from government bond markets and sending the pound plummeting. Within hours of the IMF statement, the Bank of England had announced a plan to try to calm the markets.

The IMF’s decision to comment on UK tax policy was significant and clearly had an impact on traders and investors. And while the uninitiated may be blissfully unaware of the IMF’s existence, it has played a key role in supporting economies in trouble since the middle of the last century.

Upholding global financial stability

The IMF was established in 1944 at the Bretton Woods Conference, which sought to stabilise global finances after the second world war. Based in Washington D.C., it is an international organisation with 190 member states – from Afghanistan to the UK and US, right through to Zimbabwe.

Its mandate is to uphold international financial stability, which it tries to do by monitoring global macroeconomic developments and providing governments with advice and training on economic policy management.

Most importantly, perhaps, the IMF frequently acts as a “lender of last resort” for its members. This means it provides countries in dire financial straits with much-needed money in the form of loans.

In return, these countries must agree to certain austerity measures. Depending on the situation, this can include tax hikes and drastic spending cuts, alongside other substantial economic reforms.

In the last few years, governments in Ecuador and Pakistan, among others, have hiked interest rates, cut back on public spending programmes, and reduced subsidies on household essentials such as fuel and food to meet the IMF’s performance criteria. As a result, the IMF has become one of the world’s most controversial organisations.

Since the performance criteria it uses are based on the IMF’s worldview, the question of whether its advice is adequate, proportionate, and effective is often subject to debate.

For IMF advocates, the sometimes draconian measures it mandates are necessary to restore investor confidence, boost economic growth and help countries become more competitive in the long run. As such, the IMF can work like a seal of approval for a country’s policy plans, helping governments to shore up international confidence in their economies.

To its critics, the IMF has used its policy leverage to advance reforms that have increased poverty and inequality, leaving countries with deep social and political scars for years after accepting its help. For example, during the Ebola crisis in 2014-15, the IMF was criticised for contributing to underfunded health systems that prevented effective government responses to the epidemic.

Moving markets

Regardless, as the recent case of the UK shows, an IMF verdict on government policy proposals can significantly affect financial markets. For countries with immediate financing needs – typically developing economies – restoring investor confidence with an IMF intervention can be critical to the successful resolution of financial crises.

But the IMF has also used its “magic shield” to rescue UK governments from global financial woes in the past. In fact, since the Fund’s creation, the UK has called upon the IMF 11 times.

Its last IMF rescue happened in 1976 when stagflation and political stalemate forced the UK government to ask for a loan to halt speculative pressures on the British pound. The IMF provided not only financial relief, but also stability to a newly elected British administration by helping to calm market nerves about the UK economy.

This time, the IMF offered up its thoughts on the current economic situation in Britain, rather than being invited to intervene. But instead of curbing speculation about the UK’s financial viability, the statement had the opposite effect: markets panicked.

Mortgage lenders continued to pull their offerings and investors kept unloading government bonds, forcing up yields and the cost of government borrowing. Add the plummeting British pound in the mix and the current situation is in danger of becoming a textbook financial crisis.

But the IMF’s assessment is in line with international experts and ratings agencies in doubting that tax cuts will help reignite UK economic growth. Instead, it argues that the cuts will further expand the budget deficit.

Without a sound fiscal plan, this will increase the need for new government debt. At a time of rampant inflation, deteriorating global economic conditions and rising interest rates – which affect the cost of financing for the government – such debts may become unsustainable for the UK.

Taking into account the reaction of market participants to the IMF’s statement, and that the Bank of England felt the need to intervene in the bond market afterwards, the IMF assessment seems to have carried weight.

Certainly, the UK in debt distress is the last thing the world needs. Many governments in developing and emerging markets are struggling to keep their own economies afloat right now while awaiting financial relief from western banks and the IMF.

But the UK’s central position in global financial markets means any panic in the City of London can spread quickly to global financial markets. From this perspective, the IMF’s recent comments about the UK can be seen an attempt to prevent the world from slipping further into a winter of despair.The Conversation

About the Author:

Bernhard Reinsberg, Reader in Politics, University of Glasgow and Andreas Kern, Associate Teaching Professor, McCourt School of Public Policy, Georgetown University

This article is republished from The Conversation under a Creative Commons license. Read the original article.


Japanese Candlesticks Analysis 30.09.2022 (USDCAD, AUDUSD, USDCHF)

Article By RoboForex.com

USDCAD, “US Dollar vs Canadian Dollar”

As we can see in the H4 chart, after forming an Engulfing reversal pattern close to the support level, USDCAD is reversing in the form of a new ascending wave. In this case, the upside target may be at 1.3900. Later, the market may break the resistance area and continue growing. However, an alternative scenario implies that the asset may correct to reach 1.3600 first and then resume the uptrend.

USDCAD
Risk Warning: the result of previous trading operations do not guarantee the same results in the future

AUDUSD, “Australian Dollar vs US Dollar”

As we can see in the H4 chart, AUDUSD has formed a Hammer reversal pattern near the support area. At the moment, the asset is reversing in the form of a new correctional impulse. In this case, the upside correctional target may be the resistance level at 0.6550. After testing the level, the price may rebound from it and resume the descending tendency. At the same time, the opposite scenario implies that the price may fall to reach 0.6365 and continue the downtrend without any pullbacks up to resistance level.

AUDUSD
Risk Warning: the result of previous trading operations do not guarantee the same results in the future

USDCHF, “US Dollar vs Swiss Franc”

As we can see in the H4 chart, the pair has formed a Hammer reversal pattern not far from the support area. At the moment, USDCHF may reverse in the form of a new ascending wave. In this case, the upside target may be the resistance level at 0.9860. After testing this level, the price may break it and continue trading upwards. Still, there might be an alternative scenario, in which the asset may correct to reach 0.9680 first and then resume the ascending tendency.

USDCHF

Article By RoboForex.com

Attention!
Forecasts presented in this section only reflect the author’s private opinion and should not be considered as guidance for trading. RoboForex LP bears no responsibility for trading results based on trading recommendations described in these analytical reviews.

Murrey Math Lines 30.09.2022 (Brent, S&P 500)

Article By RoboForex.com

BRENT

As we can see in the H4 chart, Brent is trading below the 200-day Moving Average it to indicate a possible descending tendency. The Relative Strength Index has broken the ascending trendline to the downside. In this case, the pair is expected to break 4/8 (87.50) and continue falling towards the support at 2/8 (81.20). However, this scenario may be cancelled if the price breaks the resistance at 5/8 (90.62) to the upside. After that, the instrument may move upwards to reach 6/8 (93.75)./p>

BRENTH4
Risk Warning: the result of previous trading operations do not guarantee the same results in the future

In the M15 chart, the pair may break the downside line of the VoltyChannel indicator and, as a result, continue its decline.

BRENT_M15
Risk Warning: the result of previous trading operations do not guarantee the same results in the future

S&P 500

As we can see in the H4 chart, the S&P 500 index is trading inside the “oversold area”. The Relative Strength Index is testing 30, confirming that the asset is oversold. In this case, the price is expected to break 0/8 (3750.0) and continue moving upwards to reach the resistance at 1/8 (3906.2). However, this scenario may no longer be valid if the price breaks the support at -1/8 (3593.8) to the downside. After that, the instrument may continue to fall towards -2/8 (3437.5).

S&P 500_H4
Risk Warning: the result of previous trading operations do not guarantee the same results in the future

In the M15 chart, the pair may break the upside line of the VoltyChannel indicator and, as a result, continue trading upwards.

S&P 500_M15

Article By RoboForex.com

Attention!
Forecasts presented in this section only reflect the author’s private opinion and should not be considered as guidance for trading. RoboForex LP bears no responsibility for trading results based on trading recommendations described in these analytical reviews.

The Analytical Overview of the Main Currency Pairs on 2022.09.30

By JustForex

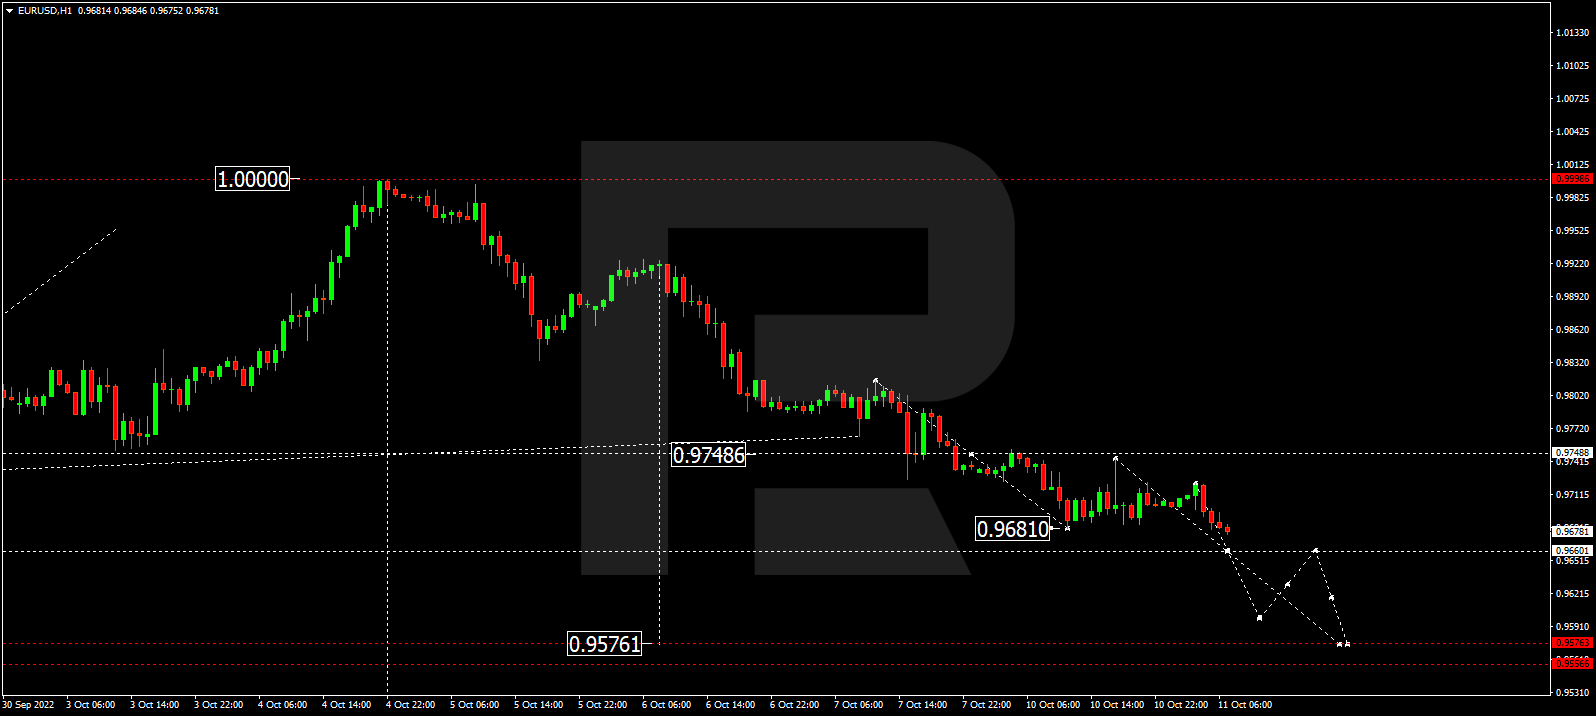
The EUR/USD currency pair

Technical indicators of the currency pair:
  • Prev Open: 0.9737
  • Prev Close: 0.9814
  • % chg. over the last day: +1.48 %

Four European Central Bank officials on Thursday supported another significant interest rate hike, with arguments in favor of a 75 basis point interest rate hike in October. Inflation data showed yesterday that German consumer prices reached their highest level in decades. On an annualized basis, the inflation rate reached 10%, up from 7.4% in the previous month. In Spain, on the other hand, the numbers were more positive. Spain’s annual inflation rate declined from 10.5% to 9.0%. Inflation data will be released today in France, Italy, and the Eurozone. Analysts expect consumer prices in Europe to rise from 9.1% to 9.7% on an annualized basis.

Trading recommendations
  • Support levels: 0.9666, 0.9601
  • Resistance levels: 0.9808, 0.9865, 0.9949, 1.0111, 1.0162, 1.0230

From the technical point of view, the trend on the EUR/USD currency pair on the hourly time frame is bearish, but the price has approached the priority change level. The MACD indicator is in the positive area, and the buyers’ pressure remains. It is better to look for sell deals from the resistance level of 0.9808 or 0.9865. Buy trades can be considered from the support level of 0.9666 or 0.9601, but only with confirmation.

Alternative scenario: if the price breaks out through the resistance level of 0.9808 and fixes above it, the uptrend will likely resume.

EUR/USD
News feed for 2022.09.30:
  • – Eurozone German Retail Sales (m/m) at 09:00 (GMT+3);
  • – Eurozone French CPI (m/m) at 09:45 (GMT+3);
  • – Eurozone German Unemployment Rate (m/m) at 10:55 (GMT+3);
  • – Eurozone Italian CPI (m/m) at 12:00 (GMT+3);
  • – Eurozone CPI (m/m) at 12:00 (GMT+3);
  • – Eurozone Unemployment Rate (m/m) at 12:00 (GMT+3);
  • – US PCE Price index (m/m) at 15:30 (GMT+3);
  • – US FOMC Member Brainard Speaks at 16:00 (GMT+3);
  • – US Chicago PMI (m/m) at 16:45 (GMT+3);
  • – US Michigan Consumer Sentiment (m/m) at 17:00 (GMT+3);
  • – US FOMC Member Bowman Speaks at 18:00 (GMT+3);
  • – US FOMC Member Williams Speaks at 23:15 (GMT+3).

The GBP/USD currency pair

Technical indicators of the currency pair:
  • Prev Open: 1.0876
  • Prev Close: 1.1109
  • % chg. over the last day: +2.14 %

The British pound rose for the third day after the Bank of England bought bonds. The Bank of England spent the second-day buying bonds to stabilize financial markets. The Bank of England bought 1.415 billion pounds ($1.55 billion) of British government bonds with maturities of more than 20 years on Thursday, the second day of a multibillion-dollar program aimed at stabilizing the market. But analysts are confident that the rise in sterling due to the Bank of England’s actions is not sustainable.

Trading recommendations
  • Support levels: 1.0918, 1.0711, 1.03
  • Resistance levels: 1.1210, 1.1449, 1.1626, 1.1693, 1.1816, 1.1901

From the technical point of view, the trend on the GBP/USD currency pair on the hour time frame is bearish. At the moment, the pound is strengthening due to the actions of the Bank of England. The MACD indicator remains positive, indicating a predominance of buyers. In such market conditions, sell deals are better to look for on the intraday time frames. The nearest resistance level is 1.1210, the level of the priority change. Buy trades can be considered from the support level of 1.0918 or 1.0711, but only with confirmation and short targets.

Alternative scenario: if the price breaks out of the 1.1210 resistance level and fixes above it, the uptrend will likely resume.

GBP/USD
News feed for 2022.09.30:
  • – UK GDP (q/q) at 09:00 (GMT+3).

The USD/JPY currency pair

Technical indicators of the currency pair:
  • Prev Open: 144.02
  • Prev Close: 144.41
  • % chg. over the last day: +0.27 %

Finance Minister Shun’ichi Suzuki said Thursday that Japan’s recent currency intervention was to correct market distortions caused by speculative currency movements. He also clarified that the Ministry of Finance is ready to intervene again if necessary. Thus, there is no point in expecting a significant movement in the currency pair USD/JPY, as the price has two opposing forces. Where on the one hand, the difference in policy between the US Federal Reserve and the Bank of Japan is pushing quotes up, and on the other hand, the Ministry of Finance of Japan is defending the depreciation of the yen.

Trading recommendations
  • Support levels: 143.00, 140.60, 139.61, 138.78, 137.65, 136.80, 135.20
  • Resistance levels: 144.77, 145.35

From the technical point of view, the medium-term trend on the currency pair USD/JPY is bullish despite last week’s intervention. The MACD indicator has become inactive, and there is slight selling pressure. The price has formed the “Head and Shoulders” pattern, which indicates a possible downward movement. Under such market conditions, buy trades can be searched for on intraday timeframes from the support level of 143, but with confirmation. Sell deals can be searched from the resistance level of 144.77, but only with additional confirmation.

Alternative scenario: If the price fixes below 140.60, the downtrend will likely resume.

USD/JPY
News feed for 2022.09.30:
  • – Japan Industrial Production (m/m) at 02:30 (GMT+3);
  • – Japan Unemployment Rate (m/m) at 02:50 (GMT+3);
  • – Japan Retail Sales (m/m) at 02:50 (GMT+3);
  • – Japan Consumer Confidence (m/m) at 08:00 (GMT+3).

The USD/CAD currency pair

Technical indicators of the currency pair:
  • Prev Open: 1.3602
  • Prev Close: 1.3681
  • % chg. over the last day: +0.58 %

Canada’s real Gross Domestic Product (GDP) rose by 0.1% in July. Thus, the Canadian economy is experiencing an inflation shock more steadily than the US economy. Inflation in Canada is already showing signs of slowing, allowing the Bank of Canada to be less aggressive in raising interest rates further.

Trading recommendations
  • Support levels: 1.3611, 1.3545, 1.3453, 1.3297, 1.3212, 1.3053, 1.2990, 1.2958
  • Resistance levels: 1.3755, 1.3858, 1.3968

From the point of view of technical analysis, the trend on the USD/CAD currency pair is bullish. The MACD indicator has become inactive. The price is trading at the level of the moving averages and forming a balance. Under such market conditions, buy trades should be considered on the lower time frames from the support level of 1.3611 or 1.3545. For sell deals, it is best to consider the resistance level of 1.3755, but only after additional confirmation, as the level has already been tested.

Alternative scenario: if the price breaks down and consolidates below the 1.3545 support level, the downtrend will likely resume.

USD/CAD
There is no news feed for today.

By JustForex


This article reflects a personal opinion and should not be interpreted as an investment advice, and/or offer, and/or a persistent request for carrying out financial transactions, and/or a guarantee, and/or a forecast of future events.

Nobel Prizes, election outcomes and sports championships – prediction markets try to foresee the future

By Daniel O’Leary, University of Southern California 

Who will win Nobel Prizes in 2022? Wikipedia posits a handful of contenders for Physiology or Medicine, about 20 different possible winners for the Peace Prize and several dozen potential winners of the Literature Prize. But since the Swedish Academy never announces nominees in advance, there are few insights indicating who will win, or even if the eventual winner is on a given list.

Are there ways to predict the future winners?

The Delphi approach, named after the oracle in ancient Greece, gathers multiple rounds of opinions from a group of experts to generate a prediction. Gambling firms provide betting odds on the likelihood that specific competitors will win. Crowdsourced competitions, such as the Yahoo Soccer World Cup “Pick-Em,” have participants predict individual contest winners and then aggregate the results.

Another approach is a prediction market that provides insight into what people expect will happen in the future by creating a stock market-like environment to capture the “wisdom of the crowd.” Groups and crowds often are collectively smarter than individuals when many independent opinions are combined.

As an accounting and information systems professor at the University of Southern California, I investigate issues related to the crowd both in my research and in my teaching. Here’s how prediction markets harness what the crowd thinks to forecast the future.

The wisdom of the market

In prediction markets, participants buy and sell stocks. Each stock’s price is tied to a different event happening in the future. Information about the future is captured in the stock prices.

For instance, in a prediction market focused on the Nobel Peace Prize, maybe Greta Thunberg is trading at $0.10 while Pope Francis is trading at $0.15, and the stocks for the entire group of candidates add up to sum to $1. The prices reflect the traders’ aggregated beliefs about the probability of their winning – a higher price means a higher perceived likelihood of winning.

Prediction markets have various ways of setting stock prices. The Iowa Electronic Markets took following approach during the 2020 U.S. presidential election:

  • Stock DEM2020 pays off $1 if the Democratic candidate wins, and $0 otherwise,
  • Stock REP2020 pays off $1 if the Republican candidate wins, and $0 otherwise.

The stock prices capture the probabilities of each candidate winning, in two mutually exclusive events. If the price of DEM2020 is $0.52, then that is treated as the probability of that event occurring – a 52% chance. If DEM2020 is $0.52, then REP2020 is $0.48.

Prediction markets may use real money, or they can use play money. Google’s market used what it called “Goobles,” while the Hollywood Stock Exchange uses Hollywood Dollars. The Iowa Electronic Markets and PredictIt, both sponsored by universities, use real money. Researchers have found that there are no differences in the performance of markets using real money versus those using play money.

Although using play money makes it possible for many people to participate, one potential challenge for prediction markets that don’t use real money is gaining and maintaining interested participants. Despite using different devices to keep up engagement, such as leader boards indicating who has accumulated the biggest portfolio, there is literally no money on the table to keep participants interested in the market.

Participants bring their knowledge to the market

Prediction markets and crowdsourcing do not function in a vacuum.

Researchers have found that information about events finds its way into the prediction processes from various sources. For example, when I analyzed the relationship between the betting odds and the Yahoo Pick-Em crowd’s guesses for the 2014 FIFA World Cup, I found that there was no statistical difference between the proportion of correct guesses in each. My conclusion is that either the crowd’s guesses incorporated the betting odds information or the crowd’s guesses added up to the same result by some other means.

Generally, prediction markets use play money or are run by non-profit universities to study markets, elections and human decision making. Although gambling houses can take bets for many activities, external prediction markets are more restricted in the activities they can be used to investigate, and are typically limited to elections. However, internal prediction markets – run within a corporation, for instance – can explore almost any topic of interest.

Typically, prediction markets function better with informed participants. Although using so-called inside information is illegal in some markets, including the New York Stock Exchange, there generally are no such limitations in prediction markets, or other crowdsourcing approaches. If those with inside information were to participate in a prediction market, it would likely lead to more accurate stock prices, as insiders make trades informed by their knowledge. However, if others find out that a participant has inside information, then they may very well try to gain access to that info, follow the insider’s actions or even decide to leave the unfair market.

The accuracy of prediction markets depends on many factors, including who is in the market, what their biases are and how heterogeneous the participants are. Accuracy can also depend on how many people are in the market – more is generally better – and the extent to which they are informed about the events of interest.

Researchers have found that prediction markets have outperformed polls in presidential elections roughly 75% of the time. But accurate results are not guaranteed. For example, prediction markets did not correctly predict that Donald Trump would win the U.S. presidency in 2016.

Who will be in Stockholm for the ceremony?

In 2011, Harvard University economics faculty had a real-money prediction market site, referred to as “the world’s most accurate prediction market.” The site had been used for predicting the Nobel Prize in Economics, but Harvard advised the site to shut down.

I couldn’t find any current public prediction markets active for the 2022 Nobel Prizes.

For the moment, perhaps the closest to participating in a Nobel prediction market would be to place a bet at one of the gambling houses that takes bets on the Nobel Prizes. Or find a Nobel Prize Pick-Em site, propose such an event to an existing prediction market or build your own prediction market using some of the available software.

If you know of one, let me know, I want to play.The Conversation

About the Author:

Daniel O’Leary, Professor of Accounting and Information Systems, University of Southern California

This article is republished from The Conversation under a Creative Commons license. Read the original article.

Week Ahead: Robust US jobs data to restore USD Index to 1.28?

By ForexTime

We’re about to enter the final quarter of what’s already been a tumultuous year for global financial markets.

And as it’s been for most of the year, it’s set to be yet another dollar-centric week for global markets.

Global investors and traders are awaiting the next US jobs report as well as potential policy clues by Fed officials who are scheduled to make public comments over the coming week:

Monday, October 3

  • Mainland Chinese markets closed this week
  • JPY: Japan 3Q Tankan
  • EUR: Eurozone September manufacturing PMI (final)
  • GBP: UK September manufacturing PMI (final)
  • USD: US September ISM manufacturing and manufacturing PMI (final)
  • USD: Speeches by Atlanta Fed President Raphael Bostic, New York Fed President John Williams

Tuesday, October 4

  • JPY: Tokyo September CPI
  • AUD: Reserve Bank of Australia rate decision
  • EUR: Eurozone August PPI
  • USD: Speeches by New York Fed President John Williams, Dallas Fed President Lorie Logan, Cleveland Fed President Loretta Mester, and San Francisco Fed President Mary Daly

Wednesday, October 5

  • NZD: Reserve Bank of New Zealand rate decision
  • EUR: Eurozone September services PMI (final)
  • Brent: OPEC+ meeting
  • US crude: EIA weekly oil inventory report
  • USD: Speech by Atlanta Fed President Raphael Bostic

Thursday, October 6

  • AUD: Australia August external trade
  • EUR: Eurozone August retail sales, Germany August factory orders
  • USD: US weekly initial jobless claims
  • USD: Speeches by Chicago Fed President Charles Evans, Fed Governor Lisa Cook, Cleveland Fed President Loretta Mester

Friday, October 7

  • EUR: Germany August retail sales, industrial production
  • GBP: Speech by BOE Deputy Governor Dave Ramsden
  • CAD: Canada September unemployment
  • USD: US September nonfarm payrolls, speech by New York Fed President John Williams


Recently, the equally-weighted USD index soared past 1.28, well above the 1.25 level cited in our previous Week Ahead article (posted every Friday). 1.25 also marked the early-April 2020 cycle high.

However, this dollar index then swiftly unwound gains, as it pulled away from ‘overbought’ conditions, with its 14-day relative strength index moving back below the 70 level.


The upcoming US jobs report may help determine whether this USD index can be restored to its recent peak above 1.28, or at least remain at these elevated levels.


Here are the market forecasts at present:

  • August nonfarm payrolls: 250,000 increase (median estimate)
    If so, this would be the lowest monthly jobs growth since December 2019.
  • August US unemployment rate: 3.7% (median estimate)
    If so, this would mark s slight uptick, but still hovering close to the pre-pandemic low of 3.5%.
  • 75-basis point hike by the Fed in November: 69%


If the US labour market continues to demonstrate its resilience, either by way of a higher-than-expected headline NFP figure or a lower-than-expected unemployment rate, that should ramp up market expectations for yet another 75-basis point hike by the Fed at its next policy decision due November 2nd.

Such ramped-up expectations may then restore the USD Index back up to 1.28.


Also, keep an eye on the slate of Fed officials who are scheduled to make public comments in the coming week.

Should they offer fresh signs that they’re willing to take bolder measures to quell stubbornly elevated US inflation, that may translate into more USD strength as well.

Alternatively, if market fears over an ultra-aggressive Fed further subside, that may in turn see the US dollar unwinding more of its recent gains.


Forex-Time-LogoArticle by ForexTime

ForexTime Ltd (FXTM) is an award winning international online forex broker regulated by CySEC 185/12 www.forextime.com

How bonds work and why everyone is talking about them right now: a finance expert explains

By David McMillan, University of Stirling 

– The Bank of England is buying bonds again. Just as it was about to start selling the debt it had accumulated as part of its last effort to support the economy during the COVID-19 pandemic, the central bank has been forced to announce a new scheme to shore up investor confidence.

The bank’s £65 billion short-term spree aims to address the slump in bond prices caused by investors rushing to sell after the government’s recent mini-budget. This led to a surge in bond yields that hiked borrowing costs for the government and spread to pensions, housing and the general economy. So far, it has had a limited initial impact on the markets.

We asked an expert in finance to explain what’s going on in bond markets.

What is a bond and what is the difference between bond prices and yields?

A bond is essentially a tradeable IOU. It’s a loan that investors make to issuers such as companies or governments (UK government bonds are often called gilts). A bond has a price at which it can be sold and a yield, which is an annual amount the investor receives for holding the bond, a bit like interest on a savings account, and is expressed as a percentage of the current price.

When the price of a bond falls, it signals less demand for the bond because fewer investors want to own it. At the same time, the yield rises, which represents a higher cost of borrowing for companies or governments that issued the bond because this is what they have to pay to investors.

In the days since the government’s mini-budget, yields on 10-year Treasury bonds – which are issued by the UK government – increased from approximately 3.5% to 4.52% – the highest since the 2007-2008 global financial crisis. The expectation of continued increases prompted the recent intervention by the Bank of England.

UK government 10-year bond yields

Line chart showing UK 10-year bond or gilt yields, August - September 2022
United Kingdom 10-year bond yield.
Investing.com / Tradingview

What causes bond yields to move?

To understand this, it is important to bear in mind that, while people often talk about the interest rate, there are actually a number of rates. This includes the rate at which the central bank lends to commercial banks (the base rate), the rate that banks lend to each other (the interbank rate), the rate that the government borrows at (Treasury yields) and the rate at which households and firms borrow (commercial loans and mortgages).

When the Bank of England changes the base rate, this cascades through all these rates. As such, the Bank of England carefully considers the state of the economy – that is, growth and inflation – when deciding on the base rate.

When an economy is growing, interest rates and bond yields tend to rise. The occurs for several reasons. Investors sell bonds to buy riskier assets with better returns. Firms and households also look to borrow more money in a growing economy, for example, to invest in new machinery or to move home. More demand for borrowing means lenders can charge higher interest on their loans.

Higher inflation often accompanies economic growth because of the increase in demand for goods and services. This tightens supply and causes prices to rise (including wages for labour). The Bank of England, which is mandated by the government to try to keep inflation as close to 2% as possible, will respond to higher inflation by raising base rates, which, as noted, feeds through to the different rates.

Investors will often anticipate the increase in base rates and look to act before it goes up by selling Treasury bonds and buying alternative, higher return, assets. This causes bond yields to rise further. As a result, the Treasury bond yield is often seen as a predictor of future Bank of England base rate changes.

So, if yields are rising, does this mean that investors are expecting future economic growth in the UK?

No, not at the moment. When the government raises money by issuing bonds, it does so over a range of time periods (called maturities), from one day to 30 years. When an economy is expected to grow, the yield on longer-term bonds will be higher than the yield on shorter-term bonds.

This relationship between yields across different maturities is referred to as the term structure or yield curve. An upward sloping yield curve implies a growing economy. At the moment, the UK yield curve is flat, or even downward-sloping across some maturities. My research shows that a falling yield curve is a good predictor of a coming recession.

Yield curve for UK government bonds

Line graph showing downward-sloping yield curve for UK gilts
UK gilts 40-year yield curve. *The curve on the day of the previous MPC meeting is provided as reference point.
Bloomberg Finance L.P., Tradeweb and Bank of England calculations

It’s important to remember that these different yields act as a benchmark for commercial lending rates of equivalent lengths. The approximate jump to 4.5% in 2-year and 5-year yields has been reflected in mortgage rates, which is why some lenders have pulled available mortgage deals recently while they reassess the lending rates charged to households.

But if the UK economy is not expected to perform well, why have bond yields been rising after the chancellor’s mini-budget announcement?

The rising bond yields we are seeing relate to an additional factor: the amount of government debt. The mini-budget introduced tax cuts and increased spending and investors know the government will need to increase borrowing to meet these commitments. Some estimates put potential government borrowing at £190 billion due to this plan.

An increase in the amount a homeowner borrows versus the value of their home (called the loan-to-value) causes the mortgage rate charged to the borrower to rise. Similarly, an increase in the amount of bonds that the government will be looking to sell (the amount it wants to borrow) will push down the price of existing bonds, increasing yields. More importantly, more debt without growth raises the risk level of the UK economy.

Anticipating this, investors triggered a large-scale bond sell-off after the government’s mini-budget announcement. This contributed to the fall in the value of the pound as investors selling UK Treasury bonds bought US bonds instead, essentially swapping pounds for dollars.

So will the Bank of England’s plan work?

The intervention will have a short-term positive impact, which started as soon as it was announced. But the bank is really only buying time. Any ultimate success depends on the government restoring investor confidence in its economic plans.

Unfortunately, rising yields and borrowing costs for the UK economy is the price we are now paying for the government’s recent fiscal announcement.The Conversation

About the Author:

David McMillan, Professor in Finance, University of Stirling

This article is republished from The Conversation under a Creative Commons license. Read the original article.