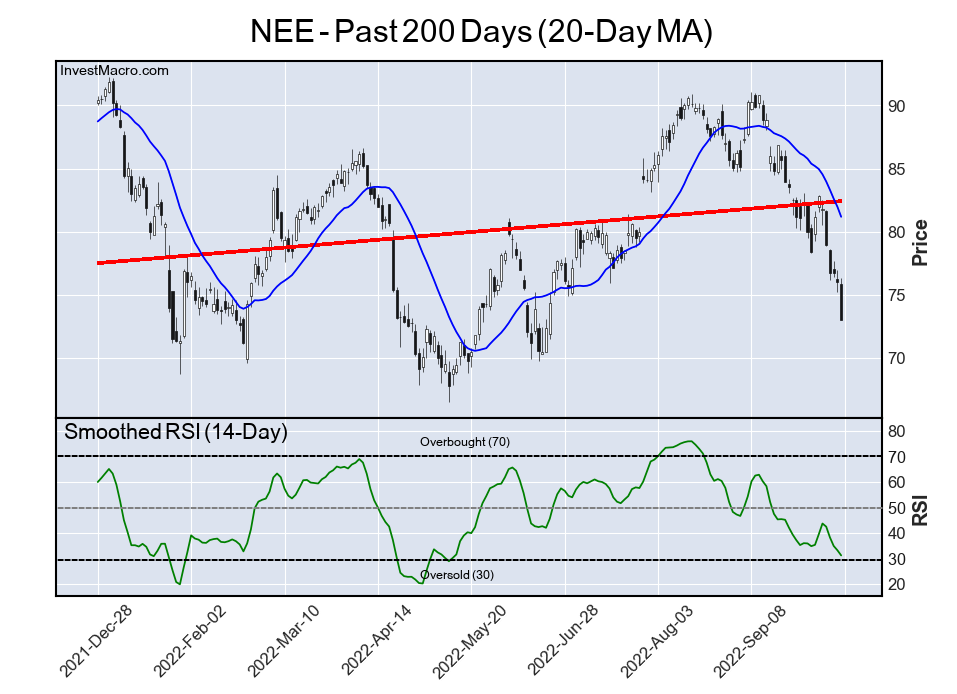
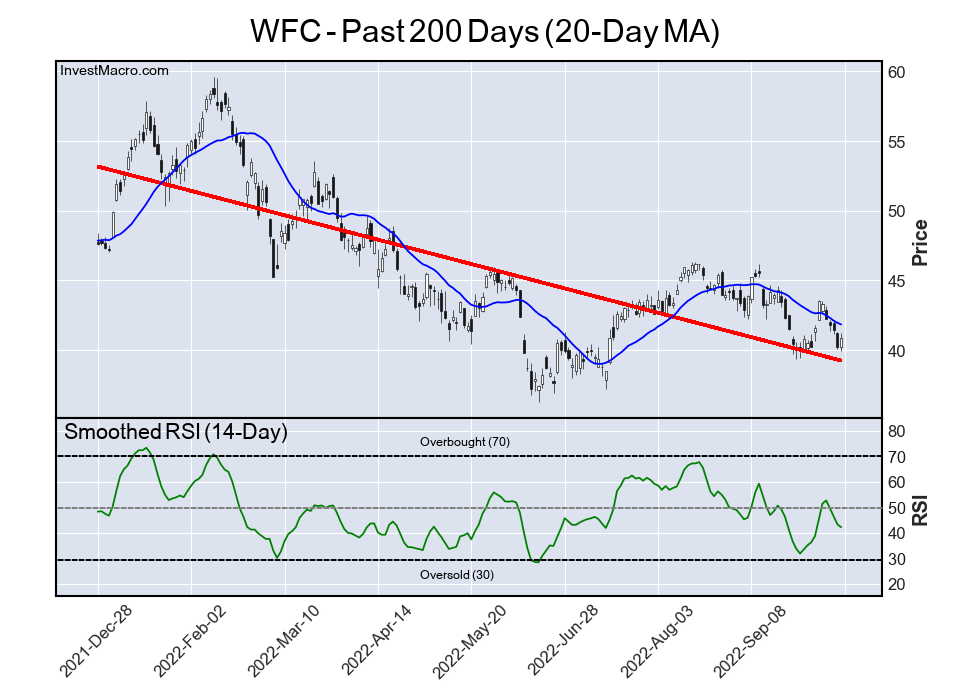
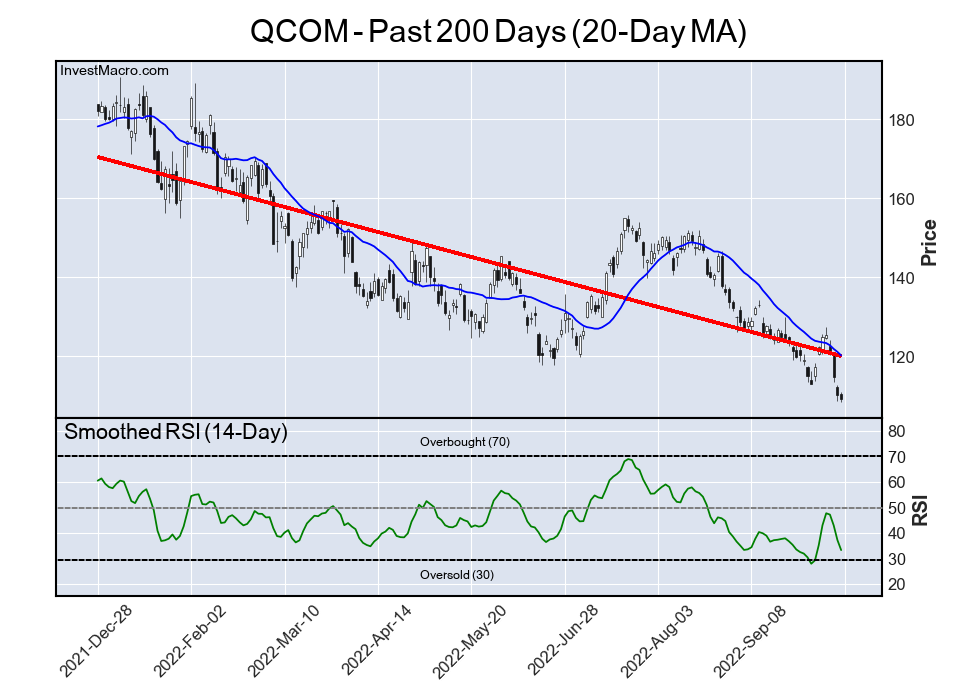
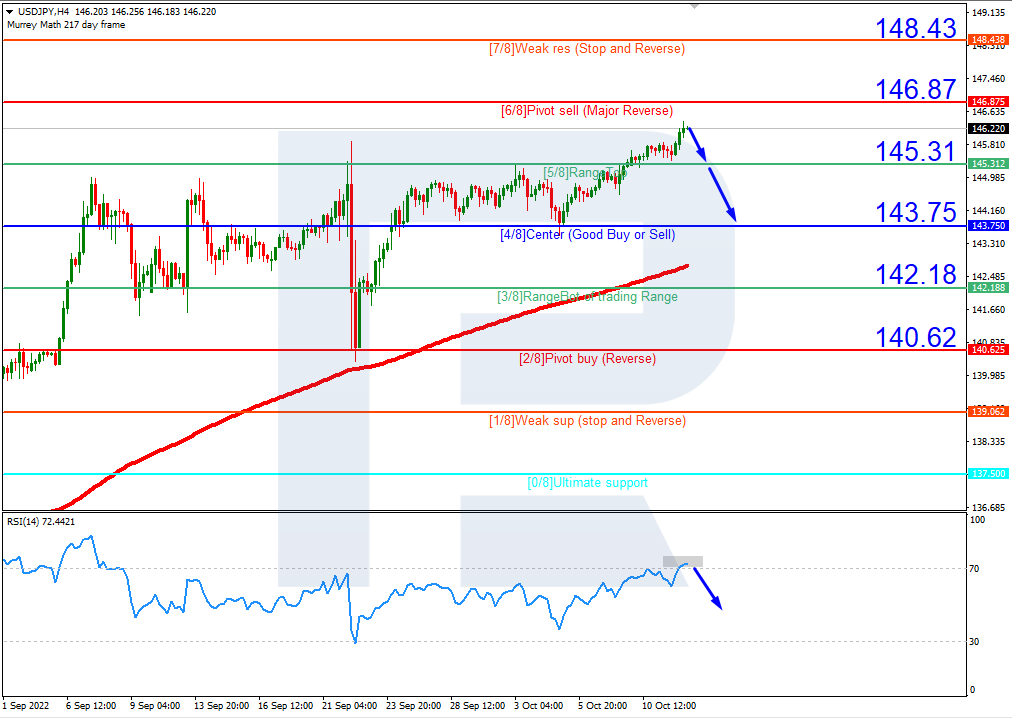
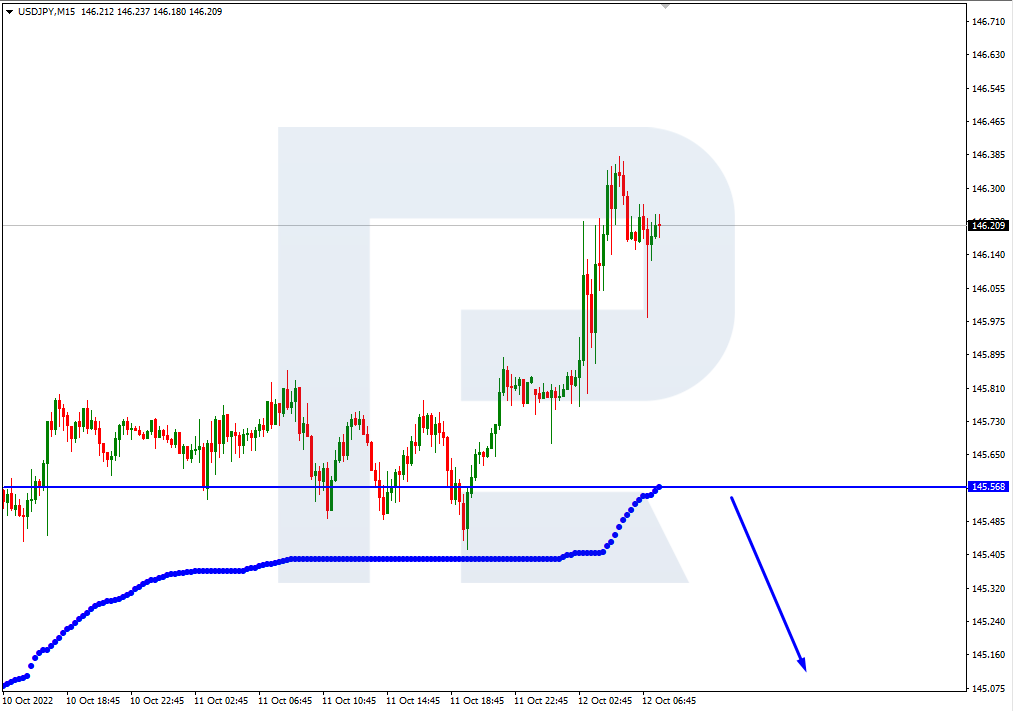
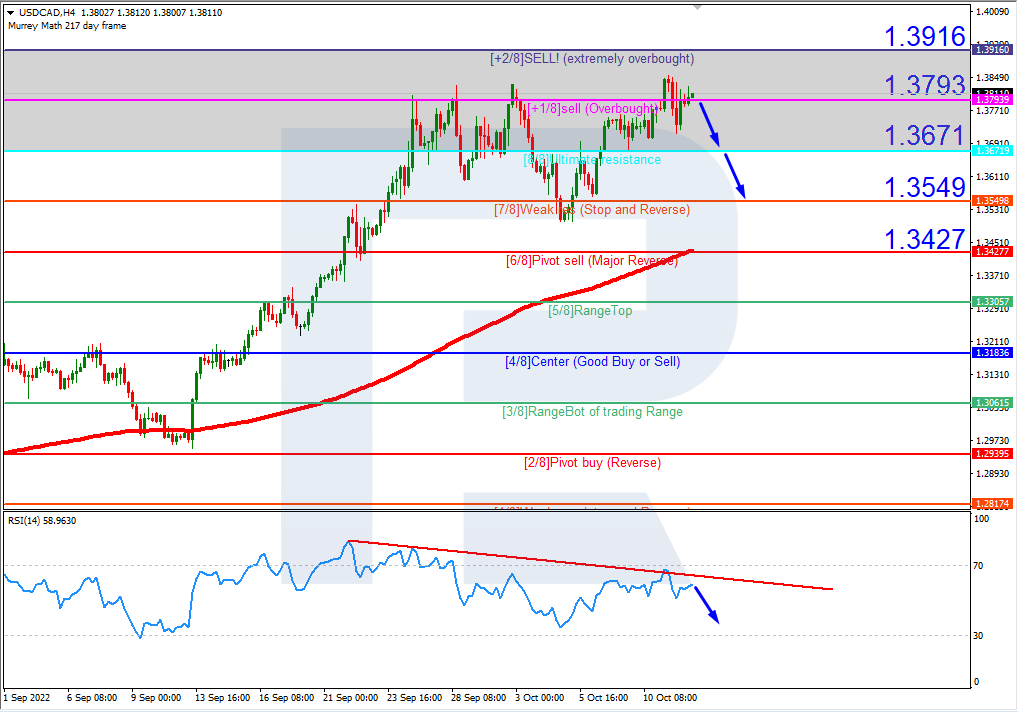
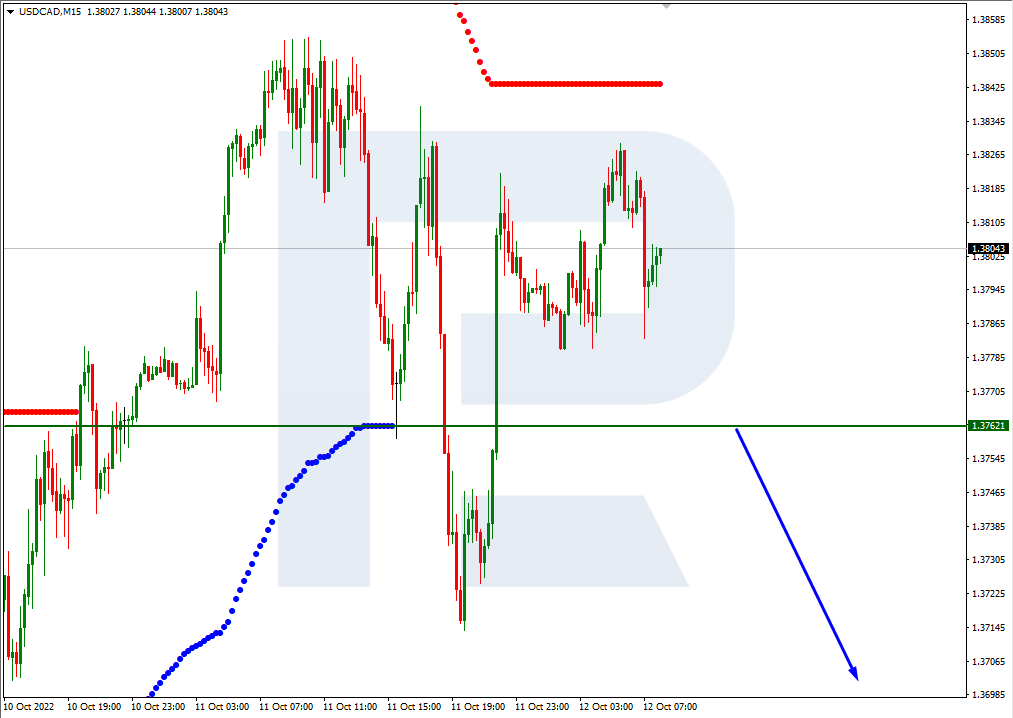
US stock indices have been falling for three quarters in a row. Europe and the US are imposing new sanctions on Russia

By JustForex

At the close of trading on Friday, the Dow Jones index (US30) decreased by 1.71% (-2.75% for the week), while the S&P500 (US500) was 1.51% lower (-2.64% for the week). The NASDAQ Technology Index (US100) fell by 0.75% on Friday (-0.39% for the week). As the Fed tightened its monetary policy to tame the strongest inflation in decades, the US Treasury yields jumped to their highest level in more than a decade, causing stocks to plummet.

Markets are entering the final stretch of 2022 after a tumultuous third-quarter close Friday, driven by persistently high inflation, rising interest rates, and fears of a recession. The US stock market has now posted three consecutive quarterly declines for the S&P 500 and Nasdaq since 2008, as well as the longest quarterly decline for the Dow Jones. Analysts believe investors are likely to see increased market volatility with a downward bias in the near term as we approach the reporting season.

European stock markets mostly rallied on Friday, but almost all closed in negative territory at the end of the week. German DAX (DE30) gained 1.16% (-0.96% for the week), French CAC 40 (FR40) gained 1.51% (+0.31% for the week), Spanish IBEX 35 (ES35) gained 0.91% (-2.22% for the week), British FTSE 100 (UK100) gained 0.18% (-1.78% for the week).

Inflation in the Eurozone reached double digits for the first time ever. In September, it jumped to a record 10% (9.1% in August) on an annualized basis. Core inflation (which excludes food and fuel prices) reached 4.8% (4.3% in August). The extremely high inflation figures mean that the ECB will continue to raise rates quickly in upcoming meetings. Analysts believe rates will be raised by 75 BPS in October, 50 BPS in December, and 25 BPS in the first quarter of 2023.

Four treaties were signed in the Kremlin on Friday to admit new entities to the Russian Federation. The so-called DNR, LNR, Kherson, and Zaporizhzhia regions were “annexed” by Russia. Now, Moscow will consider possible strikes by Ukraine against the territories that will “join” Russia as an act of aggression against Russia. For its part, Ukraine applied to NATO under an accelerated procedure. The European Union, the US, Canada, Australia, and many other countries said they would never recognize the results of the referendums on the new territories joining Russia, and called on other countries to condemn them.

EU countries reached a preliminary agreement on a new package of measures against Russia.

The US and UK introduced a new package of sanctions against Russia, which included dozens of individuals and entities. US President Joe Biden said after Russia’s annexation of new territories, the US would support Kyiv’s attempts to take them back. Biden said that Russia violated international law and the UN charter with its actions. The UK also imposed sanctions on services and an export ban, targeting Russia’s economic vulnerability. The UK is imposing an export ban on nearly 700 goods that are critical to Russia’s industrial and technological capabilities. The UK will also prohibit Russia from accessing the services of its engineering, architectural, auditing, legal, and advertising companies.

Embassies of many countries have advised their citizens, whose stay in Russia is not dictated by necessity, to leave Russia as soon as possible. Norway may impose a travel ban on Russian tourists, similar to that previously imposed by Finland.

According to analysts, OPEC+ will consider cutting production by more than 1 million barrels a day this week. The meeting will be held on October 5. OPEC+, which brings together OPEC nations and allies such as Russia, has refused to increase production to lower oil prices despite pressure from major consumers, including the US, to help the global economy. Nonetheless, prices fell sharply last month because of concerns about the global economy and the rising US dollar. Oil over $90 is non-negotiable for OPEC+ leadership, so they will act to keep that price floor.

Fears that further interest rate hikes could slow economic growth, coupled with the looming financial crisis in Europe and the UK, have led some investors to start buying gold again. But it should be noted that as long as there are tightening policies from Central Banks, which leads to higher government bond yields, the price of gold and silver will not have fundamental support.

Asian markets were trading lower last week. Japan’s Nikkei 225 (JP225) decreased by 3.15% for the week, Hong Kong’s Hang Seng (HK50) fell by 3.14% for the week, and Australia’s S&P/ASX 200 (AU200) was down 1.52% for the week.

In the commodities market, futures on orange juice (+5.82%), wheat (+4.86%), WTI oil (+2.98%), and Brent oil (+2.96%) showed the biggest gains. Futures on cotton (-7.78%), soybeans (-4.19%) and lumber (-2.34%) showed the largest drop.

S&P 500 (F) (US500) 3,585.62 −54.85 (−1.51%)

Dow Jones (US30) 28,725.51 −500.10 (−1.71%)

DAX (DE40) 12,114.36 +138.81 (+1.16%)

FTSE 100 (UK100) 6,893.81 +12.22 (+0.18%)

USD Index 113.02 +1.67 (+1.50%)

Important events for today:
  • – Japan Manufacturing PMI (m/m) at 03:30 (GMT+3);
  • – Switzerland Consumer Price Index (m/m) at 09:30 (GMT+3);
  • – Spanish Manufacturing PMI (m/m) at 10:15 (GMT+3);
  • – Switzerland Manufacturing PMI (m/m) at 10:30 (GMT+3);
  • – Italian Manufacturing PMI (m/m) at 10:45 (GMT+3);
  • – French Manufacturing PMI (m/m) at 10:50 (GMT+3);
  • – German Manufacturing PMI (m/m) at 10:55 (GMT+3);
  • – Eurozone Manufacturing PMI (m/m) at 11:00 (GMT+3);
  • – UK Manufacturing PMI (m/m) at 11:30 (GMT+3);
  • – Canada Manufacturing PMI (m/m) at 16:30 (GMT+3);
  • – US ISM Manufacturing PMI (m/m) at 17:00 (GMT+3);
  • – US FOMC Member Williams Speaks (m/m) at 22:10 (GMT+3).

By JustForex


This article reflects a personal opinion and should not be interpreted as an investment advice, and/or offer, and/or a persistent request for carrying out financial transactions, and/or a guarantee, and/or a forecast of future events.
Trade Of The Week: Big Week For Dollar As NFP Looms

By ForexTime 

– The mighty dollar has been an unstoppable force this year, crushing all obstacles with the destructive force of a wrecking ball. G10 currencies were practically pulverized by the greenback’s dominance with the pound shedding roughly 17% and yen over 20%.

After hitting a fresh 20-year high above 114.50 last week, the Dollar Index (DXY) tumbled thanks to a sharp recovery in the euro & pound. Given how the euro makes over 55% and the pound more than 10% of the DXY weighting, any further recovery in both currencies may influence the index’s direction in the short term.

We also saw some action on the equally-weighted dollar index which failed to secure a weekly close above 1.2800.

Despite the weakness witnessed last week, dollar bulls remain in the driving seat with the fundamentals keeping the engines healthy and running smoothly. However, a fresh catalyst could be needed for bulls to switch into higher gear in the weak ahead…and this could be the highly anticipated US jobs report on Friday.

Taking a quick look at the technical picture, prices remain bullish on the weekly charts as there have been consistently higher highs and higher lows. The DXY could make a new higher low before pushing higher or simply push back above 114.50 to test 114.73 and beyond.

The low down…

King dollar continues to feast on aggressive rate hike bets and global recession fears.

Last week, a chorus of Fed speakers struck an almost universally hawkish note on rate hikes. We saw the 10-year Treasury move above 4% for the first time since 2008, fuelled by expectations for the Fed to launch more monetary bazookas. As concerns intensified over the hawkish policies by global central banks sparking a recession, investors turned to the dollar as a shelter of safety.

As the first month of Q4 gets underway, dollar bulls have kicked off on a shaky start. Although it has weakened against most currencies, it is still early days. Traders are predicting a 66% probability of a 75-basis point rate hike in November. If this becomes reality, that would mark the fourth consecutive jumbo-sized 75 bp rate hike in 2022 against the inflation menace. Such a move could inject dollar bulls with renewed inspiration but investors may be more concerned with what happens beyond November and the New year.

Ahead of the Fed’s next policy meeting next month, key US economic data and speeches from Fed officials may influence expectations over how aggressive rates are hiked. Given how the dollar remains highly sensitive to speculation around hikes, this could translate to volatility over the next few weeks.

The week ahead…

It’s all about the US jobs report on Friday.

The consensus expects the US economy to have created 250k jobs in September which comes after a fifth straight beat in August. The unemployment rate is projected to remain at 3.7% while wage growth is seen hitting 0.3%. If the pending jobs data meets or exceeds market expectations, this may reinforce bets over the Fed moving ahead with a 75 basis point rate hike in November. Alternatively, a soft jobs report may reduce the odds of another jumbo- rate hike – weakening the dollar while supporting equity markets.

It may be wise to keep a close eye on the numerous speeches from Fed officials throughout the week. If Fed speakers remain hawkish and signal more aggressive hikes, this could keep dollar bulls hydrated ahead of the US jobs report. On the other hand, any hint of doves may see dollar bears enter the scene.

Dollar set to rebound?

After failing to secure a weekly close above 1.2800, the equally-weighted dollar index has edged slightly lower. Nevertheless, the fundamentals remain in favour of bulls and this could limit downside losses.

Bulls need to push back above 1.2800, to open a path back towards 1.2880 and higher. Sustained weakness below 1.2800 may open the doors towards 1.2500 and 1.2184.

Should 1.2500 prove to be reliable support, a rebound back towards 1.2800 could be a possibility.


Forex-Time-LogoArticle by ForexTime

ForexTime Ltd (FXTM) is an award winning international online forex broker regulated by CySEC 185/12 www.forextime.com

Brazil 2022: Lula’s comeback looms, unless…

By Dan Steinbock 

Not so long ago, Brazil’s BRIC economy soared as working people and the poor were able to join the labor force and formal economy. In just years, a “soft coup” and far-right president derailed Lula’s miracle. What next?  

As I am writing this column, Brazil is preparing for its general election on October 2, after the disastrous term of Jair Bolsonaro, the incumbent far-right president and ex- captain, who placed army officers in key cabinet positions.

Elected in exceptional circumstances, Bolsonaro caused exceptional damage in Brazil’s economy and politics, society and military, and ecology.

With more than 156 million registered voters, Brazil is the second largest democracy in the Americas and one of the largest in the world.

But democracy is no assurance that the election outcome will be democratic.

Bolsonaro’s disastrous term

Rolling back protections for indigenous groups and facilitating deforestation, Bolsonaro compounded devastation associated with accelerated climate change.

Under his government, the COVID-19 pandemic effects were downplayed, quarantine measures opposed, and health ministers dismissed. So, the pandemic has killed almost 700,000 Brazilians; more than in India, despite its seven times bigger population.

Seeking re-election, Bolsonaro is facing former president Luiz Inácio Lula da Silva, a veteran trade unionist, who was elected in 2002, reelected in 2006, and left the office as the most popular president in Brazil’s history. In the past six years, he has overcome not just a throat cancer, but the far-right effort to keep him in prison.

Before the election, Bolsonaro, who has never hidden his yearning for a new military junta, made multiple allegations of election fraud. Observers have been quick to condemn such claims as invalid. But widespread concern prevails that false allegations could be exploited to challenge the election outcome, to execute a coup, or both.

After their bitter experience with military dictatorship (1964-85), the last thing Brazilians want is a junta of generals. Their prime concern is the economy and jobs. And that’s why they want Lula back.

Lula’s Boom, Rousseff’s plunge, oligarchs’ coup               

In the early 1990s, Brazil still had a reputation as the world’s champion in “unfulfilled agreements with the IMF.” In 2003 Lula inherited a poor, resigned nation on the verge of an economic implosion. Winning the presidency heading the left-wing Workers’ Party (PT), his primary objective was to stabilize the economy and to lay foundation for the struggle against poverty.

Lula’s economic policies were born under favorable stars. In 2001, China joined the World Trade Organization (WTO). A year later, Lula initiated Brazil’s economic reforms. To modernize, Brazil needed demand for its commodities; to industrialize, China needed commodities.

In the 2010s, Lula refocused policy momentum to the expanding middle class. Now the goal became to provide new opportunities for the upwardly mobile, while ensuring income transfers to the poorest.

During those boom days, Brazil overtook Italy as the world’s seventh-largest economy, while living standards soared by almost 60 percent. In Brazil, these were the days of wine and roses, or caipirinha and orchids.

Brazil led Latin America. China spearheaded Asia. Both shunned President Bush’s unipolar foreign policy; each supported a multipolar view of the world.

Washington had a different take of such developments.

15 lost years

When Dilma Rousseff, Lula’s chief of staff, won presidency in 2012, she hoped to build on Lula’s success. In this quest, she failed, due to the lack of time and wrong priorities, tax policies and spending.

Worse, international environment worked against her. World trade plunged, commodity prices collapsed, China’s growth decelerated and the Fed initiated rate hikes. “Hot money” began to flee leaving behind asset shrinkages, deflation and depreciation.

In Brazil, a narrow economic elite reigns over an unequal economy polarized by class and race. It had always opposed Lula and PT, and it was supported by external forces. According to Wikileaks, the U.S. National Security Agency (NSA) tapped some 30 Brazilian government leaders’ phones (Rousseff, ministers, central bank chief, etc), and corporate giants, including Petrobras, the huge petroleum conglomerate that would play a central role in corruption allegations.

Sparked particularly by such allegations, protests erupted and were fostered by conservative and family-owned media oligopolies. That boosted the center-right opposition of juridical authorities and military leaders, conservative social democrats, Democrats, and PT’s more liberal allies.

In the subsequent “soft coup,” Rousseff was impeached by the Congress in 2016. The economic effects were disastrous. During Lula’s two terms, Brazil enjoyed a historical boom. Though sluggish rather than stagnant, Rousseff’s period was undermined by the coup. Bolsonaro’s economic mismanagement proved disastrous.

Following the coup and Bolsonaro, Brazil’s GDP is now where it was around 2007 or so. 15 years have been lost (Figure).


Brazil’s GDP: Lula (2003-10), Rousseff (2011-16), coup, Bolsonaro (2019-21)

Source: TradingEconomics; World Bank; Difference Group


Biased judges and political ambitions

In 2015 Sérgio Moro gained national attention as one of the lead judges in Operation Car Wash, a criminal investigation into high-profile corruption and bribery scandal involving government officials and business executives. It fueled Rousseff’s impeachment and Lula’s 580-day imprisonment.

Moro, a Harvard-trained judge, had participated in the U.S. State Department’s International Visitor Leadership Program (IVLP). Meanwhile, Brazil’s federal police began broader cooperation with the FBI and CIA.

Moro portrayed himself as untouchable judge with no political ambitions. Yet, afterwards he eagerly joined Bolsonaro’s government as Minister of Justice and Public Security (2019-20), and subsequently the presidential race only to withdraw after his ratings fell.

There was a reason for Moro’s plunge. His “investigations” were prejudicial. Leaked messages exchanged between Moro and prosecutors have led to widespread questioning of his impartiality during the Operation Car Wash hearings.

In June 2021, all cases Moro had brought against Lula were annulled. White House officials admitted that the CIA and other parts of the US intelligence apparatus had been involved in assisting the “War on Corruption,” which jailed Lula and elected Jair Bolsonaro. Even the UN Committee found Moro biased in all cases against Lula.

Toward Lula’s comeback, unless…

In Brazil’s first round of elections, the candidate who receives more than 50% of the total valid votes is elected. If the 50% threshold is not met, the two candidates who receive the most votes participate in a second round of voting on October 30.

All current polls suggest that Lula will win the first round. The projections indicate he could get 45%-48% of the vote, against Bolsonaro’s 30%-36%. Moreover, all current second-round polls suggest Lula’s win by 10% or more.

Then again…

While Washington has urged Brazil to conduct fair elections, Bolsonaro, after his June meeting with President Biden, issued a coded command to the military in which the word “auditable” focused attention on the electronic voting system.

Brazil’s military has a “parallel vote count,” which some consider a risk to democracy. Furthermore, CySource, a controversial Israeli company hired by Brazil’s military, will presumably “supervise” the election against “disinformation.” Meanwhile, Brazilian observers have charged both YouTube and Facebook for pushing pro-Bolsonaro content and supporting coup mongering.

If democratic rules prevail, Lula is likely to make a comeback on October 2, or October 30. If not, current turmoil is just a pale prelude of what’s ahead.

No election is viable without the “consent of the governed” – not even a democracy.

About the Author:

Dan Steinbock is the founder of Difference Group and has served as research director of international business at the India China and America Institute (US) and a visiting fellow at the Shanghai Institutes for International Studies (China) and the EU Centre (Singapore). For more, see http://www.differencegroup.net 

COT Speculator Extremes: Bitcoin, Soybean Meal, Gold & WTI Crude lead Bullish & Bearish Positions

By InvestMacro

The latest update for the weekly Commitment of Traders (COT) report was released by the Commodity Futures Trading Commission (CFTC) on Friday for data ending on Tuesday September 27th.

This week’s extreme COT data feels generally representative of where the market environment is at the current moment. Our COT data showed that there were just four markets with extreme bullish positioning (strength scores over 80 percent) in the over 50+ markets we watch each week and calculate strength scores for.

On the other hand, there were eighteen markets with extreme bearish positioning or strength scores under 20 percent.

For the bullish extreme markets, one was Bitcoin, one was a soft commodity, one was a stock market and one was a currency.

In the bearish extremes, five were in the metals category, two were in energy, two were in stocks, three were in currencies, one was in the soft commodities and five were in bonds markets.


Extreme Positioning Notes:

The weekly Extreme Positions report highlights the Top Most Bullish and Top Most Bearish Positions for the speculator category. Extreme positioning in these markets can foreshadow strong moves in the underlying market.

To signify an extreme position, we use the Strength Index (also known as the COT Index) of each instrument, a common method of measuring COT data. The Strength Index is simply a comparison of current trader positions against the range of positions over the previous 3 years. We use over 80 percent as extremely bullish and under 20 percent as extremely bearish. (Compare Strength Index scores across all markets in the cot leaders table or read more about speculators).


Here Are This Week’s Most Bullish Speculator Positions:

Bitcoin

bitcoin strength scores
The Bitcoin speculator’s futures position comes in as the most bullish extreme standing this week. The Bitcoin speculator level is currently at a 95 percent score of its 3-year range.

The speculator position totaled 1,024 net contracts this week which was a gain by 447 contracts from last week.

Bitcoin is an interesting case as the speculator position remains very small compared to most other markets. The overall open interest levels (contracts open in the market) are also small but have been gaining steadily over the past few years since the introduction of Bitcoin futures. The speculative position in this market signals that there are buyers currently betting on a rebound of the Bitcoin price.


Soybean Meal

Soybean Meal comes in second place this week in the COT Extreme positions after leading last week. The Soybean Meal strength score is 91.5 percent of its 3-Year range currently.

The speculator net position fell by -11,395 contracts this week to a total of 115,075 net contracts. The futures price for Soybean Meal did not follow the extreme position higher this week and finished the week lower by over -4 percent.


Nikkei 225

nikkei 225 speculators extreme level

The Nikkei 225 speculator trader’s futures position comes in third in the extreme standings this week. The Nikkei 225 speculator level is now at a 85 percent score of its 3-year range.

The speculator net position totaled 1,520 contracts this week with a rise of 6,161 contracts from last week. This is first time that the position has been positive in twelve weeks and this week’s extreme position shows that a bullish position has been a rare occurrence in this market over the past three years.


Brazilian Real

brazilian real speculator extreme level

The Brazilian Real speculator’s futures position comes in fourth this week in the extreme standings. The BRL speculator level resides at a 84 percent score of its 3-year range. Speculator strength levels have come back strong after a sharp drop early in the COVID pandemic although the exchange rates have not recovered to the same levels. Currently, speculator positioning is once again high as speculator’s could be betting on the higher Brazilian interest rates (currently over 12 percent), higher commodity prices or possibly positioning for a new president and policies.


This Week’s Most Bearish Speculator Positions:

Gold

The Gold speculator’s futures position comes in as the most bearish extreme standing this week. The Gold speculator level is at a 0 percent score of its 3-year range as the speculator net position fell to a total of 52,081 net contracts this week, marking a multi-year low. The Gold price is down by approximately 20 percent since hitting a recent high in March.


WTI Crude Oil

The WTI Crude Oil speculator’s futures position comes in next for the most bearish extreme standing on the week. The WTI Crude speculator level is at just a 4 percent score of its 3-year range.

The speculator net position was a total of 226,080 contracts this week which was a decline by -13,798 contracts from last week. This week marks the 13th straight week that WTI contracts have been in a bearish extreme position.


Platinum

Platinum speculators extreme contract bets

The Platinum speculator trader’s futures position comes in as third most bearish extreme standing of the week. The Platinum speculator level resides at just a 9 percent score of its 3-year range. Platinum prices have retreated over the past year after racing to multi-year highs of over $1,345.00 in February of 2021. All the metals markets we cover have seen similar trajectories with cooling prices as metals have faced a difficult investing environment with a strong dollar and rising interest rates.


Mexican Peso

Mexican Peso COT Extreme Speculator Positions

The Mexican Peso speculator’s futures position comes in as this week’s fourth most bearish extreme standing. The MXN speculator level is at a 10 percent score of its 3-year range. The speculator net position totaled -41,322 contracts this week and a sharp fall by -13,289 contracts from last week. The peso price has held up relatively well and been very stable against the US dollar in the past year despite its weak speculator sentiment. The peso exchange rate has fluctuated in a relatively tight band between 0.0450 and 0.0515 since recovering from its pandemic lows.


Article By InvestMacroReceive our weekly COT Newsletter

*COT Report: The COT data, released weekly to the public each Friday, is updated through the most recent Tuesday (data is 3 days old) and shows a quick view of how large speculators or non-commercials (for-profit traders) were positioned in the futures markets.

The CFTC categorizes trader positions according to commercial hedgers (traders who use futures contracts for hedging as part of the business), non-commercials (large traders who speculate to realize trading profits) and nonreportable traders (usually small traders/speculators) as well as their open interest (contracts open in the market at time of reporting). See CFTC criteria here.

Butter, garage doors and SUVs: Why shortages remain common 2½ years into the pandemic

By Michael Okrent, Colorado State University Global 

Shortages of basic goods still plague the U.S. economy – 2½ years after the pandemic’s onset turned global supply chains upside down.

Want a new car? You may have to wait as long as six months, depending on the model you order. Looking for a spicy condiment? Supplies of Sriracha hot sauce have been running dangerously low. And if you feed your cat or dog dry pet food, expect empty shelves or elevated prices.

These aren’t isolated products. Baby formula, wine and spirits, lawn chairs, garage doors, butter, cream cheese, breakfast cereal and many more items have also been facing shortages in the U.S. during 2022 – and popcorn and tomatoes are expected to be in short supply soon.

In fact, global supply chains have been under the most strain in at least a quarter-century, and have been pretty much ever since the COVID-19 pandemic began.

I have been immersed in supply chain management for over 35 years, both as a manager and consultant in the private sector and as an adjunct professor at Colorado State University – Global Campus.

While each product experiencing a shortage has its own story as to what went wrong, at the root of most is a concept people in my field call the “bullwhip effect.”

What is the ‘bullwhip effect’?

The term bullwhip effect was coined in 1961 by MIT computer scientist Jay Forrester in his seminal book “Industrial Dynamics.” It describes what happens when fluctuations in demand reverberate and amplify throughout the supply chain, leading to worsening problems and shortages.

Imagine the physics of cracking a whip. It starts with a small flick of the wrist, but the whip’s wave patterns grow exponentially in a chain reaction, leading to the tip, a snap – and a sharp pain for anyone on the receiving end.

The same thing can happen in supply chains when orders for a product from a retailer, say, go up or down by some amount and that gets amplified by wholesalers, distributors and raw material suppliers.

The onset of the COVID-19 pandemic, which led to lengthy lockdowns, massive unemployment and a whole host of other effects that messed up global supply chains, essentially supercharged the bullwhip’s snap.

How the bullwhip effect works.

Cars and chips

The supply of autos is one such example.

New as well as used vehicles have been in short supply throughout the pandemic, at times forcing consumers to wait as long as a year for the most popular models.

In early 2020, when the pandemic put most Americans in lockdown, carmakers began to anticipate a fall in demand, so they significantly scaled back production. This sent a signal to suppliers, especially of computer chips, that they would need to find different buyers for their products.

Computer chips aren’t one size fits all; they are designed differently depending on their end use. So chipmakers began making fewer chips intended for use in cars and trucks and more for computers and smart refrigerators.

So when demand for vehicles suddenly returned in early 2021, carmakers were unable to secure enough chips to ramp up production. Production last year was down about 13% from 2019 levels. Since then, chipmakers have began to produce more car-specific chips, and Congress even passed a law to beef up U.S. manufacturing of semiconductors. Some carmakers, such as Ford and General Motors, have decided to sell incomplete cars, without chips and the special features they power like touchscreens, to relieve delays.

But shortages remain. You could chalk this up to poor planning, but it’s also the bullwhip effect in action.

The bullwhip is everywhere

And this is a problem for a heck of a lot of goods and parts, especially if they, like semiconductors, come from Asia.

In fact, pretty much everything Americans get from Asia – about 40% of all U.S. imports – could be affected by the bullwhip effect.

Most of this stuff travels to the U.S. by container ships, the cheapest means of transportation. That means goods must typically spend a week or longer traversing the Pacific Ocean.

The bullwhip effect comes in when a disruption in the information flow from customer to supplier happens.

For example, let’s say a customer sees that an order of lawn chairs has not been delivered by the expected date, perhaps because of a minor transportation delay. So the customer complains to the retailer, which in turn orders more from the manufacturer. Manufacturers see orders increase and pass the orders on to the suppliers with a little added, just in case.

What started out as a delay in transportation now has become a major increase in orders all down the supply chain. Now the retailer gets delivery of all the products it overordered and reduces the next order to the factory, which reduces its order to suppliers, and so on.

Now try to visualize the bullwhip of orders going up and down at the suppliers’ end.

The pandemic caused all kinds of transportation disruptions – whether due to a lack of workers, problems at a port or something else – most of which triggered the bullwhip effect.

The end isn’t nigh

When will these problems end? The answer will likely disappoint you.

As the world continues to become more interconnected, a minor problem can become larger if information is not available. Even with the right information at the right time, life happens. A storm might cause a ship carrying new cars from Europe to be lost at sea. Having only a few sources of baby formula causes a shortage when a safety issue shuts down the largest producer. Russia invades Ukraine, and 10% of the world’s grain is held hostage.

The early effects of the pandemic in 2020 led to a sharp drop in demand, which rippled through supply chains and decreased production. A strong U.S. economy and consumers flush with coronavirus cash led to a surge in demand in 2021, and the system had a hard time catching up. Now the impact of soaring inflation and a looming recession will reverse that effect, leading to a glut of stuff and a drop in orders. And the cycle will repeat.

As best as I can tell, these disruptions will take many years to recover from. And as recent inflation reduces demand for goods, and consumers begin cutting back, the bullwhip will again work its way through the supply chain – and you’ll see more shortages as it does.The Conversation

About the Author:

Michael Okrent, Part-Time Faculty in Project Management, Colorado State University Global

This article is republished from The Conversation under a Creative Commons license. Read the original article.

Currency Speculators reduced British Pound bearish bets after GBPUSD record low

By InvestMacro

Currency Speculators reduced British Pound bearish bets after GBP record low

Here are the latest charts and statistics for the Commitment of Traders (COT) data published by the Commodities Futures Trading Commission (CFTC).

The latest COT data is updated through Tuesday September 27th and shows a quick view of how large market participants (for-profit speculators and commercial traders) were positioned in the futures markets. All currency positions are in direct relation to the US dollar where, for example, a bet for the euro is a bet that the euro will rise versus the dollar while a bet against the euro will be a bet that the euro will decline versus the dollar.

Weekly Speculator Changes led by British pound sterling & Australian dollar

Weekly Speculator Changes led by British pound sterling & Australian dollar

The COT currency market speculator bets were mostly higher this week as eight out of the eleven currency markets we cover had higher positioning while the other three markets had lower speculator contracts.

Leading the gains for the currency markets was the British pound sterling (8,419 contracts) and the Australian dollar (5,903 contracts) with the US Dollar Index (2,631 contracts), the Brazilian real (1,395 contracts), the New Zealand dollar (1,118 contracts), the Swiss franc (1,010 contracts), Bitcoin(447 contracts) and the Euro (348 contracts) also showing a positive week.

The currencies leading the declines in speculator bets this week were the Canadian dollar (-19,722 contracts) and the Mexican peso (-13,289 contracts) with the Japanese yen (-1,276 contracts) also registering lower bets on the week.

Speculators cut bearish bets in Sterling after record low, UK budget upends markets

Highlighting the COT Currencies data is the gains in speculator positions for the British pound sterling. The sterling speculator positioning this week (through Tuesday) rose by more than +8,000 net speculator contracts and follows last week’s rise by over +13,000 contracts. This has cut the overall bearish position by more than 21,000 contracts in two weeks. Previously, the speculative position had fallen for three straight weeks and dropped to the lowest speculator standing in fourteen weeks. The speculator positioning has now been in a bearish level for 32 consecutive weeks, dating back to February 15th.

This was an interesting week for the sterling and the United Kingdom markets in general as a government announcement of a new budget (and tax cut) created havoc and volatility across markets. The news sent UK bonds into a tailspin and created financial ripple effects in stocks, mortgages and pension funds. The sterling also nose-dived sharply and slipped all the way to a new record low versus the US dollar at approximately the 1.0362 exchange rate on Monday. An emergency Bank of England bond-buying program soothed the markets and helped sterling bounce from the lows of Monday to finish the week higher by over 2.50 percent.

Overall in the big picture, the current sterling speculative positioning (at -46,424 contracts) is, like the Euro, relatively tame considering where the currency price resides (near record lows). The 2022 weekly average position for GBP is -44,153 contracts which shows that traders are not extremely bearish despite the exchange rate level. The next few weeks will give the markets important insights into whether the Bank of England has managed to stem the slide in sterling or if, like the Bank of Japan’s recent record yen intervention, the GBP retests its multi-decade lows against the dollar.


Data Snapshot of Forex Market Traders | Columns Legend
Sep-27-2022OIOI-IndexSpec-NetSpec-IndexCom-NetCOM-IndexSmalls-NetSmalls-Index
USD Index56,0468030,56276-32,482241,92038
EUR654,1426133,79745-58,4405924,64315
GBP281,80587-46,4242965,21778-18,7938
JPY244,65577-82,55618100,63385-18,07717
CHF44,49230-5,7304216,89870-11,16820
CAD140,88924-17,6662021,70787-4,04122
AUD152,30146-34,6535347,99855-13,34520
NZD45,24034-11,4715015,07255-3,60110
MXN173,04537-41,3221037,998893,32457
RUB20,93047,54331-7,15069-39324
BRL55,9304833,76484-35,031171,26780
Bitcoin14,271821,02495-1,221019717


Strength Scores

Strength Scores (a normalized measure of Speculator positions over a 3-Year range, from 0 to 100 where above 80 is extreme bullish and below 20 is extreme bearish) show that Bitcoin (94.8 percent) and the Brazilian Real (83.6 percent) lead the currency markets at the top of their respective ranges and are both in bullish extreme positions. The US Dollar Index (75.9 percent) comes in as the next highest in the currency markets in strength scores.

On the downside, the Mexican Peso (9.7 percent) comes in at the lowest strength level currently and is followed by the Japanese Yen (18.0 percent) and the Canadian Dollar (19.5 percent).

Strength Statistics:
US Dollar Index (75.9 percent) vs US Dollar Index previous week (71.5 percent)
EuroFX (45.4 percent) vs EuroFX previous week (45.3 percent)
British Pound Sterling (29.2 percent) vs British Pound Sterling previous week (21.9 percent)
Japanese Yen (18.0 percent) vs Japanese Yen previous week (18.8 percent)
Swiss Franc (42.0 percent) vs Swiss Franc previous week (39.4 percent)
Canadian Dollar (19.5 percent) vs Canadian Dollar previous week (41.7 percent)
Australian Dollar (52.7 percent) vs Australian Dollar previous week (47.2 percent)
New Zealand Dollar (50.3 percent) vs New Zealand Dollar previous week (48.3 percent)
Mexican Peso (9.7 percent) vs Mexican Peso previous week (15.4 percent)
Brazilian Real (83.6 percent) vs Brazilian Real previous week (82.2 percent)
Bitcoin (94.8 percent) vs Bitcoin previous week (87.0 percent)

Strength Trends

Strength Score Trends (or move index, calculates the 6-week changes in strength scores) show that the Brazilian Real (26.8 percent) leads the past six weeks trends for the currency markets this week. The EuroFX (23.5 percent), the Australian Dollar (22.8 percent) and Bitcoin (19.5 percent) fill out the top movers in the latest trends data.

The Canadian Dollar (-50.0 percent) leads the downside trend scores currently while the next market with lower trend scores were the Japanese Yen (-33.1 percent) followed by the New Zealand Dollar (-23.0 percent).


Strength Trend Statistics:
US Dollar Index (-12.3 percent) vs US Dollar Index previous week (-17.9 percent)
EuroFX (23.5 percent) vs EuroFX previous week (20.9 percent)
British Pound Sterling (-11.4 percent) vs British Pound Sterling previous week (-17.5 percent)
Japanese Yen (-33.1 percent) vs Japanese Yen previous week (-34.6 percent)
Swiss Franc (-1.6 percent) vs Swiss Franc previous week (7.7 percent)
Canadian Dollar (-50.0 percent) vs Canadian Dollar previous week (-21.5 percent)
Australian Dollar (22.8 percent) vs Australian Dollar previous week (15.8 percent)
New Zealand Dollar (-23.0 percent) vs New Zealand Dollar previous week (-21.4 percent)
Mexican Peso (-8.5 percent) vs Mexican Peso previous week (-0.2 percent)
Brazilian Real (26.8 percent) vs Brazilian Real previous week (30.1 percent)
Bitcoin (19.5 percent) vs Bitcoin previous week (14.1 percent)


Individual COT Forex Markets:

US Dollar Index Futures:

US Dollar Index Forex Futures COT ChartThe US Dollar Index large speculator standing this week equaled a net position of 30,562 contracts in the data reported through Tuesday. This was a weekly boost of 2,631 contracts from the previous week which had a total of 27,931 net contracts.

This week’s current strength score (the trader positioning range over the past three years, measured from 0 to 100) shows the speculators are currently Bullish with a score of 75.9 percent. The commercials are Bearish with a score of 24.2 percent and the small traders (not shown in chart) are Bearish with a score of 37.5 percent.

US DOLLAR INDEX StatisticsSPECULATORSCOMMERCIALSSMALL TRADERS
– Percent of Open Interest Longs:84.63.89.8
– Percent of Open Interest Shorts:30.161.86.4
– Net Position:30,562-32,4821,920
– Gross Longs:47,4242,1535,481
– Gross Shorts:16,86234,6353,561
– Long to Short Ratio:2.8 to 10.1 to 11.5 to 1
NET POSITION TREND:
– Strength Index Score (3 Year Range Pct):75.924.237.5
– Strength Index Reading (3 Year Range):BullishBearishBearish
NET POSITION MOVEMENT INDEX:
– 6-Week Change in Strength Index:-12.313.0-8.7


Euro Currency Futures:

Euro Currency Futures COT ChartThe Euro Currency large speculator standing this week equaled a net position of 33,797 contracts in the data reported through Tuesday. This was a weekly gain of 348 contracts from the previous week which had a total of 33,449 net contracts.

This week’s current strength score (the trader positioning range over the past three years, measured from 0 to 100) shows the speculators are currently Bearish with a score of 45.4 percent. The commercials are Bullish with a score of 59.4 percent and the small traders (not shown in chart) are Bearish-Extreme with a score of 15.2 percent.

EURO Currency StatisticsSPECULATORSCOMMERCIALSSMALL TRADERS
– Percent of Open Interest Longs:31.953.312.0
– Percent of Open Interest Shorts:26.762.28.2
– Net Position:33,797-58,44024,643
– Gross Longs:208,736348,37478,547
– Gross Shorts:174,939406,81453,904
– Long to Short Ratio:1.2 to 10.9 to 11.5 to 1
NET POSITION TREND:
– Strength Index Score (3 Year Range Pct):45.459.415.2
– Strength Index Reading (3 Year Range):BearishBullishBearish-Extreme
NET POSITION MOVEMENT INDEX:
– 6-Week Change in Strength Index:23.5-22.54.6


British Pound Sterling Futures:

British Pound Sterling Futures COT ChartThe British Pound Sterling large speculator standing this week equaled a net position of -46,424 contracts in the data reported through Tuesday. This was a weekly rise of 8,419 contracts from the previous week which had a total of -54,843 net contracts.

This week’s current strength score (the trader positioning range over the past three years, measured from 0 to 100) shows the speculators are currently Bearish with a score of 29.2 percent. The commercials are Bullish with a score of 78.4 percent and the small traders (not shown in chart) are Bearish-Extreme with a score of 8.1 percent.

BRITISH POUND StatisticsSPECULATORSCOMMERCIALSSMALL TRADERS
– Percent of Open Interest Longs:21.269.37.6
– Percent of Open Interest Shorts:37.746.114.2
– Net Position:-46,42465,217-18,793
– Gross Longs:59,831195,24421,327
– Gross Shorts:106,255130,02740,120
– Long to Short Ratio:0.6 to 11.5 to 10.5 to 1
NET POSITION TREND:
– Strength Index Score (3 Year Range Pct):29.278.48.1
– Strength Index Reading (3 Year Range):BearishBullishBearish-Extreme
NET POSITION MOVEMENT INDEX:
– 6-Week Change in Strength Index:-11.412.2-10.7


Japanese Yen Futures:

Japanese Yen Forex Futures COT ChartThe Japanese Yen large speculator standing this week equaled a net position of -82,556 contracts in the data reported through Tuesday. This was a weekly lowering of -1,276 contracts from the previous week which had a total of -81,280 net contracts.

This week’s current strength score (the trader positioning range over the past three years, measured from 0 to 100) shows the speculators are currently Bearish-Extreme with a score of 18.0 percent. The commercials are Bullish-Extreme with a score of 84.7 percent and the small traders (not shown in chart) are Bearish-Extreme with a score of 16.7 percent.

JAPANESE YEN StatisticsSPECULATORSCOMMERCIALSSMALL TRADERS
– Percent of Open Interest Longs:9.380.18.8
– Percent of Open Interest Shorts:43.039.016.2
– Net Position:-82,556100,633-18,077
– Gross Longs:22,706195,93021,476
– Gross Shorts:105,26295,29739,553
– Long to Short Ratio:0.2 to 12.1 to 10.5 to 1
NET POSITION TREND:
– Strength Index Score (3 Year Range Pct):18.084.716.7
– Strength Index Reading (3 Year Range):Bearish-ExtremeBullish-ExtremeBearish-Extreme
NET POSITION MOVEMENT INDEX:
– 6-Week Change in Strength Index:-33.128.6-10.1


Swiss Franc Futures:

Swiss Franc Forex Futures COT ChartThe Swiss Franc large speculator standing this week equaled a net position of -5,730 contracts in the data reported through Tuesday. This was a weekly boost of 1,010 contracts from the previous week which had a total of -6,740 net contracts.

This week’s current strength score (the trader positioning range over the past three years, measured from 0 to 100) shows the speculators are currently Bearish with a score of 42.0 percent. The commercials are Bullish with a score of 70.4 percent and the small traders (not shown in chart) are Bearish-Extreme with a score of 19.7 percent.

SWISS FRANC StatisticsSPECULATORSCOMMERCIALSSMALL TRADERS
– Percent of Open Interest Longs:17.363.419.1
– Percent of Open Interest Shorts:30.125.444.2
– Net Position:-5,73016,898-11,168
– Gross Longs:7,68128,1968,500
– Gross Shorts:13,41111,29819,668
– Long to Short Ratio:0.6 to 12.5 to 10.4 to 1
NET POSITION TREND:
– Strength Index Score (3 Year Range Pct):42.070.419.7
– Strength Index Reading (3 Year Range):BearishBullishBearish-Extreme
NET POSITION MOVEMENT INDEX:
– 6-Week Change in Strength Index:-1.65.2-9.0


Canadian Dollar Futures:

Canadian Dollar Forex Futures COT ChartThe Canadian Dollar large speculator standing this week equaled a net position of -17,666 contracts in the data reported through Tuesday. This was a weekly decline of -19,722 contracts from the previous week which had a total of 2,056 net contracts.

This week’s current strength score (the trader positioning range over the past three years, measured from 0 to 100) shows the speculators are currently Bearish-Extreme with a score of 19.5 percent. The commercials are Bullish-Extreme with a score of 86.8 percent and the small traders (not shown in chart) are Bearish with a score of 22.0 percent.

CANADIAN DOLLAR StatisticsSPECULATORSCOMMERCIALSSMALL TRADERS
– Percent of Open Interest Longs:23.953.421.3
– Percent of Open Interest Shorts:36.438.024.1
– Net Position:-17,66621,707-4,041
– Gross Longs:33,67775,26729,978
– Gross Shorts:51,34353,56034,019
– Long to Short Ratio:0.7 to 11.4 to 10.9 to 1
NET POSITION TREND:
– Strength Index Score (3 Year Range Pct):19.586.822.0
– Strength Index Reading (3 Year Range):Bearish-ExtremeBullish-ExtremeBearish
NET POSITION MOVEMENT INDEX:
– 6-Week Change in Strength Index:-50.044.9-18.7


Australian Dollar Futures:

Australian Dollar Forex Futures COT ChartThe Australian Dollar large speculator standing this week equaled a net position of -34,653 contracts in the data reported through Tuesday. This was a weekly gain of 5,903 contracts from the previous week which had a total of -40,556 net contracts.

This week’s current strength score (the trader positioning range over the past three years, measured from 0 to 100) shows the speculators are currently Bullish with a score of 52.7 percent. The commercials are Bullish with a score of 54.7 percent and the small traders (not shown in chart) are Bearish-Extreme with a score of 19.9 percent.

AUSTRALIAN DOLLAR StatisticsSPECULATORSCOMMERCIALSSMALL TRADERS
– Percent of Open Interest Longs:25.661.011.2
– Percent of Open Interest Shorts:48.429.419.9
– Net Position:-34,65347,998-13,345
– Gross Longs:39,00692,83616,982
– Gross Shorts:73,65944,83830,327
– Long to Short Ratio:0.5 to 12.1 to 10.6 to 1
NET POSITION TREND:
– Strength Index Score (3 Year Range Pct):52.754.719.9
– Strength Index Reading (3 Year Range):BullishBullishBearish-Extreme
NET POSITION MOVEMENT INDEX:
– 6-Week Change in Strength Index:22.8-11.6-22.2


New Zealand Dollar Futures:

New Zealand Dollar Forex Futures COT ChartThe New Zealand Dollar large speculator standing this week equaled a net position of -11,471 contracts in the data reported through Tuesday. This was a weekly boost of 1,118 contracts from the previous week which had a total of -12,589 net contracts.

This week’s current strength score (the trader positioning range over the past three years, measured from 0 to 100) shows the speculators are currently Bullish with a score of 50.3 percent. The commercials are Bullish with a score of 55.1 percent and the small traders (not shown in chart) are Bearish-Extreme with a score of 10.2 percent.

NEW ZEALAND DOLLAR StatisticsSPECULATORSCOMMERCIALSSMALL TRADERS
– Percent of Open Interest Longs:27.267.15.5
– Percent of Open Interest Shorts:52.533.813.5
– Net Position:-11,47115,072-3,601
– Gross Longs:12,28730,3432,489
– Gross Shorts:23,75815,2716,090
– Long to Short Ratio:0.5 to 12.0 to 10.4 to 1
NET POSITION TREND:
– Strength Index Score (3 Year Range Pct):50.355.110.2
– Strength Index Reading (3 Year Range):BullishBullishBearish-Extreme
NET POSITION MOVEMENT INDEX:
– 6-Week Change in Strength Index:-23.023.6-18.8


Mexican Peso Futures:

Mexican Peso Futures COT ChartThe Mexican Peso large speculator standing this week equaled a net position of -41,322 contracts in the data reported through Tuesday. This was a weekly decrease of -13,289 contracts from the previous week which had a total of -28,033 net contracts.

This week’s current strength score (the trader positioning range over the past three years, measured from 0 to 100) shows the speculators are currently Bearish-Extreme with a score of 9.7 percent. The commercials are Bullish-Extreme with a score of 88.6 percent and the small traders (not shown in chart) are Bullish with a score of 57.1 percent.

MEXICAN PESO StatisticsSPECULATORSCOMMERCIALSSMALL TRADERS
– Percent of Open Interest Longs:50.744.53.8
– Percent of Open Interest Shorts:74.622.61.9
– Net Position:-41,32237,9983,324
– Gross Longs:87,72377,0616,626
– Gross Shorts:129,04539,0633,302
– Long to Short Ratio:0.7 to 12.0 to 12.0 to 1
NET POSITION TREND:
– Strength Index Score (3 Year Range Pct):9.788.657.1
– Strength Index Reading (3 Year Range):Bearish-ExtremeBullish-ExtremeBullish
NET POSITION MOVEMENT INDEX:
– 6-Week Change in Strength Index:-8.58.4-1.0


Brazilian Real Futures:

Brazil Real Futures COT ChartThe Brazilian Real large speculator standing this week equaled a net position of 33,764 contracts in the data reported through Tuesday. This was a weekly gain of 1,395 contracts from the previous week which had a total of 32,369 net contracts.

This week’s current strength score (the trader positioning range over the past three years, measured from 0 to 100) shows the speculators are currently Bullish-Extreme with a score of 83.6 percent. The commercials are Bearish-Extreme with a score of 17.1 percent and the small traders (not shown in chart) are Bullish with a score of 79.6 percent.

BRAZIL REAL StatisticsSPECULATORSCOMMERCIALSSMALL TRADERS
– Percent of Open Interest Longs:70.623.15.7
– Percent of Open Interest Shorts:10.285.73.4
– Net Position:33,764-35,0311,267
– Gross Longs:39,48612,9073,161
– Gross Shorts:5,72247,9381,894
– Long to Short Ratio:6.9 to 10.3 to 11.7 to 1
NET POSITION TREND:
– Strength Index Score (3 Year Range Pct):83.617.179.6
– Strength Index Reading (3 Year Range):Bullish-ExtremeBearish-ExtremeBullish
NET POSITION MOVEMENT INDEX:
– 6-Week Change in Strength Index:26.8-25.7-10.2


Bitcoin Futures:

Bitcoin Crypto Futures COT ChartThe Bitcoin large speculator standing this week equaled a net position of 1,024 contracts in the data reported through Tuesday. This was a weekly rise of 447 contracts from the previous week which had a total of 577 net contracts.

This week’s current strength score (the trader positioning range over the past three years, measured from 0 to 100) shows the speculators are currently Bullish-Extreme with a score of 94.8 percent. The commercials are Bearish-Extreme with a score of 5.2 percent and the small traders (not shown in chart) are Bearish-Extreme with a score of 17.4 percent.

BITCOIN StatisticsSPECULATORSCOMMERCIALSSMALL TRADERS
– Percent of Open Interest Longs:83.40.47.4
– Percent of Open Interest Shorts:76.29.06.1
– Net Position:1,024-1,221197
– Gross Longs:11,902641,061
– Gross Shorts:10,8781,285864
– Long to Short Ratio:1.1 to 10.0 to 11.2 to 1
NET POSITION TREND:
– Strength Index Score (3 Year Range Pct):94.85.217.4
– Strength Index Reading (3 Year Range):Bullish-ExtremeBearish-ExtremeBearish-Extreme
NET POSITION MOVEMENT INDEX:
– 6-Week Change in Strength Index:19.5-46.7-3.5


Article By InvestMacroReceive our weekly COT Newsletter

*COT Report: The COT data, released weekly to the public each Friday, is updated through the most recent Tuesday (data is 3 days old) and shows a quick view of how large speculators or non-commercials (for-profit traders) were positioned in the futures markets.

The CFTC categorizes trader positions according to commercial hedgers (traders who use futures contracts for hedging as part of the business), non-commercials (large traders who speculate to realize trading profits) and nonreportable traders (usually small traders/speculators) as well as their open interest (contracts open in the market at time of reporting). See CFTC criteria here.

Large COT Speculators raise 10-Year Treasury Bond bearish bets as prices drop

By InvestMacro

Large COT Speculators raise 10-Year Treasury Bond bearish bets as price drops

Here are the latest charts and statistics for the Commitment of Traders (COT) reports data published by the Commodities Futures Trading Commission (CFTC).

The latest COT data is updated through Tuesday September 27th and shows a quick view of how large traders (for-profit speculators and commercial hedgers) were positioned in the futures markets.

Weekly Speculator Changes sees large drop for 10-Year Bond

Weekly Speculator Changes sees large drop for 10-Year Bond

The COT bond market speculator bets were slightly higher this week as five out of the eight bond markets we cover had higher positioning this week while three markets had lower contracts.

Leading the gains for the bond markets was the Fed Funds (78,319 contracts) and the Eurodollar (63,996 contracts) with the 5-Year Bond (51,838 contracts), the 2-Year Bond (22,538 contracts) and the Long US Bond (2,987 contracts) also showing positive weeks.

The bond markets leading the declines in speculator bets this week was the 10-Year Bond (-135,602 contracts) with the Ultra 10-Year (-30,952 contracts) and the Ultra US Bond (-15,994 contracts) also registering lower bets on the week.

Highlighting the COT Bonds data is the sharp drop in the 10-Year Bond large speculator contracts this week. Speculator bets fell sharply by over -135,000 contracts and halted a 3-week streak of improving speculator positions. The recent improvement in positioning brought the overall speculator standing to the least bearish level in eight weeks (dipping below -230,000 contracts last week). This week’s sentiment decline pushes the overall spec level back above the -350,000 contract threshold and the speculator position remains in a bearish extreme level compared to the past three years (see strength scores in sections below). The bond market prices have continued to sell off as the Federal Reserve (and global central banks) have been sharply and consistently raising their benchmark interest rates to fight the effects of inflation. The 10-Year futures price this week closed at the lowest level since 2008 while the 10-Year yield is currently at 3.83 percent (as bond prices fall, yields rise).


Data Snapshot of Bond Market Traders | Columns Legend
Sep-27-2022OIOI-IndexSpec-NetSpec-IndexCom-NetCOM-IndexSmalls-NetSmalls-Index
Eurodollar8,302,5170-2,159,775132,415,33084-255,55548
FedFunds1,756,96961102,48352-86,40549-16,07819
2-Year2,028,93111-319,87718425,57098-105,6935
Long T-Bond1,213,68047-96,5525368,2683528,28475
10-Year3,766,78248-365,19217409,93871-44,74669
5-Year3,999,39051-441,96619567,48882-125,52246


Strength Scores

Strength Scores (a normalized measure of Speculator positions over a 3-Year range, from 0 to 100 where above 80 is extreme bullish and below 20 is extreme bearish) showed that the US Treasury Bond (53.2 percent) and the Fed Funds (52.3 percent) lead the bonds and are the only two markets above their 3-year midpoint (50 percent is the midpoint).

On the downside, the Ultra 10-Year Bond (13.3 percent) and the Eurodollar (13.4 percent) come in at the lowest strength levels currently followed by the 10-Year Bond (16.9 percent) and the 2-Year Bond (17.7 percent). All four of these markets are in extreme bearish strength levels at scores below 20 percent.

Strength Statistics:
Fed Funds (52.3 percent) vs Fed Funds previous week (42.6 percent)
2-Year Bond (17.7 percent) vs 2-Year Bond previous week (13.1 percent)
5-Year Bond (18.7 percent) vs 5-Year Bond previous week (10.8 percent)
10-Year Bond (16.9 percent) vs 10-Year Bond previous week (37.5 percent)
Ultra 10-Year Bond (13.3 percent) vs Ultra 10-Year Bond previous week (21.3 percent)
US Treasury Bond (53.2 percent) vs US Treasury Bond previous week (52.2 percent)
Ultra US Treasury Bond (29.4 percent) vs Ultra US Treasury Bond previous week (35.9 percent)
Eurodollar (13.4 percent) vs Eurodollar previous week (12.2 percent)

Strength Trends

Strength Score Trends (or move index, calculates the 6-week changes in strength scores) showed that the Eurodollar (13.1 percent) leads the past six weeks trends for bonds this week. The 5-Year Bond (3.8 percent) and the Fed Funds (1.7 percent) fill out the other positive movers in the latest trends data.

The 2-Year Bond (-21.4 percent) leads the downside trend scores currently while the next markets with lower trend scores were the US Treasury Bond (-16.0 percent), the Ultra 10-Year Bond (-7.2 percent) and the Ultra US Treasury Bond (-2.9 percent).

Strength Trend Statistics:
Fed Funds (1.7 percent) vs Fed Funds previous week (2.9 percent)
2-Year Bond (-21.4 percent) vs 2-Year Bond previous week (-34.4 percent)
5-Year Bond (3.8 percent) vs 5-Year Bond previous week (-21.6 percent)
10-Year Bond (-0.3 percent) vs 10-Year Bond previous week (8.6 percent)
Ultra 10-Year Bond (-7.2 percent) vs Ultra 10-Year Bond previous week (4.6 percent)
US Treasury Bond (-16.0 percent) vs US Treasury Bond previous week (-16.9 percent)
Ultra US Treasury Bond (-2.9 percent) vs Ultra US Treasury Bond previous week (-1.9 percent)
Eurodollar (13.1 percent) vs Eurodollar previous week (12.2 percent)


Individual Markets:

3-Month Eurodollars Futures:

Eurodollar Bonds Futures COT ChartThe 3-Month Eurodollars large speculator standing this week came in at a net position of -2,159,775 contracts in the data reported through Tuesday. This was a weekly lift of 63,996 contracts from the previous week which had a total of -2,223,771 net contracts.

This week’s current strength score (the trader positioning range over the past three years, measured from 0 to 100) shows the speculators are currently Bearish-Extreme with a score of 13.4 percent. The commercials are Bullish-Extreme with a score of 84.2 percent and the small traders (not shown in chart) are Bearish with a score of 48.2 percent.

3-Month Eurodollars StatisticsSPECULATORSCOMMERCIALSSMALL TRADERS
– Percent of Open Interest Longs:7.568.84.8
– Percent of Open Interest Shorts:33.539.77.9
– Net Position:-2,159,7752,415,330-255,555
– Gross Longs:622,8925,714,545397,316
– Gross Shorts:2,782,6673,299,215652,871
– Long to Short Ratio:0.2 to 11.7 to 10.6 to 1
NET POSITION TREND:
– Strength Index Score (3 Year Range Pct):13.484.248.2
– Strength Index Reading (3 Year Range):Bearish-ExtremeBullish-ExtremeBearish
NET POSITION MOVEMENT INDEX:
– 6-Week Change in Strength Index:13.1-14.118.3


30-Day Federal Funds Futures:

Federal Funds 30-Day Bonds Futures COT ChartThe 30-Day Federal Funds large speculator standing this week came in at a net position of 102,483 contracts in the data reported through Tuesday. This was a weekly gain of 78,319 contracts from the previous week which had a total of 24,164 net contracts.

This week’s current strength score (the trader positioning range over the past three years, measured from 0 to 100) shows the speculators are currently Bullish with a score of 52.3 percent. The commercials are Bearish with a score of 49.4 percent and the small traders (not shown in chart) are Bearish-Extreme with a score of 18.7 percent.

30-Day Federal Funds StatisticsSPECULATORSCOMMERCIALSSMALL TRADERS
– Percent of Open Interest Longs:15.171.51.7
– Percent of Open Interest Shorts:9.376.52.6
– Net Position:102,483-86,405-16,078
– Gross Longs:265,5401,257,03229,182
– Gross Shorts:163,0571,343,43745,260
– Long to Short Ratio:1.6 to 10.9 to 10.6 to 1
NET POSITION TREND:
– Strength Index Score (3 Year Range Pct):52.349.418.7
– Strength Index Reading (3 Year Range):BullishBearishBearish-Extreme
NET POSITION MOVEMENT INDEX:
– 6-Week Change in Strength Index:1.70.8-52.4


2-Year Treasury Note Futures:

2-Year Treasury Bonds Futures COT ChartThe 2-Year Treasury Note large speculator standing this week came in at a net position of -319,877 contracts in the data reported through Tuesday. This was a weekly increase of 22,538 contracts from the previous week which had a total of -342,415 net contracts.

This week’s current strength score (the trader positioning range over the past three years, measured from 0 to 100) shows the speculators are currently Bearish-Extreme with a score of 17.7 percent. The commercials are Bullish-Extreme with a score of 97.5 percent and the small traders (not shown in chart) are Bearish-Extreme with a score of 4.8 percent.

2-Year Treasury Note StatisticsSPECULATORSCOMMERCIALSSMALL TRADERS
– Percent of Open Interest Longs:7.682.47.7
– Percent of Open Interest Shorts:23.461.412.9
– Net Position:-319,877425,570-105,693
– Gross Longs:154,8871,671,856156,986
– Gross Shorts:474,7641,246,286262,679
– Long to Short Ratio:0.3 to 11.3 to 10.6 to 1
NET POSITION TREND:
– Strength Index Score (3 Year Range Pct):17.797.54.8
– Strength Index Reading (3 Year Range):Bearish-ExtremeBullish-ExtremeBearish-Extreme
NET POSITION MOVEMENT INDEX:
– 6-Week Change in Strength Index:-21.434.5-30.6


5-Year Treasury Note Futures:

5-Year Treasury Bonds Futures COT ChartThe 5-Year Treasury Note large speculator standing this week came in at a net position of -441,966 contracts in the data reported through Tuesday. This was a weekly increase of 51,838 contracts from the previous week which had a total of -493,804 net contracts.

This week’s current strength score (the trader positioning range over the past three years, measured from 0 to 100) shows the speculators are currently Bearish-Extreme with a score of 18.7 percent. The commercials are Bullish-Extreme with a score of 82.5 percent and the small traders (not shown in chart) are Bearish with a score of 46.5 percent.

5-Year Treasury Note StatisticsSPECULATORSCOMMERCIALSSMALL TRADERS
– Percent of Open Interest Longs:7.284.27.5
– Percent of Open Interest Shorts:18.270.010.7
– Net Position:-441,966567,488-125,522
– Gross Longs:286,4923,365,684300,659
– Gross Shorts:728,4582,798,196426,181
– Long to Short Ratio:0.4 to 11.2 to 10.7 to 1
NET POSITION TREND:
– Strength Index Score (3 Year Range Pct):18.782.546.5
– Strength Index Reading (3 Year Range):Bearish-ExtremeBullish-ExtremeBearish
NET POSITION MOVEMENT INDEX:
– 6-Week Change in Strength Index:3.8-6.67.8


10-Year Treasury Note Futures:

10-Year Treasury Notes Bonds Futures COT ChartThe 10-Year Treasury Note large speculator standing this week came in at a net position of -365,192 contracts in the data reported through Tuesday. This was a weekly decrease of -135,602 contracts from the previous week which had a total of -229,590 net contracts.

This week’s current strength score (the trader positioning range over the past three years, measured from 0 to 100) shows the speculators are currently Bearish-Extreme with a score of 16.9 percent. The commercials are Bullish with a score of 70.6 percent and the small traders (not shown in chart) are Bullish with a score of 69.4 percent.

10-Year Treasury Note StatisticsSPECULATORSCOMMERCIALSSMALL TRADERS
– Percent of Open Interest Longs:8.479.69.8
– Percent of Open Interest Shorts:18.168.711.0
– Net Position:-365,192409,938-44,746
– Gross Longs:316,4782,998,569367,874
– Gross Shorts:681,6702,588,631412,620
– Long to Short Ratio:0.5 to 11.2 to 10.9 to 1
NET POSITION TREND:
– Strength Index Score (3 Year Range Pct):16.970.669.4
– Strength Index Reading (3 Year Range):Bearish-ExtremeBullishBullish
NET POSITION MOVEMENT INDEX:
– 6-Week Change in Strength Index:-0.3-7.214.9


Ultra 10-Year Notes Futures:

Ultra 10-Year Treasury Notes Bonds Futures COT ChartThe Ultra 10-Year Notes large speculator standing this week came in at a net position of -59,760 contracts in the data reported through Tuesday. This was a weekly fall of -30,952 contracts from the previous week which had a total of -28,808 net contracts.

This week’s current strength score (the trader positioning range over the past three years, measured from 0 to 100) shows the speculators are currently Bearish-Extreme with a score of 13.3 percent. The commercials are Bullish-Extreme with a score of 81.7 percent and the small traders (not shown in chart) are Bullish with a score of 59.8 percent.

Ultra 10-Year Notes StatisticsSPECULATORSCOMMERCIALSSMALL TRADERS
– Percent of Open Interest Longs:7.282.89.6
– Percent of Open Interest Shorts:11.571.017.0
– Net Position:-59,760161,207-101,447
– Gross Longs:98,7761,136,474132,163
– Gross Shorts:158,536975,267233,610
– Long to Short Ratio:0.6 to 11.2 to 10.6 to 1
NET POSITION TREND:
– Strength Index Score (3 Year Range Pct):13.381.759.8
– Strength Index Reading (3 Year Range):Bearish-ExtremeBullish-ExtremeBullish
NET POSITION MOVEMENT INDEX:
– 6-Week Change in Strength Index:-7.20.217.9


US Treasury Bonds Futures:

US Year Treasury Notes Long Bonds Futures COT ChartThe US Treasury Bonds large speculator standing this week came in at a net position of -96,552 contracts in the data reported through Tuesday. This was a weekly boost of 2,987 contracts from the previous week which had a total of -99,539 net contracts.

This week’s current strength score (the trader positioning range over the past three years, measured from 0 to 100) shows the speculators are currently Bullish with a score of 53.2 percent. The commercials are Bearish with a score of 35.0 percent and the small traders (not shown in chart) are Bullish with a score of 75.0 percent.

US Treasury Bonds StatisticsSPECULATORSCOMMERCIALSSMALL TRADERS
– Percent of Open Interest Longs:5.978.314.2
– Percent of Open Interest Shorts:13.872.711.9
– Net Position:-96,55268,26828,284
– Gross Longs:71,317950,661172,811
– Gross Shorts:167,869882,393144,527
– Long to Short Ratio:0.4 to 11.1 to 11.2 to 1
NET POSITION TREND:
– Strength Index Score (3 Year Range Pct):53.235.075.0
– Strength Index Reading (3 Year Range):BullishBearishBullish
NET POSITION MOVEMENT INDEX:
– 6-Week Change in Strength Index:-16.016.81.7


Ultra US Treasury Bonds Futures:

Ultra US Year Treasury Notes Long Bonds Futures COT ChartThe Ultra US Treasury Bonds large speculator standing this week came in at a net position of -381,907 contracts in the data reported through Tuesday. This was a weekly decline of -15,994 contracts from the previous week which had a total of -365,913 net contracts.

This week’s current strength score (the trader positioning range over the past three years, measured from 0 to 100) shows the speculators are currently Bearish with a score of 29.4 percent. The commercials are Bullish with a score of 79.3 percent and the small traders (not shown in chart) are Bullish with a score of 61.3 percent.

Ultra US Treasury Bonds StatisticsSPECULATORSCOMMERCIALSSMALL TRADERS
– Percent of Open Interest Longs:5.283.111.0
– Percent of Open Interest Shorts:32.259.47.8
– Net Position:-381,907335,91245,995
– Gross Longs:73,4021,176,845156,277
– Gross Shorts:455,309840,933110,282
– Long to Short Ratio:0.2 to 11.4 to 11.4 to 1
NET POSITION TREND:
– Strength Index Score (3 Year Range Pct):29.479.361.3
– Strength Index Reading (3 Year Range):BearishBullishBullish
NET POSITION MOVEMENT INDEX:
– 6-Week Change in Strength Index:-2.9-0.86.2


Article By InvestMacroReceive our weekly COT Newsletter

*COT Report: The COT data, released weekly to the public each Friday, is updated through the most recent Tuesday (data is 3 days old) and shows a quick view of how large speculators or non-commercials (for-profit traders) were positioned in the futures markets.

The CFTC categorizes trader positions according to commercial hedgers (traders who use futures contracts for hedging as part of the business), non-commercials (large traders who speculate to realize trading profits) and nonreportable traders (usually small traders/speculators) as well as their open interest (contracts open in the market at time of reporting). See CFTC criteria here.

Metals Speculators continued to trim Gold bets to 179-week low

By InvestMacro

Here are the latest charts and statistics for the Commitment of Traders (COT) data published by the Commodities Futures Trading Commission (CFTC).

The latest COT data is updated through Tuesday September 27th and shows a quick view of how large traders (for-profit speculators and commercial entities) were positioned in the futures markets.

Weekly Speculator Changes led by Silver & Palladium

The COT precious metals speculator bets were slightly lower this week as two out of the five metals markets we cover had higher positioning this week while three markets had lower contracts.

Leading the gains for the precious metals markets was Silver (2,398 contracts) with Palladium (250 contracts) showing a small positive week.

The metals markets leading the declines in speculator bets this week were Gold (-13,641 contracts) and Copper (-7,470 contracts) with Platinum (-2,229 contracts) also registering lower bets on the week.

Highlighting the COT Metals data continues to be the downtrend of the Gold speculator positioning. Speculators dropped their Gold bets for the seventh consecutive week this week and that has now diminished the bullish Gold speculator position by a total of -90,770 contracts over the past 7-week period. This sentiment decline has pushed the overall Gold speculator standing (currently at +52,081 contracts) down to the lowest level of the past 179 weeks, dating back to April 23rd of 2019.

The Gold spot price has been in a downtrend in the second half of this year and has fallen by approximately 20 percent since reaching a high of approximately $2070.60 in March. This week saw the Gold price bounce off the $1615 support level to finish the week over 1 percent higher.


Data Snapshot of Commodity Market Traders | Columns Legend
Sep-27-2022OIOI-IndexSpec-NetSpec-IndexCom-NetCOM-IndexSmalls-NetSmalls-Index
WTI Crude1,504,9913226,0804-246,8729820,79235
Gold457,061152,0810-62,13810010,0571
Silver129,000075815-6,860896,1020
Copper173,66113-27,7561628,88486-1,12819
Palladium6,0801-831181,23682-40520
Platinum58,994201619-2,525932,3640
Natural Gas943,2410-152,12433121,1356930,98954
Brent167,44414-41,2574240,4906176720
Heating Oil290,2653111,41459-21,6254810,21134
Soybeans699,3112780,05138-50,20671-29,84521
Corn1,347,27811296,62268-229,43639-67,1864
Coffee185,149144,68077-46,664271,98418
Sugar710,887248,60147-56,409577,80818
Wheat290,77122,735234,67566-7,41072


Strength Scores

Strength scores (a measure of the 3-Year range of Speculator positions, from 0 to 100 where above 80 is extreme bullish and below 20 is extreme bearish) showed that Palladium (18.2 percent) took the lead with the highest current score in the metals category (Copper had led the past bunch of months).

The metals category continues to have a very rough time in this investing environment and the speculators sentiment continues to be lacking as all five of the metals markets are in bearish extreme levels with scores below 20 percent.

The lowest scores are led by Gold at 0.0 percent (at the bottom of its 3-year range) and is followed by Platinum (9.3 percent), Silver (14.9 percent) and Copper (15.9 percent).

Strength Statistics:
Gold (0.0 percent) vs Gold previous week (4.5 percent)
Silver (14.9 percent) vs Silver previous week (12.3 percent)
Copper (15.9 percent) vs Copper previous week (21.7 percent)
Platinum (9.3 percent) vs Platinum previous week (12.3 percent)
Palladium (18.2 percent) vs Palladium previous week (16.8 percent)

Strength Trends

Strength Score Trends (or move index, calculates the 6-week changes in strength scores) showed that Palladium (4.3 percent) leads the past six weeks trends for metals this week. Copper (0.4 percent) fills out the only other positive mover in the latest trends data.

Gold (-29.5 percent) leads the downside trend scores currently while the next market with lower trend scores were the Platinum (-3.7 percent) followed by Silver (-3.0 percent).


Move Statistics:
Gold (-29.5 percent) vs Gold previous week (-25.6 percent)
Silver (-3.0 percent) vs Silver previous week (-5.0 percent)
Copper (0.4 percent) vs Copper previous week (6.4 percent)
Platinum (-3.7 percent) vs Platinum previous week (2.1 percent)
Palladium (4.3 percent) vs Palladium previous week (5.0 percent)


Individual Markets:

Gold Comex Futures:

Gold Futures COT ChartThe Gold Comex Futures large speculator standing this week resulted in a net position of 52,081 contracts in the data reported through Tuesday. This was a weekly decrease of -13,641 contracts from the previous week which had a total of 65,722 net contracts.

This week’s current strength score (the trader positioning range over the past three years, measured from 0 to 100) shows the speculators are currently Bearish-Extreme with a score of 0.0 percent. The commercials are Bullish-Extreme with a score of 100.0 percent and the small traders (not shown in chart) are Bearish-Extreme with a score of 0.9 percent.

Gold Futures StatisticsSPECULATORSCOMMERCIALSSMALL TRADERS
– Percent of Open Interest Longs:45.330.58.8
– Percent of Open Interest Shorts:33.944.16.6
– Net Position:52,081-62,13810,057
– Gross Longs:207,154139,36140,325
– Gross Shorts:155,073201,49930,268
– Long to Short Ratio:1.3 to 10.7 to 11.3 to 1
NET POSITION TREND:
– Strength Index Score (3 Year Range Pct):0.0100.00.9
– Strength Index Reading (3 Year Range):Bearish-ExtremeBullish-ExtremeBearish-Extreme
NET POSITION MOVEMENT INDEX:
– 6-Week Change in Strength Index:-29.528.3-6.5


Silver Comex Futures:

Silver Futures COT ChartThe Silver Comex Futures large speculator standing this week resulted in a net position of 758 contracts in the data reported through Tuesday. This was a weekly boost of 2,398 contracts from the previous week which had a total of -1,640 net contracts.

This week’s current strength score (the trader positioning range over the past three years, measured from 0 to 100) shows the speculators are currently Bearish-Extreme with a score of 14.9 percent. The commercials are Bullish-Extreme with a score of 88.7 percent and the small traders (not shown in chart) are Bearish-Extreme with a score of 0.0 percent.

Silver Futures StatisticsSPECULATORSCOMMERCIALSSMALL TRADERS
– Percent of Open Interest Longs:38.738.016.0
– Percent of Open Interest Shorts:38.243.311.3
– Net Position:758-6,8606,102
– Gross Longs:49,98448,99320,681
– Gross Shorts:49,22655,85314,579
– Long to Short Ratio:1.0 to 10.9 to 11.4 to 1
NET POSITION TREND:
– Strength Index Score (3 Year Range Pct):14.988.70.0
– Strength Index Reading (3 Year Range):Bearish-ExtremeBullish-ExtremeBearish-Extreme
NET POSITION MOVEMENT INDEX:
– 6-Week Change in Strength Index:-3.05.3-13.6


Copper Grade #1 Futures:

Copper Futures COT ChartThe Copper Grade #1 Futures large speculator standing this week resulted in a net position of -27,756 contracts in the data reported through Tuesday. This was a weekly lowering of -7,470 contracts from the previous week which had a total of -20,286 net contracts.

This week’s current strength score (the trader positioning range over the past three years, measured from 0 to 100) shows the speculators are currently Bearish-Extreme with a score of 15.9 percent. The commercials are Bullish-Extreme with a score of 85.8 percent and the small traders (not shown in chart) are Bearish-Extreme with a score of 18.8 percent.

Copper Futures StatisticsSPECULATORSCOMMERCIALSSMALL TRADERS
– Percent of Open Interest Longs:29.250.28.4
– Percent of Open Interest Shorts:45.233.69.1
– Net Position:-27,75628,884-1,128
– Gross Longs:50,72687,18814,608
– Gross Shorts:78,48258,30415,736
– Long to Short Ratio:0.6 to 11.5 to 10.9 to 1
NET POSITION TREND:
– Strength Index Score (3 Year Range Pct):15.985.818.8
– Strength Index Reading (3 Year Range):Bearish-ExtremeBullish-ExtremeBearish-Extreme
NET POSITION MOVEMENT INDEX:
– 6-Week Change in Strength Index:0.4-0.0-2.4


Platinum Futures:

Platinum Futures COT ChartThe Platinum Futures large speculator standing this week resulted in a net position of 161 contracts in the data reported through Tuesday. This was a weekly fall of -2,229 contracts from the previous week which had a total of 2,390 net contracts.

This week’s current strength score (the trader positioning range over the past three years, measured from 0 to 100) shows the speculators are currently Bearish-Extreme with a score of 9.3 percent. The commercials are Bullish-Extreme with a score of 92.8 percent and the small traders (not shown in chart) are Bearish-Extreme with a score of 0.0 percent.

Platinum Futures StatisticsSPECULATORSCOMMERCIALSSMALL TRADERS
– Percent of Open Interest Longs:40.642.311.3
– Percent of Open Interest Shorts:40.346.67.3
– Net Position:161-2,5252,364
– Gross Longs:23,94424,9426,675
– Gross Shorts:23,78327,4674,311
– Long to Short Ratio:1.0 to 10.9 to 11.5 to 1
NET POSITION TREND:
– Strength Index Score (3 Year Range Pct):9.392.80.0
– Strength Index Reading (3 Year Range):Bearish-ExtremeBullish-ExtremeBearish-Extreme
NET POSITION MOVEMENT INDEX:
– 6-Week Change in Strength Index:-3.74.8-14.1


Palladium Futures:

Palladium Futures COT ChartThe Palladium Futures large speculator standing this week resulted in a net position of -831 contracts in the data reported through Tuesday. This was a weekly advance of 250 contracts from the previous week which had a total of -1,081 net contracts.

This week’s current strength score (the trader positioning range over the past three years, measured from 0 to 100) shows the speculators are currently Bearish-Extreme with a score of 18.2 percent. The commercials are Bullish-Extreme with a score of 81.7 percent and the small traders (not shown in chart) are Bearish with a score of 20.4 percent.

Palladium Futures StatisticsSPECULATORSCOMMERCIALSSMALL TRADERS
– Percent of Open Interest Longs:25.057.915.2
– Percent of Open Interest Shorts:38.737.621.8
– Net Position:-8311,236-405
– Gross Longs:1,5193,523922
– Gross Shorts:2,3502,2871,327
– Long to Short Ratio:0.6 to 11.5 to 10.7 to 1
NET POSITION TREND:
– Strength Index Score (3 Year Range Pct):18.281.720.4
– Strength Index Reading (3 Year Range):Bearish-ExtremeBullish-ExtremeBearish
NET POSITION MOVEMENT INDEX:
– 6-Week Change in Strength Index:4.3-1.7-27.1


Article By InvestMacroReceive our weekly COT Newsletter

*COT Report: The COT data, released weekly to the public each Friday, is updated through the most recent Tuesday (data is 3 days old) and shows a quick view of how large speculators or non-commercials (for-profit traders) were positioned in the futures markets.

The CFTC categorizes trader positions according to commercial hedgers (traders who use futures contracts for hedging as part of the business), non-commercials (large traders who speculate to realize trading profits) and nonreportable traders (usually small traders/speculators) as well as their open interest (contracts open in the market at time of reporting). See CFTC criteria here.

Soft Commodities Speculator Bets go lower led by Soybean Meal, Lean Hogs & Live Cattle

By InvestMacro

Soft Commodities Speculator Bets go lower led by Soybean Meal, Lean Hogs & Live Cattle

Here are the latest charts and statistics for the Commitment of Traders (COT) reports data published by the Commodities Futures Trading Commission (CFTC).

The latest COT data is updated through Tuesday September 27th and shows a quick view of how large traders (for-profit speculators and commercial entities) were positioned in the futures markets.

Weekly Speculator Changes go lower this week led by Soybean Meal, Lean Hogs & Live Cattle

The COT soft commodities speculator bets were lower this week as three out of the eleven soft commodities markets we cover had higher positioning this week while the other eight markets had decreases in contracts.

Leading the gains for soft commodities markets was Sugar (11,256 contracts) with Wheat (6,764 contracts) and Coffee (3,608 contracts) also showing positive weeks.

The softs market leading the declines in speculator bets this week was Soybean Meal (-11,395 contracts) with Lean Hogs (-10,484 contracts), Live Cattle (-9,400 contracts), Corn (-9,055 contracts), Soybeans (-4,722 contracts), Cocoa (-3,818 contracts), Soybean Oil (-2,424 contracts) and Cotton (-1,875 contracts) also registering lower bets on the week.


Data Snapshot of Commodity Market Traders | Columns Legend
Sep-27-2022OIOI-IndexSpec-NetSpec-IndexCom-NetCOM-IndexSmalls-NetSmalls-Index
WTI Crude1,504,9913226,0804-246,8729820,79235
Gold457,061152,0810-62,13810010,0571
Silver129,000075815-6,860896,1020
Copper173,66113-27,7561628,88486-1,12819
Palladium6,0801-831181,23682-40520
Platinum58,994201619-2,525932,3640
Natural Gas943,2410-152,12433121,1356930,98954
Brent167,44414-41,2574240,4906176720
Heating Oil290,2653111,41459-21,6254810,21134
Soybeans699,3112780,05138-50,20671-29,84521
Corn1,347,27811296,62268-229,43639-67,1864
Coffee185,149144,68077-46,664271,98418
Sugar710,887248,60147-56,409577,80818
Wheat290,77122,735234,67566-7,41072


Strength Scores

Strength Scores (a normalized measure of Speculator positions over a 3-Year range, from 0 to 100 where above 80 is extreme bullish and below 20 is extreme bearish) showed that Soybean Meal (91.5 percent) leads the soft commodity markets and remains in a bullish extreme position (above 80 percent). Coffee (77.4 percent) and Corn (67.9 percent) come in as the next highest soft commodity markets in strength scores.

On the downside, Cocoa (7.2 percent) comes in at the lowest strength level currently and is in a bearish extreme position with a score below 20 percent. The next markets with the lowest scores are Wheat (22.6 percent) and Soybeans (37.9 percent).


Strength Statistics:
Corn (67.9 percent) vs Corn previous week (69.1 percent)
Sugar (46.6 percent) vs Sugar previous week (44.3 percent)
Coffee (77.4 percent) vs Coffee previous week (74.3 percent)
Soybeans (37.9 percent) vs Soybeans previous week (39.4 percent)
Soybean Oil (40.7 percent) vs Soybean Oil previous week (42.4 percent)
Soybean Meal (91.5 percent) vs Soybean Meal previous week (97.9 percent)
Live Cattle (55.8 percent) vs Live Cattle previous week (67.6 percent)
Lean Hogs (49.9 percent) vs Lean Hogs previous week (61.3 percent)
Cotton (45.2 percent) vs Cotton previous week (46.5 percent)
Cocoa (7.2 percent) vs Cocoa previous week (11.0 percent)
Wheat (22.6 percent) vs Wheat previous week (13.8 percent)


Strength Trends

Strength Score Trends (or move index, calculates the 6-week changes in strength scores) showed that Corn (9.8 percent), Coffee (9.7 percent) and Soybean Oil (9.6 percent) lead the past six weeks trends for soft commodity markets. Wheat (6.0 percent) and Soybean Meal (1.6 percent) round out the other positive movers in the latest trends data.

Lean Hogs (-20.0 percent) leads the downside trend scores currently while the next market with lower trend scores was Cocoa (-6.9 percent) followed by Cotton (-1.5 percent).


Strength Trend Statistics:
Corn (9.8 percent) vs Corn previous week (12.1 percent)
Sugar (-0.3 percent) vs Sugar previous week (2.3 percent)
Coffee (9.7 percent) vs Coffee previous week (9.2 percent)
Soybeans (-1.0 percent) vs Soybeans previous week (-1.3 percent)
Soybean Oil (9.6 percent) vs Soybean Oil previous week (18.2 percent)
Soybean Meal (1.6 percent) vs Soybean Meal previous week (8.0 percent)
Live Cattle (-0.5 percent) vs Live Cattle previous week (27.3 percent)
Lean Hogs (-20.0 percent) vs Lean Hogs previous week (-0.1 percent)
Cotton (-1.5 percent) vs Cotton previous week (5.3 percent)
Cocoa (-6.9 percent) vs Cocoa previous week (-0.4 percent)
Wheat (6.0 percent) vs Wheat previous week (-0.8 percent)


Individual Markets:

CORN Futures:

CORN Futures COT ChartThe CORN large speculator standing this week resulted in a net position of 296,622 contracts in the data reported through Tuesday. This was a weekly fall of -9,055 contracts from the previous week which had a total of 305,677 net contracts.

This week’s current strength score (the trader positioning range over the past three years, measured from 0 to 100) shows the speculators are currently Bullish with a score of 67.9 percent. The commercials are Bearish with a score of 39.2 percent and the small traders (not shown in chart) are Bearish-Extreme with a score of 4.4 percent.

CORN Futures StatisticsSPECULATORSCOMMERCIALSSMALL TRADERS
– Percent of Open Interest Longs:30.944.88.7
– Percent of Open Interest Shorts:8.961.913.7
– Net Position:296,622-229,436-67,186
– Gross Longs:415,961604,188117,870
– Gross Shorts:119,339833,624185,056
– Long to Short Ratio:3.5 to 10.7 to 10.6 to 1
NET POSITION TREND:
– Strength Index Score (3 Year Range Pct):67.939.24.4
– Strength Index Reading (3 Year Range):BullishBearishBearish-Extreme
NET POSITION MOVEMENT INDEX:
– 6-Week Change in Strength Index:9.8-9.0-7.7


SUGAR Futures:

SUGAR Futures COT ChartThe SUGAR large speculator standing this week resulted in a net position of 48,601 contracts in the data reported through Tuesday. This was a weekly boost of 11,256 contracts from the previous week which had a total of 37,345 net contracts.

This week’s current strength score (the trader positioning range over the past three years, measured from 0 to 100) shows the speculators are currently Bearish with a score of 46.6 percent. The commercials are Bullish with a score of 57.5 percent and the small traders (not shown in chart) are Bearish-Extreme with a score of 17.5 percent.

SUGAR Futures StatisticsSPECULATORSCOMMERCIALSSMALL TRADERS
– Percent of Open Interest Longs:24.154.99.8
– Percent of Open Interest Shorts:17.262.88.7
– Net Position:48,601-56,4097,808
– Gross Longs:171,124390,23269,802
– Gross Shorts:122,523446,64161,994
– Long to Short Ratio:1.4 to 10.9 to 11.1 to 1
NET POSITION TREND:
– Strength Index Score (3 Year Range Pct):46.657.517.5
– Strength Index Reading (3 Year Range):BearishBullishBearish-Extreme
NET POSITION MOVEMENT INDEX:
– 6-Week Change in Strength Index:-0.31.0-5.0


COFFEE Futures:

COFFEE Futures COT ChartThe COFFEE large speculator standing this week resulted in a net position of 44,680 contracts in the data reported through Tuesday. This was a weekly rise of 3,608 contracts from the previous week which had a total of 41,072 net contracts.

This week’s current strength score (the trader positioning range over the past three years, measured from 0 to 100) shows the speculators are currently Bullish with a score of 77.4 percent. The commercials are Bearish with a score of 26.9 percent and the small traders (not shown in chart) are Bearish-Extreme with a score of 17.7 percent.

COFFEE Futures StatisticsSPECULATORSCOMMERCIALSSMALL TRADERS
– Percent of Open Interest Longs:30.044.54.9
– Percent of Open Interest Shorts:5.869.73.8
– Net Position:44,680-46,6641,984
– Gross Longs:55,45482,4489,049
– Gross Shorts:10,774129,1127,065
– Long to Short Ratio:5.1 to 10.6 to 11.3 to 1
NET POSITION TREND:
– Strength Index Score (3 Year Range Pct):77.426.917.7
– Strength Index Reading (3 Year Range):BullishBearishBearish-Extreme
NET POSITION MOVEMENT INDEX:
– 6-Week Change in Strength Index:9.7-10.31.3


SOYBEANS Futures:

SOYBEANS Futures COT ChartThe SOYBEANS large speculator standing this week resulted in a net position of 80,051 contracts in the data reported through Tuesday. This was a weekly decline of -4,722 contracts from the previous week which had a total of 84,773 net contracts.

This week’s current strength score (the trader positioning range over the past three years, measured from 0 to 100) shows the speculators are currently Bearish with a score of 37.9 percent. The commercials are Bullish with a score of 71.2 percent and the small traders (not shown in chart) are Bearish with a score of 20.6 percent.

SOYBEANS Futures StatisticsSPECULATORSCOMMERCIALSSMALL TRADERS
– Percent of Open Interest Longs:21.452.66.2
– Percent of Open Interest Shorts:10.059.810.4
– Net Position:80,051-50,206-29,845
– Gross Longs:149,774367,74443,219
– Gross Shorts:69,723417,95073,064
– Long to Short Ratio:2.1 to 10.9 to 10.6 to 1
NET POSITION TREND:
– Strength Index Score (3 Year Range Pct):37.971.220.6
– Strength Index Reading (3 Year Range):BearishBullishBearish
NET POSITION MOVEMENT INDEX:
– 6-Week Change in Strength Index:-1.00.42.9


SOYBEAN OIL Futures:

SOYBEAN OIL Futures COT ChartThe SOYBEAN OIL large speculator standing this week resulted in a net position of 54,987 contracts in the data reported through Tuesday. This was a weekly decline of -2,424 contracts from the previous week which had a total of 57,411 net contracts.

This week’s current strength score (the trader positioning range over the past three years, measured from 0 to 100) shows the speculators are currently Bearish with a score of 40.7 percent. The commercials are Bullish with a score of 61.9 percent and the small traders (not shown in chart) are Bearish with a score of 35.7 percent.

SOYBEAN OIL Futures StatisticsSPECULATORSCOMMERCIALSSMALL TRADERS
– Percent of Open Interest Longs:22.548.46.9
– Percent of Open Interest Shorts:8.963.55.4
– Net Position:54,987-60,9595,972
– Gross Longs:91,132196,32228,053
– Gross Shorts:36,145257,28122,081
– Long to Short Ratio:2.5 to 10.8 to 11.3 to 1
NET POSITION TREND:
– Strength Index Score (3 Year Range Pct):40.761.935.7
– Strength Index Reading (3 Year Range):BearishBullishBearish
NET POSITION MOVEMENT INDEX:
– 6-Week Change in Strength Index:9.6-8.90.7


SOYBEAN MEAL Futures:

SOYBEAN MEAL Futures COT ChartThe SOYBEAN MEAL large speculator standing this week resulted in a net position of 115,075 contracts in the data reported through Tuesday. This was a weekly reduction of -11,395 contracts from the previous week which had a total of 126,470 net contracts.

This week’s current strength score (the trader positioning range over the past three years, measured from 0 to 100) shows the speculators are currently Bullish-Extreme with a score of 91.5 percent. The commercials are Bearish-Extreme with a score of 11.0 percent and the small traders (not shown in chart) are Bullish with a score of 53.6 percent.

SOYBEAN MEAL Futures StatisticsSPECULATORSCOMMERCIALSSMALL TRADERS
– Percent of Open Interest Longs:33.939.712.3
– Percent of Open Interest Shorts:3.776.16.2
– Net Position:115,075-138,37123,296
– Gross Longs:129,268151,41646,999
– Gross Shorts:14,193289,78723,703
– Long to Short Ratio:9.1 to 10.5 to 12.0 to 1
NET POSITION TREND:
– Strength Index Score (3 Year Range Pct):91.511.053.6
– Strength Index Reading (3 Year Range):Bullish-ExtremeBearish-ExtremeBullish
NET POSITION MOVEMENT INDEX:
– 6-Week Change in Strength Index:1.6-1.3-2.1


LIVE CATTLE Futures:

LIVE CATTLE Futures COT ChartThe LIVE CATTLE large speculator standing this week resulted in a net position of 60,967 contracts in the data reported through Tuesday. This was a weekly decline of -9,400 contracts from the previous week which had a total of 70,367 net contracts.

This week’s current strength score (the trader positioning range over the past three years, measured from 0 to 100) shows the speculators are currently Bullish with a score of 55.8 percent. The commercials are Bearish with a score of 33.4 percent and the small traders (not shown in chart) are Bullish-Extreme with a score of 86.5 percent.

LIVE CATTLE Futures StatisticsSPECULATORSCOMMERCIALSSMALL TRADERS
– Percent of Open Interest Longs:39.633.211.1
– Percent of Open Interest Shorts:18.253.612.0
– Net Position:60,967-58,327-2,640
– Gross Longs:112,89794,74231,567
– Gross Shorts:51,930153,06934,207
– Long to Short Ratio:2.2 to 10.6 to 10.9 to 1
NET POSITION TREND:
– Strength Index Score (3 Year Range Pct):55.833.486.5
– Strength Index Reading (3 Year Range):BullishBearishBullish-Extreme
NET POSITION MOVEMENT INDEX:
– 6-Week Change in Strength Index:-0.50.6-0.0


LEAN HOGS Futures:

LEAN HOGS Futures COT ChartThe LEAN HOGS large speculator standing this week resulted in a net position of 39,631 contracts in the data reported through Tuesday. This was a weekly decline of -10,484 contracts from the previous week which had a total of 50,115 net contracts.

This week’s current strength score (the trader positioning range over the past three years, measured from 0 to 100) shows the speculators are currently Bearish with a score of 49.9 percent. The commercials are Bullish with a score of 56.1 percent and the small traders (not shown in chart) are Bullish with a score of 54.8 percent.

LEAN HOGS Futures StatisticsSPECULATORSCOMMERCIALSSMALL TRADERS
– Percent of Open Interest Longs:40.734.98.8
– Percent of Open Interest Shorts:21.450.312.7
– Net Position:39,631-31,593-8,038
– Gross Longs:83,52171,74118,012
– Gross Shorts:43,890103,33426,050
– Long to Short Ratio:1.9 to 10.7 to 10.7 to 1
NET POSITION TREND:
– Strength Index Score (3 Year Range Pct):49.956.154.8
– Strength Index Reading (3 Year Range):BearishBullishBullish
NET POSITION MOVEMENT INDEX:
– 6-Week Change in Strength Index:-20.021.02.9


COTTON Futures:

COTTON Futures COT ChartThe COTTON large speculator standing this week resulted in a net position of 42,079 contracts in the data reported through Tuesday. This was a weekly reduction of -1,875 contracts from the previous week which had a total of 43,954 net contracts.

This week’s current strength score (the trader positioning range over the past three years, measured from 0 to 100) shows the speculators are currently Bearish with a score of 45.2 percent. The commercials are Bullish with a score of 57.5 percent and the small traders (not shown in chart) are Bearish with a score of 22.8 percent.

COTTON Futures StatisticsSPECULATORSCOMMERCIALSSMALL TRADERS
– Percent of Open Interest Longs:32.150.05.4
– Percent of Open Interest Shorts:12.970.14.5
– Net Position:42,079-44,0161,937
– Gross Longs:70,391109,62911,741
– Gross Shorts:28,312153,6459,804
– Long to Short Ratio:2.5 to 10.7 to 11.2 to 1
NET POSITION TREND:
– Strength Index Score (3 Year Range Pct):45.257.522.8
– Strength Index Reading (3 Year Range):BearishBullishBearish
NET POSITION MOVEMENT INDEX:
– 6-Week Change in Strength Index:-1.53.9-25.5


COCOA Futures:

COCOA Futures COT ChartThe COCOA large speculator standing this week resulted in a net position of -9,759 contracts in the data reported through Tuesday. This was a weekly decrease of -3,818 contracts from the previous week which had a total of -5,941 net contracts.

This week’s current strength score (the trader positioning range over the past three years, measured from 0 to 100) shows the speculators are currently Bearish-Extreme with a score of 7.2 percent. The commercials are Bullish-Extreme with a score of 93.1 percent and the small traders (not shown in chart) are Bearish with a score of 37.5 percent.

COCOA Futures StatisticsSPECULATORSCOMMERCIALSSMALL TRADERS
– Percent of Open Interest Longs:32.745.24.8
– Percent of Open Interest Shorts:35.843.43.5
– Net Position:-9,7595,6604,099
– Gross Longs:102,300141,68914,973
– Gross Shorts:112,059136,02910,874
– Long to Short Ratio:0.9 to 11.0 to 11.4 to 1
NET POSITION TREND:
– Strength Index Score (3 Year Range Pct):7.293.137.5
– Strength Index Reading (3 Year Range):Bearish-ExtremeBullish-ExtremeBearish
NET POSITION MOVEMENT INDEX:
– 6-Week Change in Strength Index:-6.95.415.1


WHEAT Futures:

WHEAT Futures COT ChartThe WHEAT large speculator standing this week resulted in a net position of 2,735 contracts in the data reported through Tuesday. This was a weekly gain of 6,764 contracts from the previous week which had a total of -4,029 net contracts.

This week’s current strength score (the trader positioning range over the past three years, measured from 0 to 100) shows the speculators are currently Bearish with a score of 22.6 percent. The commercials are Bullish with a score of 66.3 percent and the small traders (not shown in chart) are Bullish with a score of 71.9 percent.

WHEAT Futures StatisticsSPECULATORSCOMMERCIALSSMALL TRADERS
– Percent of Open Interest Longs:30.240.79.3
– Percent of Open Interest Shorts:29.339.111.9
– Net Position:2,7354,675-7,410
– Gross Longs:87,885118,36027,059
– Gross Shorts:85,150113,68534,469
– Long to Short Ratio:1.0 to 11.0 to 10.8 to 1
NET POSITION TREND:
– Strength Index Score (3 Year Range Pct):22.666.371.9
– Strength Index Reading (3 Year Range):BearishBullishBullish
NET POSITION MOVEMENT INDEX:
– 6-Week Change in Strength Index:6.0-3.9-9.7


Article By InvestMacroReceive our weekly COT Newsletter

*COT Report: The COT data, released weekly to the public each Friday, is updated through the most recent Tuesday (data is 3 days old) and shows a quick view of how large speculators or non-commercials (for-profit traders) were positioned in the futures markets.

The CFTC categorizes trader positions according to commercial hedgers (traders who use futures contracts for hedging as part of the business), non-commercials (large traders who speculate to realize trading profits) and nonreportable traders (usually small traders/speculators) as well as their open interest (contracts open in the market at time of reporting). See CFTC criteria here.

Speculators sharply raised their SP500-Mini bets for 2nd week to least bearish level since June

By InvestMacro

COT Stock Futures Open Interest Comparison

Here are the latest charts and statistics for the Commitment of Traders (COT) data published by the Commodities Futures Trading Commission (CFTC).

The latest COT data is updated through Tuesday September 27th and shows a quick view of how large traders (for-profit speculators and commercial entities) were positioned in the futures markets.

Weekly Speculator Changes led by S&P500 Mini and Nikkei 225

Stocks Futures Speculator Net Position Changes

The COT stock market speculator bets were slightly higher this week as four out of the seven stock markets we cover had higher positioning on the week while the other three markets had lower contracts.

Leading the gains for stock markets was the S&P500 Mini (69,250 contracts) with the Nikkei 225 USD (6,161 contracts), MSCI EAFE Mini (4,434 contracts) and the Russell 2000 Mini (777 contracts) also showing positive weeks.

The stock markets leading the declines in speculator bets this week were the Dow Jones Industrial Average Mini (-3,796 contracts), Nasdaq Mini (-3,533 contracts) and the VIX (-926 contracts).

Highlighting the COT Stocks data this week is another week of big moves in the SP500-Mini speculator contracts. The SP500-Mini speculator bets rebounded sharply for a second straight week and gained by more than +60,000 contracts for the second consecutive week. The past 2-week rise in speculator bets now totals +130,803 contracts. The SP500-Mini speculator position is now below the -200,000 contracts for the first time since July 5th and at the least bearish level since June 28th. Despite the positive speculator sentiment last week, the SP500 index sold off sharply to end the week and closed at its lowest level since November of 2020.


Data Snapshot of Stock Market Traders | Columns Legend
Sep-27-2022OIOI-IndexSpec-NetSpec-IndexCom-NetCOM-IndexSmalls-NetSmalls-Index
S&P500-Mini2,233,8785-150,20128232,96781-82,7669
Nikkei 22514,070101,52085-1,541222129
Nasdaq-Mini282,05461-487524,47342-24,4256
DowJones-Mini67,05524-19,2301420,42886-1,19832
VIX331,04236-82,7246890,37833-7,65454
Nikkei 225 Yen43,11519-6503214,38367-13,73347


Strength Scores

Strength Scores (a normalized measure of Speculator positions over a 3-Year range, from 0 to 100 where above 80 is extreme bullish and below 20 is extreme bearish) showed that the Nikkei USD (84.7 percent) leads the stock markets and is in a bullish extreme position (above 80 percent). The Nasdaq-Mini (75.0 percent) and the VIX (67.8 percent) come in as the next highest stock markets in strength scores.

On the downside, the Russell 2000-Mini (7.8 percent) comes in at the lowest strength level currently and is followed by the DowJones-Mini (13.8 percent) with both being in bearish extreme levels (below 20 percent).

Strength Statistics:
VIX (67.8 percent) vs VIX previous week (68.3 percent)
S&P500-Mini (28.4 percent) vs S&P500-Mini previous week (15.5 percent)
DowJones-Mini (13.8 percent) vs DowJones-Mini previous week (19.3 percent)
Nasdaq-Mini (75.0 percent) vs Nasdaq-Mini previous week (77.0 percent)
Russell2000-Mini (7.8 percent) vs Russell2000-Mini previous week (7.4 percent)
Nikkei USD (84.7 percent) vs Nikkei USD previous week (55.4 percent)
EAFE-Mini (27.3 percent) vs EAFE-Mini previous week (22.4 percent)

Strength Trends

Strength Score Trends (or move index, calculates the 6-week changes in strength scores) showed that the EAFE-Mini (27.3 percent) and the S&P500-Mini (25.5 percent) lead the past six weeks trends for stocks. The Nikkei USD (22.1 percent), the VIX (9.7 percent) and the Russell 2000-Mini (5.8 percent) round out the other positive movers in the latest trends data.

The DowJones-Mini (-17.7 percent) leads the downside trend scores currently while the next market with lower trend scores was the Nasdaq-Mini (-3.9 percent).


Strength Trend Statistics:
VIX (9.7 percent) vs VIX previous week (8.2 percent)
S&P500-Mini (25.5 percent) vs S&P500-Mini previous week (4.6 percent)
DowJones-Mini (-17.7 percent) vs DowJones-Mini previous week (-3.9 percent)
Nasdaq-Mini (-3.9 percent) vs Nasdaq-Mini previous week (-9.8 percent)
Russell2000-Mini (5.8 percent) vs Russell2000-Mini previous week (3.4 percent)
Nikkei USD (22.1 percent) vs Nikkei USD previous week (-12.8 percent)
EAFE-Mini (27.3 percent) vs EAFE-Mini previous week (7.8 percent)


Individual Markets:

VIX Volatility Futures:

VIX Volatility Futures COT ChartThe VIX Volatility large speculator standing this week recorded a net position of -82,724 contracts in the data reported through Tuesday. This was a weekly fall of -926 contracts from the previous week which had a total of -81,798 net contracts.

This week’s current strength score (the trader positioning range over the past three years, measured from 0 to 100) shows the speculators are currently Bullish with a score of 67.8 percent. The commercials are Bearish with a score of 33.1 percent and the small traders (not shown in chart) are Bullish with a score of 54.2 percent.

VIX Volatility Futures StatisticsSPECULATORSCOMMERCIALSSMALL TRADERS
– Percent of Open Interest Longs:17.855.07.2
– Percent of Open Interest Shorts:42.827.79.6
– Net Position:-82,72490,378-7,654
– Gross Longs:58,980182,09723,991
– Gross Shorts:141,70491,71931,645
– Long to Short Ratio:0.4 to 12.0 to 10.8 to 1
NET POSITION TREND:
– Strength Index Score (3 Year Range Pct):67.833.154.2
– Strength Index Reading (3 Year Range):BullishBearishBullish
NET POSITION MOVEMENT INDEX:
– 6-Week Change in Strength Index:9.7-7.3-22.0


S&P500 Mini Futures:

SP500 Mini Futures COT ChartThe S&P500 Mini large speculator standing this week recorded a net position of -150,201 contracts in the data reported through Tuesday. This was a weekly boost of 69,250 contracts from the previous week which had a total of -219,451 net contracts.

This week’s current strength score (the trader positioning range over the past three years, measured from 0 to 100) shows the speculators are currently Bearish with a score of 28.4 percent. The commercials are Bullish-Extreme with a score of 81.4 percent and the small traders (not shown in chart) are Bearish-Extreme with a score of 9.0 percent.

S&P500 Mini Futures StatisticsSPECULATORSCOMMERCIALSSMALL TRADERS
– Percent of Open Interest Longs:11.876.98.4
– Percent of Open Interest Shorts:18.566.512.1
– Net Position:-150,201232,967-82,766
– Gross Longs:262,7971,717,571186,623
– Gross Shorts:412,9981,484,604269,389
– Long to Short Ratio:0.6 to 11.2 to 10.7 to 1
NET POSITION TREND:
– Strength Index Score (3 Year Range Pct):28.481.49.0
– Strength Index Reading (3 Year Range):BearishBullish-ExtremeBearish-Extreme
NET POSITION MOVEMENT INDEX:
– 6-Week Change in Strength Index:25.5-16.4-3.5


Dow Jones Mini Futures:

Dow Jones Mini Futures COT ChartThe Dow Jones Mini large speculator standing this week recorded a net position of -19,230 contracts in the data reported through Tuesday. This was a weekly decline of -3,796 contracts from the previous week which had a total of -15,434 net contracts.

This week’s current strength score (the trader positioning range over the past three years, measured from 0 to 100) shows the speculators are currently Bearish-Extreme with a score of 13.8 percent. The commercials are Bullish-Extreme with a score of 85.8 percent and the small traders (not shown in chart) are Bearish with a score of 32.1 percent.

Dow Jones Mini Futures StatisticsSPECULATORSCOMMERCIALSSMALL TRADERS
– Percent of Open Interest Longs:21.360.617.3
– Percent of Open Interest Shorts:50.030.119.1
– Net Position:-19,23020,428-1,198
– Gross Longs:14,30940,63211,590
– Gross Shorts:33,53920,20412,788
– Long to Short Ratio:0.4 to 12.0 to 10.9 to 1
NET POSITION TREND:
– Strength Index Score (3 Year Range Pct):13.885.832.1
– Strength Index Reading (3 Year Range):Bearish-ExtremeBullish-ExtremeBearish
NET POSITION MOVEMENT INDEX:
– 6-Week Change in Strength Index:-17.715.56.4


Nasdaq Mini Futures:

Nasdaq Mini Futures COT ChartThe Nasdaq Mini large speculator standing this week recorded a net position of -48 contracts in the data reported through Tuesday. This was a weekly fall of -3,533 contracts from the previous week which had a total of 3,485 net contracts.

This week’s current strength score (the trader positioning range over the past three years, measured from 0 to 100) shows the speculators are currently Bullish with a score of 75.0 percent. The commercials are Bearish with a score of 41.6 percent and the small traders (not shown in chart) are Bearish-Extreme with a score of 5.6 percent.

Nasdaq Mini Futures StatisticsSPECULATORSCOMMERCIALSSMALL TRADERS
– Percent of Open Interest Longs:26.560.411.6
– Percent of Open Interest Shorts:26.551.720.3
– Net Position:-4824,473-24,425
– Gross Longs:74,731170,35232,818
– Gross Shorts:74,779145,87957,243
– Long to Short Ratio:1.0 to 11.2 to 10.6 to 1
NET POSITION TREND:
– Strength Index Score (3 Year Range Pct):75.041.65.6
– Strength Index Reading (3 Year Range):BullishBearishBearish-Extreme
NET POSITION MOVEMENT INDEX:
– 6-Week Change in Strength Index:-3.95.5-3.9


Russell 2000 Mini Futures:

Russell 2000 Mini Futures COT ChartThe Russell 2000 Mini large speculator standing this week recorded a net position of -106,061 contracts in the data reported through Tuesday. This was a weekly advance of 777 contracts from the previous week which had a total of -106,838 net contracts.

This week’s current strength score (the trader positioning range over the past three years, measured from 0 to 100) shows the speculators are currently Bearish-Extreme with a score of 7.8 percent. The commercials are Bullish-Extreme with a score of 91.3 percent and the small traders (not shown in chart) are Bearish with a score of 23.5 percent.

Russell 2000 Mini Futures StatisticsSPECULATORSCOMMERCIALSSMALL TRADERS
– Percent of Open Interest Longs:7.987.33.8
– Percent of Open Interest Shorts:27.267.84.0
– Net Position:-106,061107,336-1,275
– Gross Longs:43,291479,62220,778
– Gross Shorts:149,352372,28622,053
– Long to Short Ratio:0.3 to 11.3 to 10.9 to 1
NET POSITION TREND:
– Strength Index Score (3 Year Range Pct):7.891.323.5
– Strength Index Reading (3 Year Range):Bearish-ExtremeBullish-ExtremeBearish
NET POSITION MOVEMENT INDEX:
– 6-Week Change in Strength Index:5.8-5.71.9


Nikkei Stock Average (USD) Futures:

Nikkei Stock Average (USD) Futures COT ChartThe Nikkei Stock Average (USD) large speculator standing this week recorded a net position of 1,520 contracts in the data reported through Tuesday. This was a weekly gain of 6,161 contracts from the previous week which had a total of -4,641 net contracts.

This week’s current strength score (the trader positioning range over the past three years, measured from 0 to 100) shows the speculators are currently Bullish-Extreme with a score of 84.7 percent. The commercials are Bearish with a score of 21.9 percent and the small traders (not shown in chart) are Bearish with a score of 28.6 percent.

Nikkei Stock Average Futures StatisticsSPECULATORSCOMMERCIALSSMALL TRADERS
– Percent of Open Interest Longs:34.546.718.6
– Percent of Open Interest Shorts:23.757.618.4
– Net Position:1,520-1,54121
– Gross Longs:4,8606,5692,611
– Gross Shorts:3,3408,1102,590
– Long to Short Ratio:1.5 to 10.8 to 11.0 to 1
NET POSITION TREND:
– Strength Index Score (3 Year Range Pct):84.721.928.6
– Strength Index Reading (3 Year Range):Bullish-ExtremeBearishBearish
NET POSITION MOVEMENT INDEX:
– 6-Week Change in Strength Index:22.1-24.53.0


MSCI EAFE Mini Futures:

MSCI EAFE Mini Futures COT ChartThe MSCI EAFE Mini large speculator standing this week recorded a net position of -11,275 contracts in the data reported through Tuesday. This was a weekly lift of 4,434 contracts from the previous week which had a total of -15,709 net contracts.

This week’s current strength score (the trader positioning range over the past three years, measured from 0 to 100) shows the speculators are currently Bearish with a score of 27.3 percent. The commercials are Bullish with a score of 74.5 percent and the small traders (not shown in chart) are Bearish with a score of 29.0 percent.

MSCI EAFE Mini Futures StatisticsSPECULATORSCOMMERCIALSSMALL TRADERS
– Percent of Open Interest Longs:5.092.22.1
– Percent of Open Interest Shorts:7.989.61.8
– Net Position:-11,27510,1181,157
– Gross Longs:19,991365,7418,306
– Gross Shorts:31,266355,6237,149
– Long to Short Ratio:0.6 to 11.0 to 11.2 to 1
NET POSITION TREND:
– Strength Index Score (3 Year Range Pct):27.374.529.0
– Strength Index Reading (3 Year Range):BearishBullishBearish
NET POSITION MOVEMENT INDEX:
– 6-Week Change in Strength Index:27.3-25.5-10.0


Article By InvestMacroReceive our weekly COT Newsletter

*COT Report: The COT data, released weekly to the public each Friday, is updated through the most recent Tuesday (data is 3 days old) and shows a quick view of how large speculators or non-commercials (for-profit traders) were positioned in the futures markets.

The CFTC categorizes trader positions according to commercial hedgers (traders who use futures contracts for hedging as part of the business), non-commercials (large traders who speculate to realize trading profits) and nonreportable traders (usually small traders/speculators) as well as their open interest (contracts open in the market at time of reporting). See CFTC criteria here.