By InvestMacro
Here are the latest charts and statistics for the Commitment of Traders (COT) data published by the Commodities Futures Trading Commission (CFTC).
The latest COT data is updated through Tuesday October 18th and shows a quick view of how large market participants (for-profit speculators and commercial traders) were positioned in the futures markets. All currency positions are in direct relation to the US dollar where, for example, a bet for the euro is a bet that the euro will rise versus the dollar while a bet against the euro will be a bet that the euro will decline versus the dollar.
Euro & Mexican Peso lead Weekly Speculator Changes

The COT currency market speculator bets were slightly lower this week as five out of the eleven currency markets we cover had higher positioning while the other six markets had lower speculator contracts.
Leading the gains for the currency markets were the Mexican peso (11,360 contracts) and the Euro (10,651 contracts) with the Canadian dollar (5,099 contracts), the New Zealand dollar (597 contracts) and the Brazilian real (423 contracts) also showing a positive week.
The currencies leading the declines in speculator bets this week were the Japanese yen (-16,943 contracts) and the British pound sterling (-12,041 contracts) with the Australian dollar (-4,088 contracts), the Swiss franc (-1,196 contracts), Bitcoin (-835 contracts) and the US Dollar Index (-96 contracts) also registering lower bets on the week.
Highlighting the COT currency data this week was the Euro. The large speculator positioning this week saw Euro bets rise by over +10,000 contracts and go higher for the sixth time out of the past seven weeks. Euro bets have gained by over +95,000 net contracts in just the past seven weeks, going from -47,676 contracts on August 30th to over +48,000 contracts this week. This bullishness has brought the overall net speculator standing to its highest level in nineteen weeks, dating back to June 7th.
Euro speculators have been raising their bets into a market that is close to 20-year lows in the EURUSD exchange rate. Speculators are clearly betting that the exchange rate is close to a low point and looking to profit on a turnaround. The European Central Bank is expected to raise their interest rates this week by potentially 75-basis points and with the possibility of further rate rises before the end of the year.
The EURUSD exchange rate closed the week over 1.25 percent higher and ended the week around the 0.9855 exchange level.
| Oct-18-2022 | OI | OI-Index | Spec-Net | Spec-Index | Com-Net | COM-Index | Smalls-Net | Smalls-Index |
|---|
| USD Index | 55,234 | 78 | 32,690 | 79 | -37,014 | 17 | 4,324 | 64 |
| EUR | 640,469 | 50 | 48,150 | 50 | -70,577 | 56 | 22,427 | 15 |
| GBP | 258,826 | 73 | -51,211 | 25 | 76,309 | 86 | -25,098 | 9 |
| JPY | 264,265 | 89 | -94,336 | 11 | 110,841 | 90 | -16,505 | 20 |
| CHF | 44,911 | 31 | -7,086 | 39 | 19,098 | 74 | -12,012 | 17 |
| CAD | 146,425 | 28 | -20,573 | 16 | 25,103 | 90 | -4,530 | 21 |
| AUD | 150,496 | 45 | -35,359 | 52 | 48,971 | 55 | -13,612 | 19 |
| NZD | 50,448 | 44 | -18,445 | 38 | 22,359 | 67 | -3,914 | 7 |
| MXN | 215,836 | 57 | -22,294 | 18 | 16,273 | 80 | 6,021 | 69 |
| RUB | 20,930 | 4 | 7,543 | 31 | -7,150 | 69 | -393 | 24 |
| BRL | 41,954 | 29 | 26,498 | 76 | -28,581 | 23 | 2,083 | 89 |
| Bitcoin | 14,228 | 82 | 22 | 77 | -665 | 0 | 643 | 28 |
Strength Scores led by US Dollar Index, Bitcoin & Brazilian Real
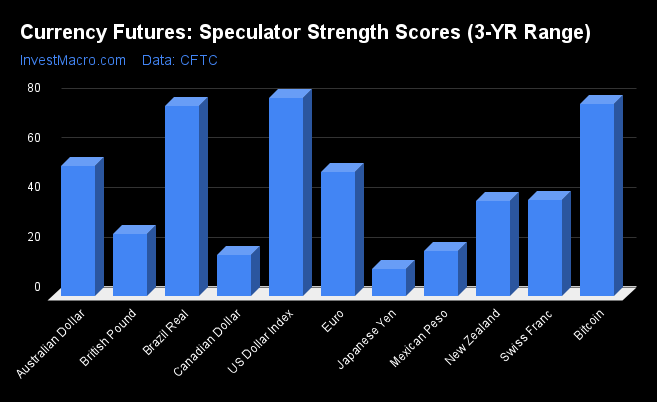
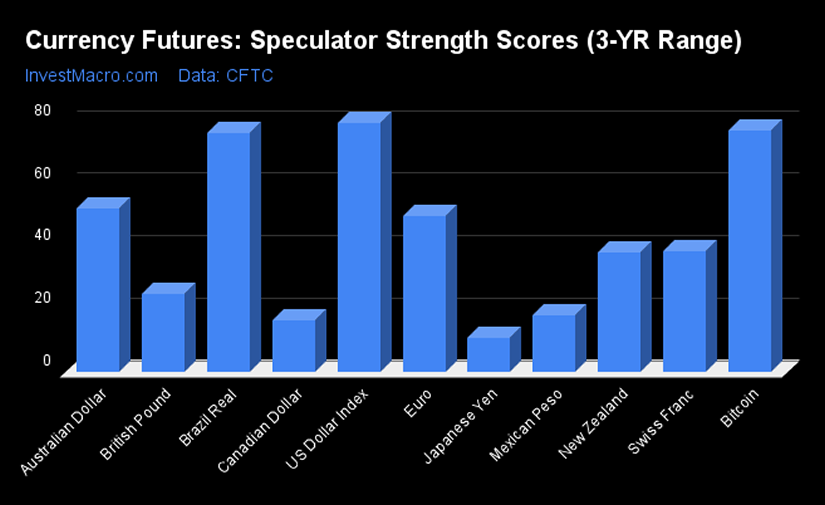
Strength Scores (a normalized measure of Speculator positions over a 3-Year range, from 0 to 100 where above 80 is extreme bullish and below 20 is extreme bearish) show that the US Dollar Index (79.5 percent), Bitcoin and the Brazilian Real (76.4 percent) lead the currency markets this week. The Australian Dollar (52.1 percent) comes in as the next highest in the currency markets in strength scores.
On the downside, the Japanese Yen (10.8 percent), Canadian Dollar (16.3 percent) and the Mexican Peso (17.8 percent) come in at the lowest strength level currently and all three are in bearish extreme levels (below 20 percent).
Strength Statistics:
US Dollar Index (79.5 percent) vs US Dollar Index previous week (79.6 percent)
EuroFX (49.8 percent) vs EuroFX previous week (46.5 percent)
British Pound Sterling (25.0 percent) vs British Pound Sterling previous week (35.4 percent)
Japanese Yen (10.8 percent) vs Japanese Yen previous week (21.2 percent)
Swiss Franc (38.5 percent) vs Swiss Franc previous week (41.6 percent)
Canadian Dollar (16.3 percent) vs Canadian Dollar previous week (10.5 percent)
Australian Dollar (52.1 percent) vs Australian Dollar previous week (55.8 percent)
New Zealand Dollar (38.2 percent) vs New Zealand Dollar previous week (37.1 percent)
Mexican Peso (17.8 percent) vs Mexican Peso previous week (13.0 percent)
Brazilian Real (76.4 percent) vs Brazilian Real previous week (76.0 percent)
Bitcoin (77.3 percent) vs Bitcoin previous week (91.9 percent)
EuroFX leads the Strength Trends
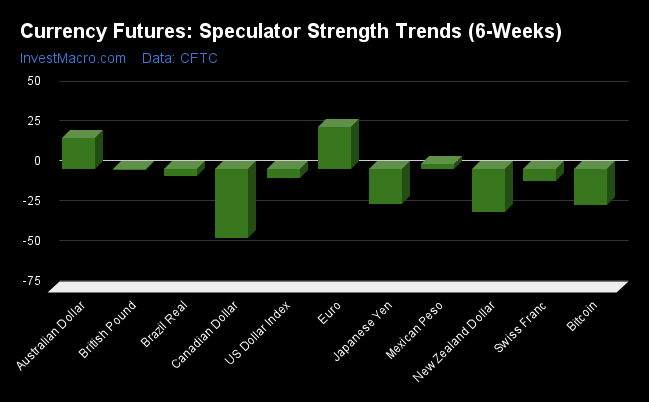
Strength Score Trends (or move index, calculates the 6-week changes in strength scores) show that the EuroFX (25.9 percent) leads the past six weeks trends for the currency markets this week. The Australian Dollar (19.6 percent) and the Mexican Peso (3.1 percent) fill out the only other positive movers in the latest trends data.
The Canadian Dollar (-43.2 percent) leads the downside trend scores currently while the next market with lower trend scores were the New Zealand Dollar (-27.3 percent), Bitcoin (-22.7 percent) and the Japanese Yen (-22.3 percent).
Strength Trend Statistics:
US Dollar Index (-5.7 percent) vs US Dollar Index previous week (-4.6 percent)
EuroFX (25.9 percent) vs EuroFX previous week (26.1 percent)
British Pound Sterling (-0.7 percent) vs British Pound Sterling previous week (-8.6 percent)
Japanese Yen (-22.3 percent) vs Japanese Yen previous week (-22.1 percent)
Swiss Franc (-7.7 percent) vs Swiss Franc previous week (-9.2 percent)
Canadian Dollar (-43.2 percent) vs Canadian Dollar previous week (-56.0 percent)
Australian Dollar (19.6 percent) vs Australian Dollar previous week (24.2 percent)
New Zealand Dollar (-27.3 percent) vs New Zealand Dollar previous week (-27.7 percent)
Mexican Peso (3.1 percent) vs Mexican Peso previous week (-2.0 percent)
Brazilian Real (-4.3 percent) vs Brazilian Real previous week (16.9 percent)
Bitcoin (-22.7 percent) vs Bitcoin previous week (-7.7 percent)
Individual COT Forex Markets:
US Dollar Index Futures:
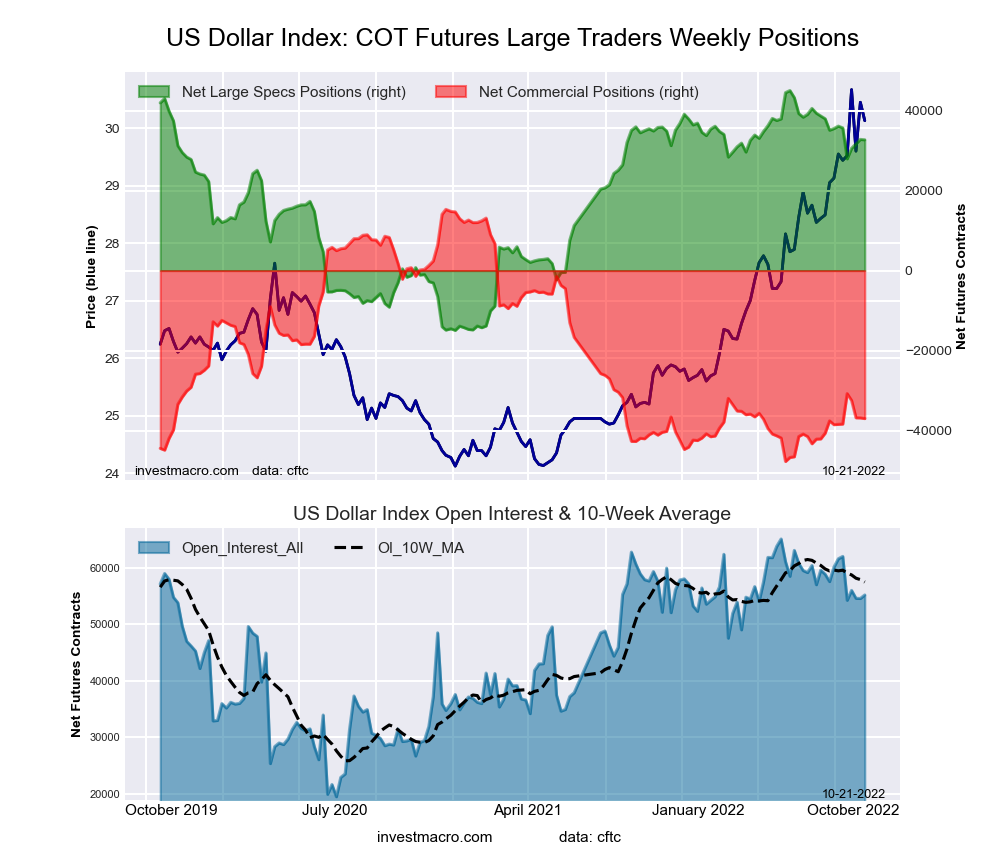 The US Dollar Index large speculator standing this week resulted in a net position of 32,690 contracts in the data reported through Tuesday. This was a weekly decrease of -96 contracts from the previous week which had a total of 32,786 net contracts.
This week’s current strength score (the trader positioning range over the past three years, measured from 0 to 100) shows the speculators are currently Bullish with a score of 79.5 percent. The commercials are Bearish-Extreme with a score of 17.0 percent and the small traders (not shown in chart) are Bullish with a score of 63.8 percent.
| US DOLLAR INDEX Statistics | SPECULATORS | COMMERCIALS | SMALL TRADERS |
| – Percent of Open Interest Longs: | 81.4 | 3.5 | 12.6 |
| – Percent of Open Interest Shorts: | 22.2 | 70.6 | 4.8 |
| – Net Position: | 32,690 | -37,014 | 4,324 |
| – Gross Longs: | 44,956 | 1,955 | 6,954 |
| – Gross Shorts: | 12,266 | 38,969 | 2,630 |
| – Long to Short Ratio: | 3.7 to 1 | 0.1 to 1 | 2.6 to 1 |
| NET POSITION TREND: | | | |
| – Strength Index Score (3 Year Range Pct): | 79.5 | 17.0 | 63.8 |
| – Strength Index Reading (3 Year Range): | Bullish | Bearish-Extreme | Bullish |
| NET POSITION MOVEMENT INDEX: | | | |
| – 6-Week Change in Strength Index: | -5.7 | 2.3 | 21.6 |
Euro Currency Futures:
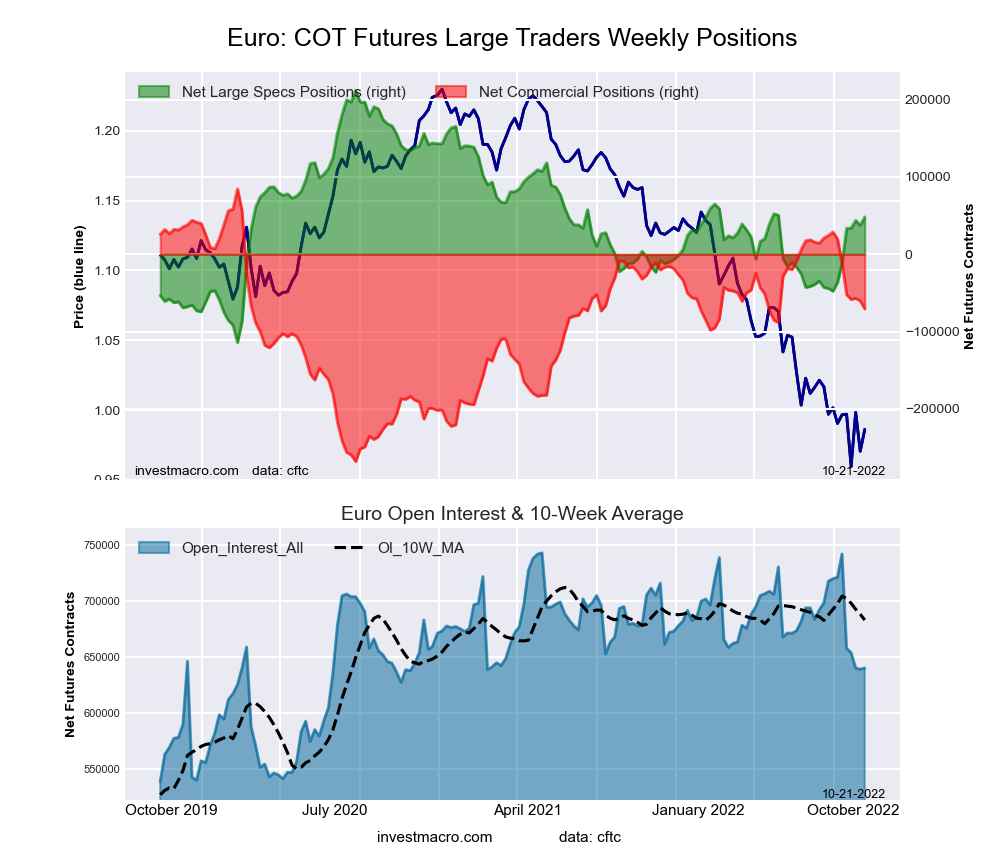 The Euro Currency large speculator standing this week resulted in a net position of 48,150 contracts in the data reported through Tuesday. This was a weekly lift of 10,651 contracts from the previous week which had a total of 37,499 net contracts.
This week’s current strength score (the trader positioning range over the past three years, measured from 0 to 100) shows the speculators are currently Bearish with a score of 49.8 percent. The commercials are Bullish with a score of 56.0 percent and the small traders (not shown in chart) are Bearish-Extreme with a score of 14.8 percent.
| EURO Currency Statistics | SPECULATORS | COMMERCIALS | SMALL TRADERS |
| – Percent of Open Interest Longs: | 31.6 | 54.2 | 11.9 |
| – Percent of Open Interest Shorts: | 24.1 | 65.2 | 8.4 |
| – Net Position: | 48,150 | -70,577 | 22,427 |
| – Gross Longs: | 202,703 | 347,078 | 76,183 |
| – Gross Shorts: | 154,553 | 417,655 | 53,756 |
| – Long to Short Ratio: | 1.3 to 1 | 0.8 to 1 | 1.4 to 1 |
| NET POSITION TREND: | | | |
| – Strength Index Score (3 Year Range Pct): | 49.8 | 56.0 | 14.8 |
| – Strength Index Reading (3 Year Range): | Bearish | Bullish | Bearish-Extreme |
| NET POSITION MOVEMENT INDEX: | | | |
| – 6-Week Change in Strength Index: | 25.9 | -25.6 | 9.1 |
British Pound Sterling Futures:
 The British Pound Sterling large speculator standing this week resulted in a net position of -51,211 contracts in the data reported through Tuesday. This was a weekly fall of -12,041 contracts from the previous week which had a total of -39,170 net contracts.
This week’s current strength score (the trader positioning range over the past three years, measured from 0 to 100) shows the speculators are currently Bearish with a score of 25.0 percent. The commercials are Bullish-Extreme with a score of 85.9 percent and the small traders (not shown in chart) are Bearish-Extreme with a score of 8.8 percent.
| BRITISH POUND Statistics | SPECULATORS | COMMERCIALS | SMALL TRADERS |
| – Percent of Open Interest Longs: | 15.6 | 75.1 | 7.2 |
| – Percent of Open Interest Shorts: | 35.4 | 45.6 | 16.9 |
| – Net Position: | -51,211 | 76,309 | -25,098 |
| – Gross Longs: | 40,328 | 194,385 | 18,668 |
| – Gross Shorts: | 91,539 | 118,076 | 43,766 |
| – Long to Short Ratio: | 0.4 to 1 | 1.6 to 1 | 0.4 to 1 |
| NET POSITION TREND: | | | |
| – Strength Index Score (3 Year Range Pct): | 25.0 | 85.9 | 8.8 |
| – Strength Index Reading (3 Year Range): | Bearish | Bullish-Extreme | Bearish-Extreme |
| NET POSITION MOVEMENT INDEX: | | | |
| – 6-Week Change in Strength Index: | -0.7 | 4.3 | -10.9 |
Japanese Yen Futures:
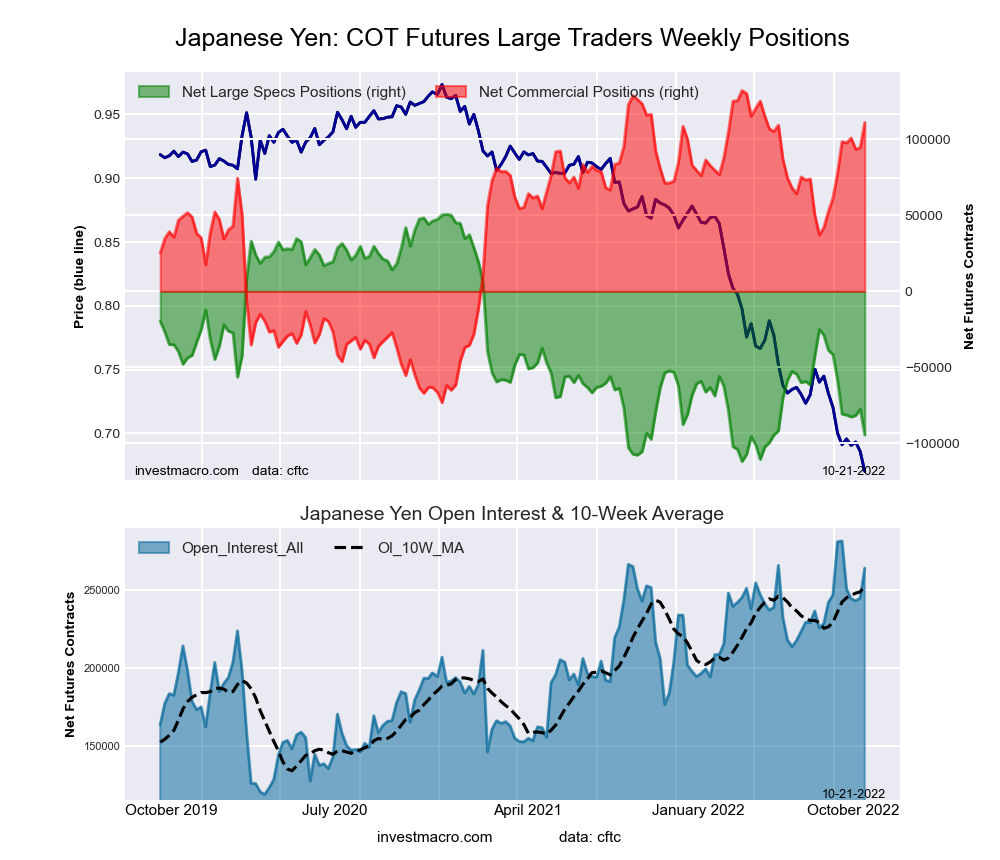 The Japanese Yen large speculator standing this week resulted in a net position of -94,336 contracts in the data reported through Tuesday. This was a weekly fall of -16,943 contracts from the previous week which had a total of -77,393 net contracts.
This week’s current strength score (the trader positioning range over the past three years, measured from 0 to 100) shows the speculators are currently Bearish-Extreme with a score of 10.8 percent. The commercials are Bullish-Extreme with a score of 89.7 percent and the small traders (not shown in chart) are Bearish-Extreme with a score of 19.9 percent.
| JAPANESE YEN Statistics | SPECULATORS | COMMERCIALS | SMALL TRADERS |
| – Percent of Open Interest Longs: | 11.6 | 77.0 | 10.0 |
| – Percent of Open Interest Shorts: | 47.3 | 35.1 | 16.3 |
| – Net Position: | -94,336 | 110,841 | -16,505 |
| – Gross Longs: | 30,583 | 203,508 | 26,491 |
| – Gross Shorts: | 124,919 | 92,667 | 42,996 |
| – Long to Short Ratio: | 0.2 to 1 | 2.2 to 1 | 0.6 to 1 |
| NET POSITION TREND: | | | |
| – Strength Index Score (3 Year Range Pct): | 10.8 | 89.7 | 19.9 |
| – Strength Index Reading (3 Year Range): | Bearish-Extreme | Bullish-Extreme | Bearish-Extreme |
| NET POSITION MOVEMENT INDEX: | | | |
| – 6-Week Change in Strength Index: | -22.3 | 16.2 | 6.0 |
Swiss Franc Futures:
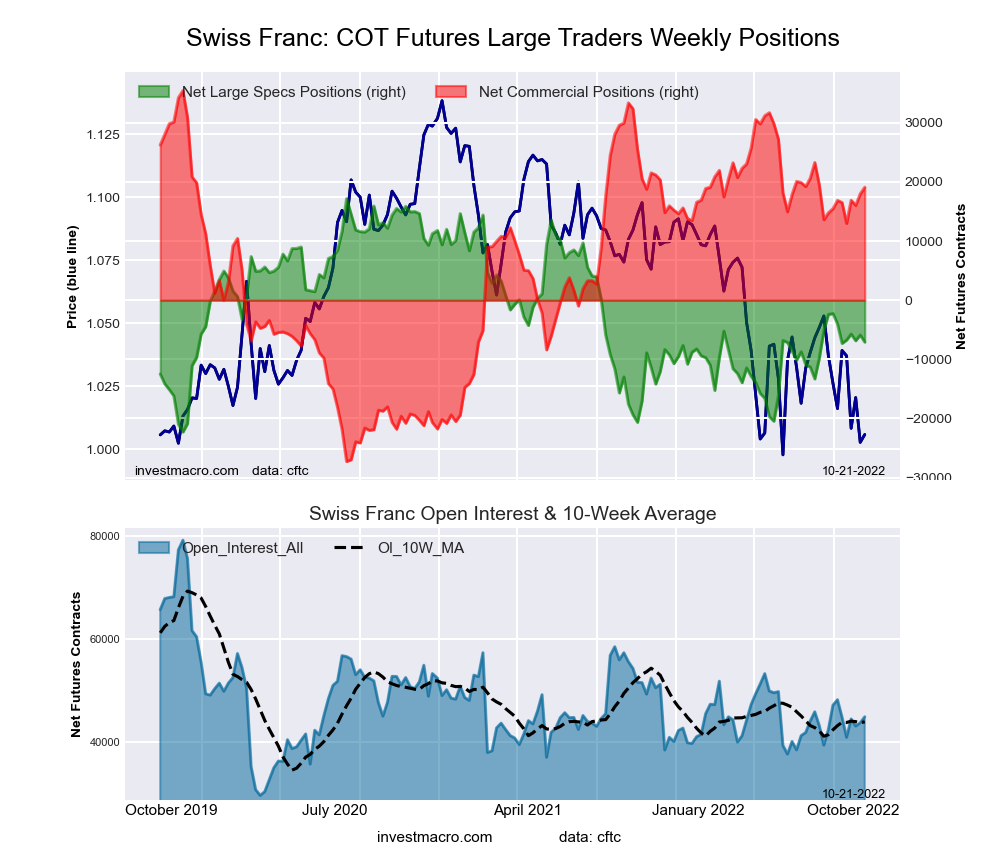 The Swiss Franc large speculator standing this week resulted in a net position of -7,086 contracts in the data reported through Tuesday. This was a weekly decrease of -1,196 contracts from the previous week which had a total of -5,890 net contracts.
This week’s current strength score (the trader positioning range over the past three years, measured from 0 to 100) shows the speculators are currently Bearish with a score of 38.5 percent. The commercials are Bullish with a score of 73.9 percent and the small traders (not shown in chart) are Bearish-Extreme with a score of 16.9 percent.
| SWISS FRANC Statistics | SPECULATORS | COMMERCIALS | SMALL TRADERS |
| – Percent of Open Interest Longs: | 15.7 | 63.9 | 20.3 |
| – Percent of Open Interest Shorts: | 31.5 | 21.4 | 47.1 |
| – Net Position: | -7,086 | 19,098 | -12,012 |
| – Gross Longs: | 7,052 | 28,702 | 9,122 |
| – Gross Shorts: | 14,138 | 9,604 | 21,134 |
| – Long to Short Ratio: | 0.5 to 1 | 3.0 to 1 | 0.4 to 1 |
| NET POSITION TREND: | | | |
| – Strength Index Score (3 Year Range Pct): | 38.5 | 73.9 | 16.9 |
| – Strength Index Reading (3 Year Range): | Bearish | Bullish | Bearish-Extreme |
| NET POSITION MOVEMENT INDEX: | | | |
| – 6-Week Change in Strength Index: | -7.7 | 3.6 | 2.8 |
Canadian Dollar Futures:
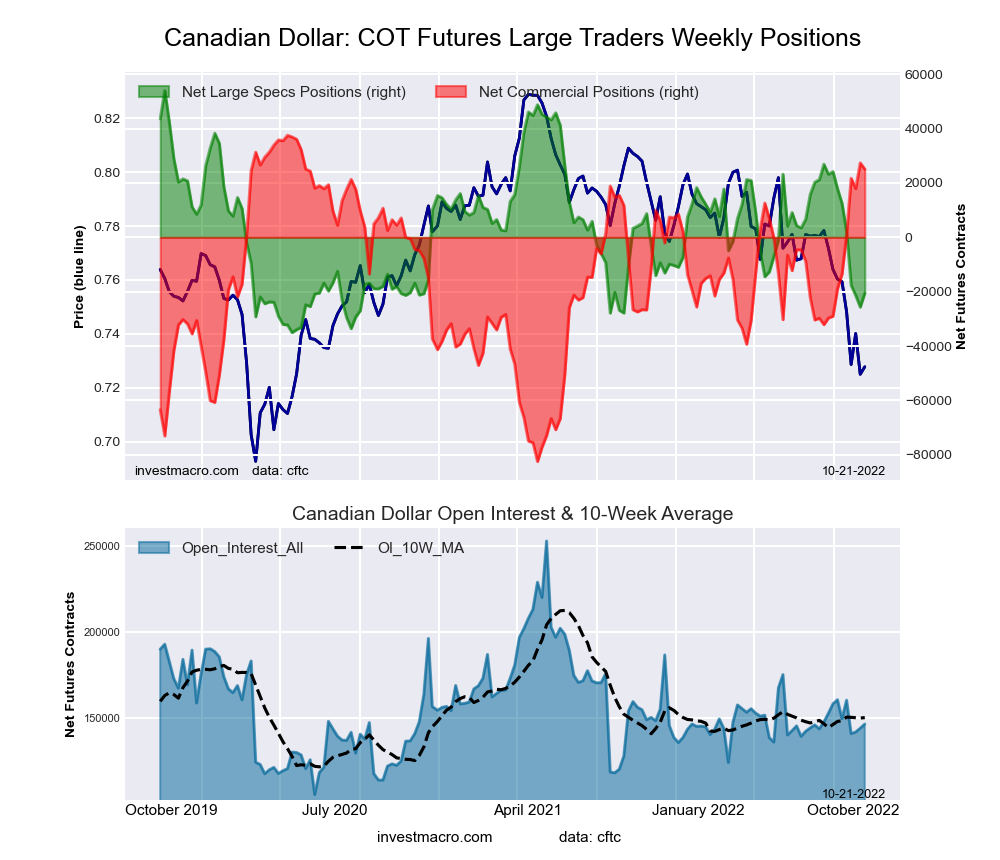 The Canadian Dollar large speculator standing this week resulted in a net position of -20,573 contracts in the data reported through Tuesday. This was a weekly gain of 5,099 contracts from the previous week which had a total of -25,672 net contracts.
This week’s current strength score (the trader positioning range over the past three years, measured from 0 to 100) shows the speculators are currently Bearish-Extreme with a score of 16.3 percent. The commercials are Bullish-Extreme with a score of 89.6 percent and the small traders (not shown in chart) are Bearish with a score of 21.0 percent.
| CANADIAN DOLLAR Statistics | SPECULATORS | COMMERCIALS | SMALL TRADERS |
| – Percent of Open Interest Longs: | 24.2 | 53.9 | 20.2 |
| – Percent of Open Interest Shorts: | 38.2 | 36.7 | 23.2 |
| – Net Position: | -20,573 | 25,103 | -4,530 |
| – Gross Longs: | 35,384 | 78,895 | 29,508 |
| – Gross Shorts: | 55,957 | 53,792 | 34,038 |
| – Long to Short Ratio: | 0.6 to 1 | 1.5 to 1 | 0.9 to 1 |
| NET POSITION TREND: | | | |
| – Strength Index Score (3 Year Range Pct): | 16.3 | 89.6 | 21.0 |
| – Strength Index Reading (3 Year Range): | Bearish-Extreme | Bullish-Extreme | Bearish |
| NET POSITION MOVEMENT INDEX: | | | |
| – 6-Week Change in Strength Index: | -43.2 | 36.7 | -11.1 |
Australian Dollar Futures:
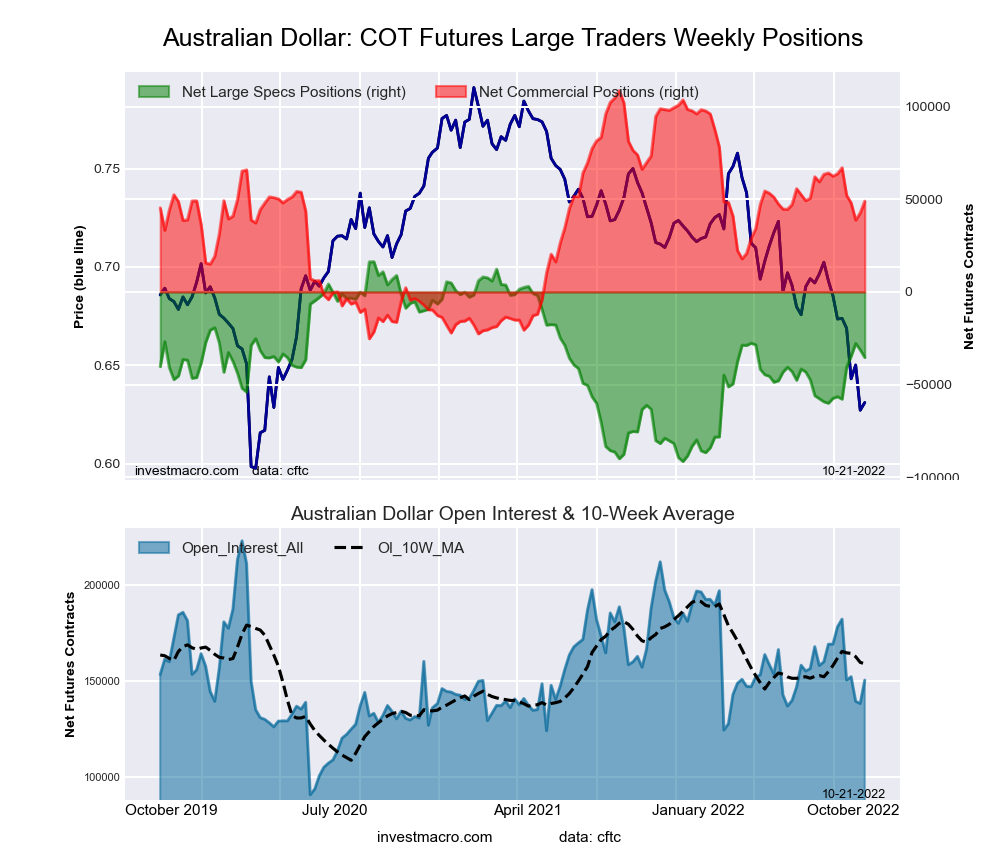 The Australian Dollar large speculator standing this week resulted in a net position of -35,359 contracts in the data reported through Tuesday. This was a weekly lowering of -4,088 contracts from the previous week which had a total of -31,271 net contracts.
This week’s current strength score (the trader positioning range over the past three years, measured from 0 to 100) shows the speculators are currently Bullish with a score of 52.1 percent. The commercials are Bullish with a score of 55.4 percent and the small traders (not shown in chart) are Bearish-Extreme with a score of 19.2 percent.
| AUSTRALIAN DOLLAR Statistics | SPECULATORS | COMMERCIALS | SMALL TRADERS |
| – Percent of Open Interest Longs: | 22.0 | 63.4 | 11.5 |
| – Percent of Open Interest Shorts: | 45.5 | 30.9 | 20.5 |
| – Net Position: | -35,359 | 48,971 | -13,612 |
| – Gross Longs: | 33,046 | 95,474 | 17,233 |
| – Gross Shorts: | 68,405 | 46,503 | 30,845 |
| – Long to Short Ratio: | 0.5 to 1 | 2.1 to 1 | 0.6 to 1 |
| NET POSITION TREND: | | | |
| – Strength Index Score (3 Year Range Pct): | 52.1 | 55.4 | 19.2 |
| – Strength Index Reading (3 Year Range): | Bullish | Bullish | Bearish-Extreme |
| NET POSITION MOVEMENT INDEX: | | | |
| – 6-Week Change in Strength Index: | 19.6 | -11.1 | -15.4 |
New Zealand Dollar Futures:
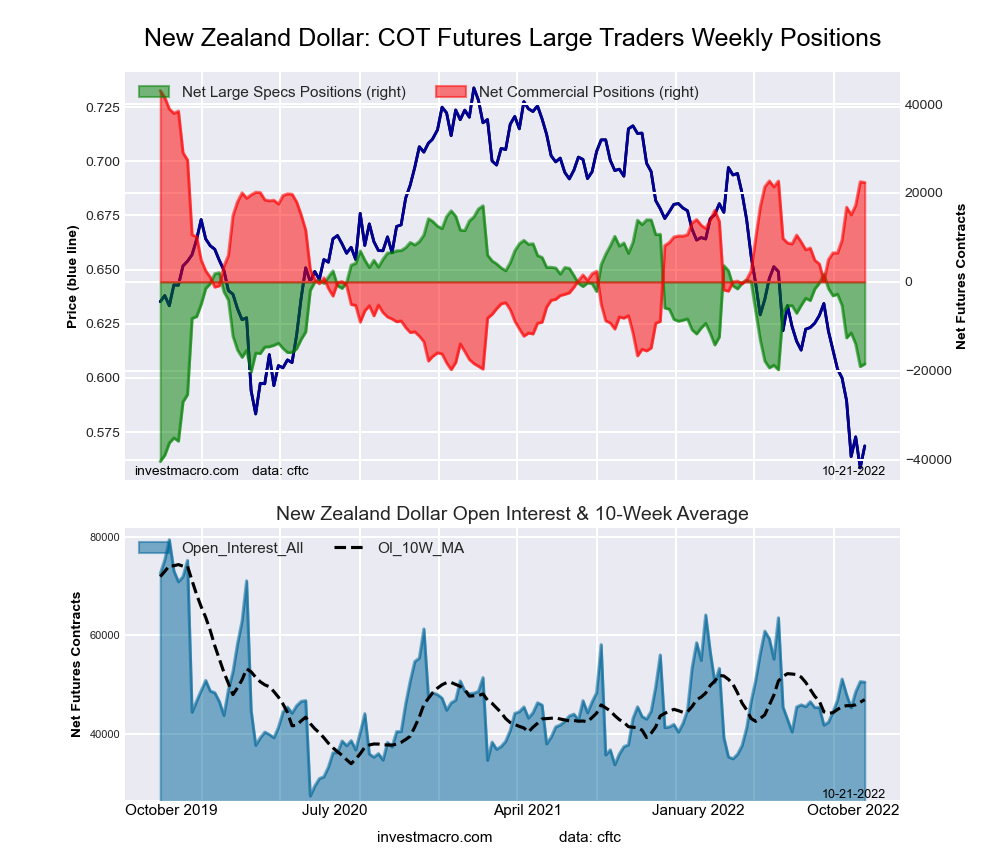 The New Zealand Dollar large speculator standing this week resulted in a net position of -18,445 contracts in the data reported through Tuesday. This was a weekly increase of 597 contracts from the previous week which had a total of -19,042 net contracts.
This week’s current strength score (the trader positioning range over the past three years, measured from 0 to 100) shows the speculators are currently Bearish with a score of 38.2 percent. The commercials are Bullish with a score of 67.0 percent and the small traders (not shown in chart) are Bearish-Extreme with a score of 6.6 percent.
| NEW ZEALAND DOLLAR Statistics | SPECULATORS | COMMERCIALS | SMALL TRADERS |
| – Percent of Open Interest Longs: | 20.5 | 73.4 | 5.5 |
| – Percent of Open Interest Shorts: | 57.0 | 29.1 | 13.3 |
| – Net Position: | -18,445 | 22,359 | -3,914 |
| – Gross Longs: | 10,328 | 37,048 | 2,787 |
| – Gross Shorts: | 28,773 | 14,689 | 6,701 |
| – Long to Short Ratio: | 0.4 to 1 | 2.5 to 1 | 0.4 to 1 |
| NET POSITION TREND: | | | |
| – Strength Index Score (3 Year Range Pct): | 38.2 | 67.0 | 6.6 |
| – Strength Index Reading (3 Year Range): | Bearish | Bullish | Bearish-Extreme |
| NET POSITION MOVEMENT INDEX: | | | |
| – 6-Week Change in Strength Index: | -27.3 | 25.3 | -1.8 |
Mexican Peso Futures:
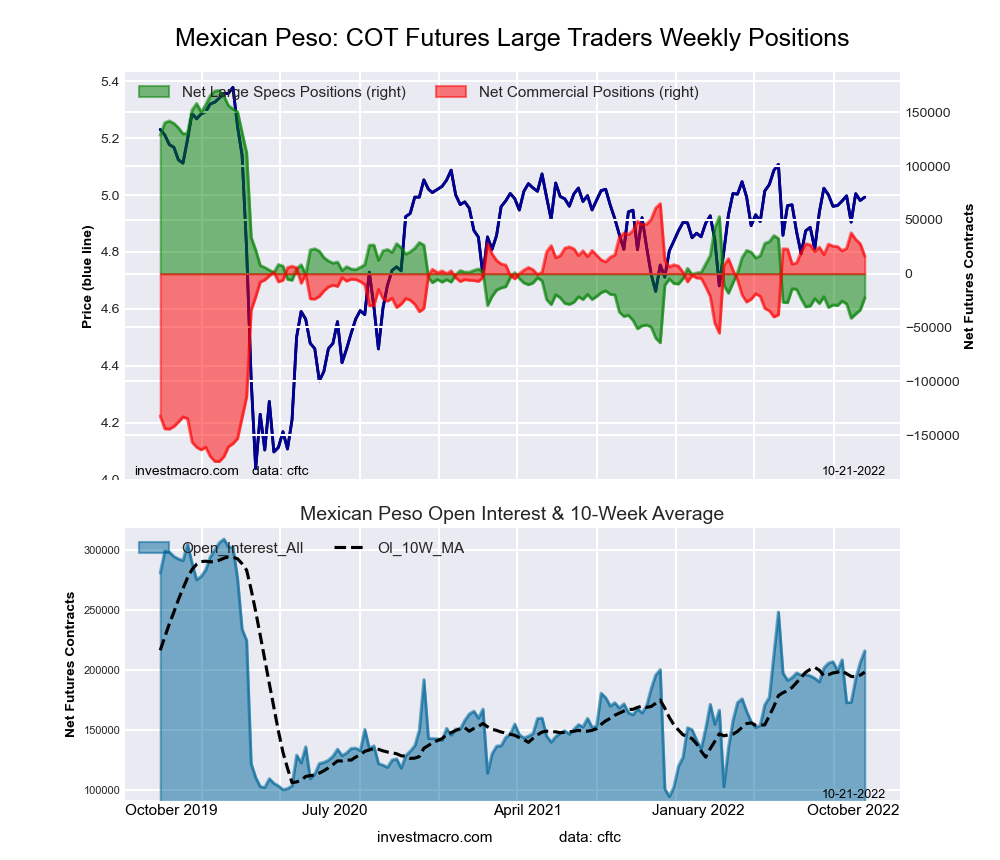 The Mexican Peso large speculator standing this week resulted in a net position of -22,294 contracts in the data reported through Tuesday. This was a weekly gain of 11,360 contracts from the previous week which had a total of -33,654 net contracts.
This week’s current strength score (the trader positioning range over the past three years, measured from 0 to 100) shows the speculators are currently Bearish-Extreme with a score of 17.8 percent. The commercials are Bullish with a score of 79.6 percent and the small traders (not shown in chart) are Bullish with a score of 68.5 percent.
| MEXICAN PESO Statistics | SPECULATORS | COMMERCIALS | SMALL TRADERS |
| – Percent of Open Interest Longs: | 61.8 | 34.2 | 3.8 |
| – Percent of Open Interest Shorts: | 72.2 | 26.6 | 1.0 |
| – Net Position: | -22,294 | 16,273 | 6,021 |
| – Gross Longs: | 133,432 | 73,758 | 8,139 |
| – Gross Shorts: | 155,726 | 57,485 | 2,118 |
| – Long to Short Ratio: | 0.9 to 1 | 1.3 to 1 | 3.8 to 1 |
| NET POSITION TREND: | | | |
| – Strength Index Score (3 Year Range Pct): | 17.8 | 79.6 | 68.5 |
| – Strength Index Reading (3 Year Range): | Bearish-Extreme | Bullish | Bullish |
| NET POSITION MOVEMENT INDEX: | | | |
| – 6-Week Change in Strength Index: | 3.1 | -3.8 | 7.9 |
Brazilian Real Futures:
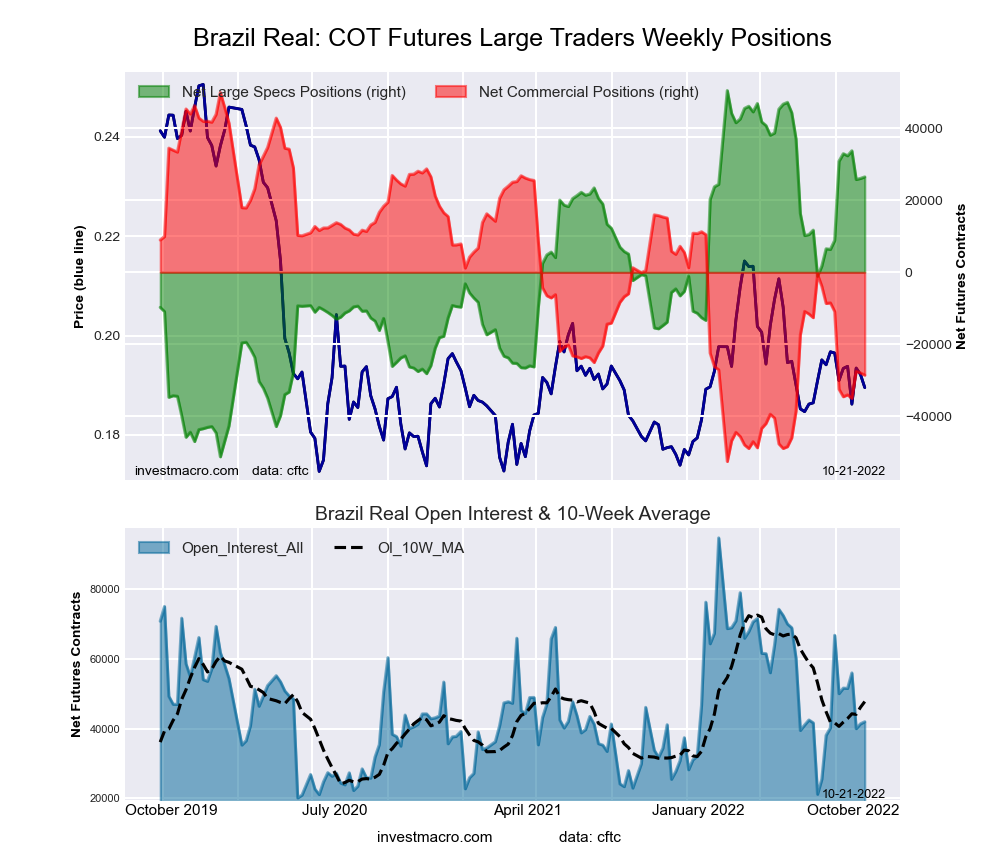 The Brazilian Real large speculator standing this week resulted in a net position of 26,498 contracts in the data reported through Tuesday. This was a weekly advance of 423 contracts from the previous week which had a total of 26,075 net contracts.
This week’s current strength score (the trader positioning range over the past three years, measured from 0 to 100) shows the speculators are currently Bullish with a score of 76.4 percent. The commercials are Bearish with a score of 23.4 percent and the small traders (not shown in chart) are Bullish-Extreme with a score of 89.2 percent.
| BRAZIL REAL Statistics | SPECULATORS | COMMERCIALS | SMALL TRADERS |
| – Percent of Open Interest Longs: | 72.3 | 19.6 | 8.1 |
| – Percent of Open Interest Shorts: | 9.1 | 87.7 | 3.1 |
| – Net Position: | 26,498 | -28,581 | 2,083 |
| – Gross Longs: | 30,326 | 8,229 | 3,398 |
| – Gross Shorts: | 3,828 | 36,810 | 1,315 |
| – Long to Short Ratio: | 7.9 to 1 | 0.2 to 1 | 2.6 to 1 |
| NET POSITION TREND: | | | |
| – Strength Index Score (3 Year Range Pct): | 76.4 | 23.4 | 89.2 |
| – Strength Index Reading (3 Year Range): | Bullish | Bearish | Bullish-Extreme |
| NET POSITION MOVEMENT INDEX: | | | |
| – 6-Week Change in Strength Index: | -4.3 | 3.8 | 5.4 |
Bitcoin Futures:
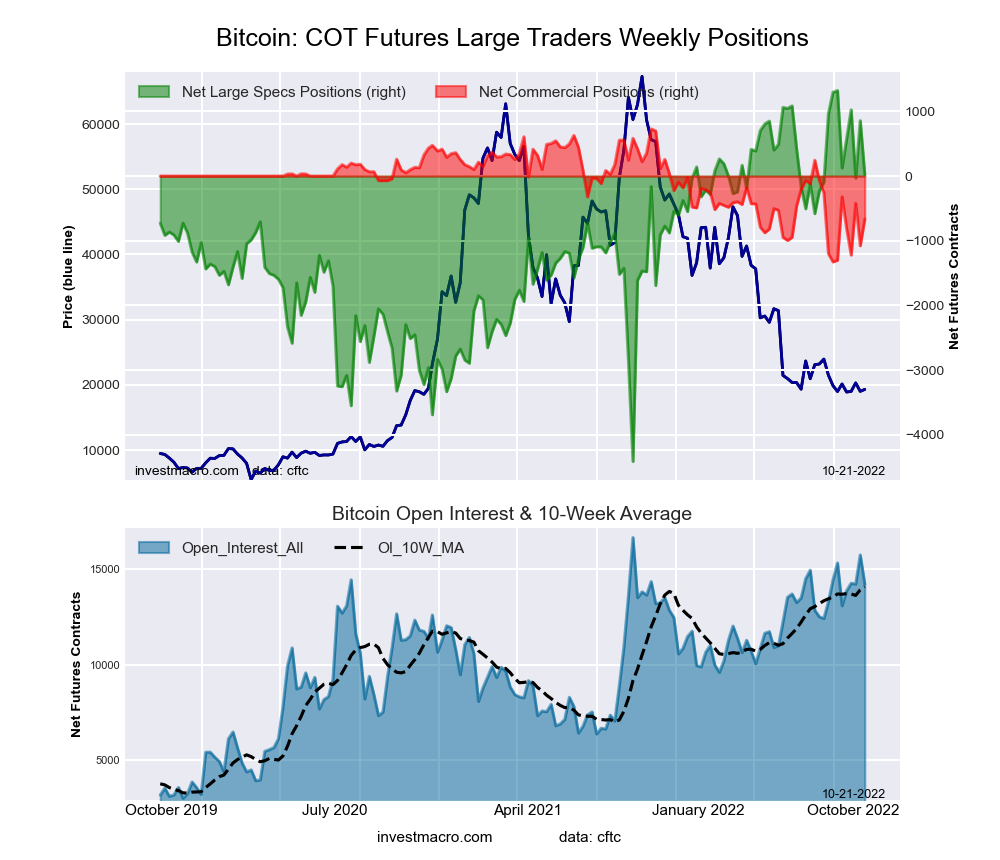 The Bitcoin large speculator standing this week resulted in a net position of 22 contracts in the data reported through Tuesday. This was a weekly fall of -835 contracts from the previous week which had a total of 857 net contracts.
This week’s current strength score (the trader positioning range over the past three years, measured from 0 to 100) shows the speculators are currently Bullish with a score of 77.3 percent. The commercials are Bearish with a score of 32.2 percent and the small traders (not shown in chart) are Bearish with a score of 27.6 percent.
| BITCOIN Statistics | SPECULATORS | COMMERCIALS | SMALL TRADERS |
| – Percent of Open Interest Longs: | 75.3 | 0.8 | 9.9 |
| – Percent of Open Interest Shorts: | 75.1 | 5.5 | 5.3 |
| – Net Position: | 22 | -665 | 643 |
| – Gross Longs: | 10,710 | 120 | 1,404 |
| – Gross Shorts: | 10,688 | 785 | 761 |
| – Long to Short Ratio: | 1.0 to 1 | 0.2 to 1 | 1.8 to 1 |
| NET POSITION TREND: | | | |
| – Strength Index Score (3 Year Range Pct): | 77.3 | 32.2 | 27.6 |
| – Strength Index Reading (3 Year Range): | Bullish | Bearish | Bearish |
| NET POSITION MOVEMENT INDEX: | | | |
| – 6-Week Change in Strength Index: | -22.7 | 30.9 | 15.1 |
Article By InvestMacro – Receive our weekly COT Newsletter
*COT Report: The COT data, released weekly to the public each Friday, is updated through the most recent Tuesday (data is 3 days old) and shows a quick view of how large speculators or non-commercials (for-profit traders) were positioned in the futures markets.
The CFTC categorizes trader positions according to commercial hedgers (traders who use futures contracts for hedging as part of the business), non-commercials (large traders who speculate to realize trading profits) and nonreportable traders (usually small traders/speculators) as well as their open interest (contracts open in the market at time of reporting). See CFTC criteria here.


 Article by