The Crude Oil market on the D1 time frame was in an extended down trend until 26 September when a last lower bottom was recorded at 76.13. Bulls found the price attractive at those levels and demand started overcoming supply.
A closer look at the Momentum Oscillator reveals a positive divergence between points “a” and “b” when comparing the bottoms at 83.74 and 76.13. This could have alerted technical traders that the downtrend might be losing momentum.
After the lower bottom at 76.13, the price of Crude Oil broke through the 15 and 34 Simple Moving Averages and the Momentum Oscillator cut through the 100 base-line into bullish territory.
A higher top and possible critical resistance level formed on 10 Oct at 92.59. Bears are currently trying to drive the price lower but a possible higher bottom might be forming at a support level on 12 October at 85.17.
If the support level holds and the bulls manage to break through the critical resistance level at 92.59, then three possible price targets can be calculated from there. Applying the Fibonacci tool to the higher top at 92.59 and dragging it to the bottom of the support area at 85.17, the following targets may be considered. The first target may be likely at 97.18 (161%) and the second price target at 104.60 (261.8%). The third and final target may be expected at 116.60 (423.6%).
If the support level at 85.17 is broken, the bullish scenario is overturned and the scenario needs to be re-assessed.
As long as the supply remains constrained, the outlook for the Crude Oil market in the D1 time frame will remain bullish.
The Netflix, Inc. (NFLX) stock finished the day with a gain of 3.07 percent and closed the day around the 220.87 price level, according to unofficial data at the New York close.
Netflix, a technology streaming company that trades on the Nasdaq, opened the trading day at 214.3 price level with the high of the day hitting 223.67 and the low of the day bottoming at 212.7.
The Netflix stock has been trading in a recent range between $215 and $250 over the past few months. The company has an earnings release next week (with estimates of 2.15 earnings per share currently) that could spark a new path for the stock.
The NFLX Trend is Down, RSI level is Bearish
The stock is currently trending lower over the past 200 trading days, according to the linear regression line (red) seen on the chart below. Netflix has seen its share price fall from over $600 per share in December 2021 to just a little over a third of that amount as it trades at $220 today.
The Relative Strength Index, an indicator that can identify overbought (above 70) and oversold levels (below 30), shows that the current RSI is at a 43.0 score. This is a Bearish reading on the daily time-frame and the RSI line is headed lower as well.
NFLX Price Returns (Closing Price Changes)
The NFLX has declined by -9.92 percent over the past 10 days while seeing a gain by 0.10 over the past 30 days. The 90-day change is 11.00 while the 180-day return and the 365-day return are -39.72 and -56.62, respectively.
Cloudflare, Inc. End of Day Update: October 12 2022
The Cloudflare, Inc. (NET) stock finished the day with a gain of 3.37 percent and closed the day around the 51.46 price level, according to unofficial data at the New York close.
Cloudflare, a technology company focused on web security and performance, opened the trading day at 49.78 price level with the high of the day touching 51.56 while the low of the day bottomed at 48.11.
The Cloudflare stock had fallen for three straight days before today’s gain that bounced off the major support level of $50.
The NET Trend is Down, RSI level is Bearish
The stock is currently trending sharply lower over the past 200 trading days, according to the linear regression line (red) seen on the chart below. The share price has dropped sharply from near $140 in December 2021 to trading slightly above the $50 share price today.
The Relative Strength Index, an indicator that can identify overbought (above 70) and oversold levels (below 30), shows that the current RSI is at a 38.0 score. This is a Bearish reading on the daily time-frame and the RSI line is also pointing lower.
NET Price Returns (Closing Price Changes)
The NET is lower by -10.50 percent over the past 10 days while seeing a decline of -19.32 over the past 30 days. The 90-day change is -5.65 while the 180-day return and the 365-day return are -39.30 and -38.78, respectively.
NextEra Energy, Inc. End of Day Update: October 12 2022
The NextEra Energy, Inc. (NEE) stock finished the day with a slide by -3.71 percent and closed the day around the 73.0 price level, according to unofficial data at the New York close.
NEE, an energy company and electric utility with a market cap of over $140 billion, opened the day trading at 75.81 with the high of the day being 76.36 and the low of the day at 72.98.
This is the fifth consecutive day that the NEE stock has fallen and this streak has taken almost $10 off the stock value. NEE is now trading at the lowest level since June 22nd when the stock was on its way up and looks to test the major support level at $70.
The NEE Trend is Higher, RSI level is Bearish-Oversold
Despite, the recent declines, the NEE stock price is currently trending higher over the past 200 trading days, according to the linear regression line (red) seen in the chart below.
The Relative Strength Index, an indicator that can identify overbought (above 70) and oversold levels (below 30), shows that the current RSI is at a 27.5 score. This a Bearish-Oversold reading on the daily time-frame.
The chart below shows our slightly modified version of the RSI that uses a 3-period moving average to smooth the RSI output and signals.
NEE Price Returns (Closing Price Changes)
The NEE has slid by -11.38 percent over the past 10 days while seeing a decline of -14.82 over the past 30 days. The 90-day change is -6.78 while the 180-day return and the 365-day return are -1.22 and -1.90, respectively.
Wells Fargo & Company End of Day Update: October 12 2022
The Wells Fargo & Company (WFC) stock finished the day with an advance of 1.49 percent and closed the day around the 40.84 price level, according to unofficial data at the New York close.
Wells Fargo, an American banking and financial services company, opened the trading day at 40.24 with the high of the day reaching 41.22 and the low of the day bottoming at 39.95.
Today’s gain in WFC halted a streak of four consecutive daily declines that brought the stock down to the $40 major support level.
The WFC Trend is Down, RSI level is Bearish
The stock is currently trending lower over the past 200 trading days, according to the linear regression line (red) seen on the chart below. WFC reached a 2022 high near $60 early in the year before starting its downtrend that saw prices fall into the $30’s before coming back above $40 per share.
The Relative Strength Index, an indicator that can help identify overbought (above 70) and oversold levels (below 30), shows that the current RSI is at a 42.8 score. This is a Bearish reading on the daily time-frame.
WFC Price Returns (Closing Price Changes)
The WFC has advanced by just 0.07 percent over the past 10 days while the stock has fallen -7.48 over the past 30 days. The 90-day change is -8.25 while the 180-day return and the 365-day return are -22.50 and -7.73, respectively.
QUALCOMM Incorporated End of Day Update: October 12 2022
The QUALCOMM Incorporated (QCOM) stock closed down for the day with a decline of -1.05 percent and ended the day around the 109.16 price level, according to unofficial data at the New York close.
Qualcomm, an American technology company based in California, opened the trading day at the 110.32 level with the high of the day at 110.80 and the low of the day at 108.38.
Today saw the QCOM stock drop for its fourth consecutive day and dip to its lowest trading level since September 21st of 2020, a span of just over two years.
The QCOM Trend is down, RSI level is Bearish
The stock is currently trending lower over the past 200 days as seen by the linear regression trend line (red) in the chart below. QCOM has fallen from trading over $180 per share in late December 2021 to currently under $110 per share today.
The Relative Strength Index, an indicator that can indicate overbought (above 70) and oversold levels (below 30), shows that the current RSI is at a 31.3 score. This equates to a Bearish reading on the daily time-frame.
QCOM Price Returns (Closing Price Changes)
The QCOM is now down by -8.21 percent over the past 10 days while seeing a slide of -18.33 over the past 30 days. The 90-day change is -22.27 while the 180-day return and the 365-day return are -33.02 and -18.28, respectively.
– Sterling remains in the market headlines for all the wrong reasons thanks to growing uncertainty and confusion from not only the Bank of England but the UK government.
Pound bulls were dealt a heavy blow yesterday after Andrew Bailey warned that the central bank would not extend its emergency intervention beyond this week. However, prices later rebounded on reports that the BoE could extend bond purchases past Friday’s deadline. It does not end here. The prospects of more humiliating U-turns on the mini-Budget injected bulls with fresh confidence, sending the GBPUSD roughly 1% higher as of speaking. Despite the recent gains, bears remain in the vicinity thanks to the confusion with the path of least resistance for sterling pointing south.
Our focus this afternoon falls on pound crosses and the tool of choice will be none other than technical analysis.
GBPUSD not out of the woods yet
The British pound could be gearing for a steeper decline, especially after the bearish daily candle created on Tuesday. A breakdown below 1.0925 could signal a selloff towards 1.05200. Should 1.0925 prove to be reliable support, prices may venture towards 1.1300.
EURGBP trapped within a range
Despite the recent choppiness, the EURGBP remains trapped within a range on the daily charts with support at 0.8720 and resistance at 0.8850. A breakout could be on the horizon but this may require a fundamental spark. Should prices sink back below 0.8720, a decline towards 0.8650 and lower could be on the cards. Alternatively, a strong break above 0.8850 could suggest a move toward 0.9050.
GBPJPY presses against 50 SMA
After experiencing a sharp decline yesterday, the GBPJPY has clawed back almost all of its losses. Nevertheless, prices are back within a range with support at 160.00 and resistance at 164.00. A break below 160.00 may open a path back towards 158.00. Should bulls push the currency pair above 162.00, the GBPJPY could challenge 164.00.
GBPAUD eyes 1.7800
Prices are turning bullish on the daily charts with the first key level of interest around 1.7800. This is just above the 200-day Simple Moving Average which could act as a very tough resistance. A strong breakout above this point could encourage an incline toward 1.8100. Alternatively, sustained weakness below 1.7800 may signal a selloff towards 1.7350.
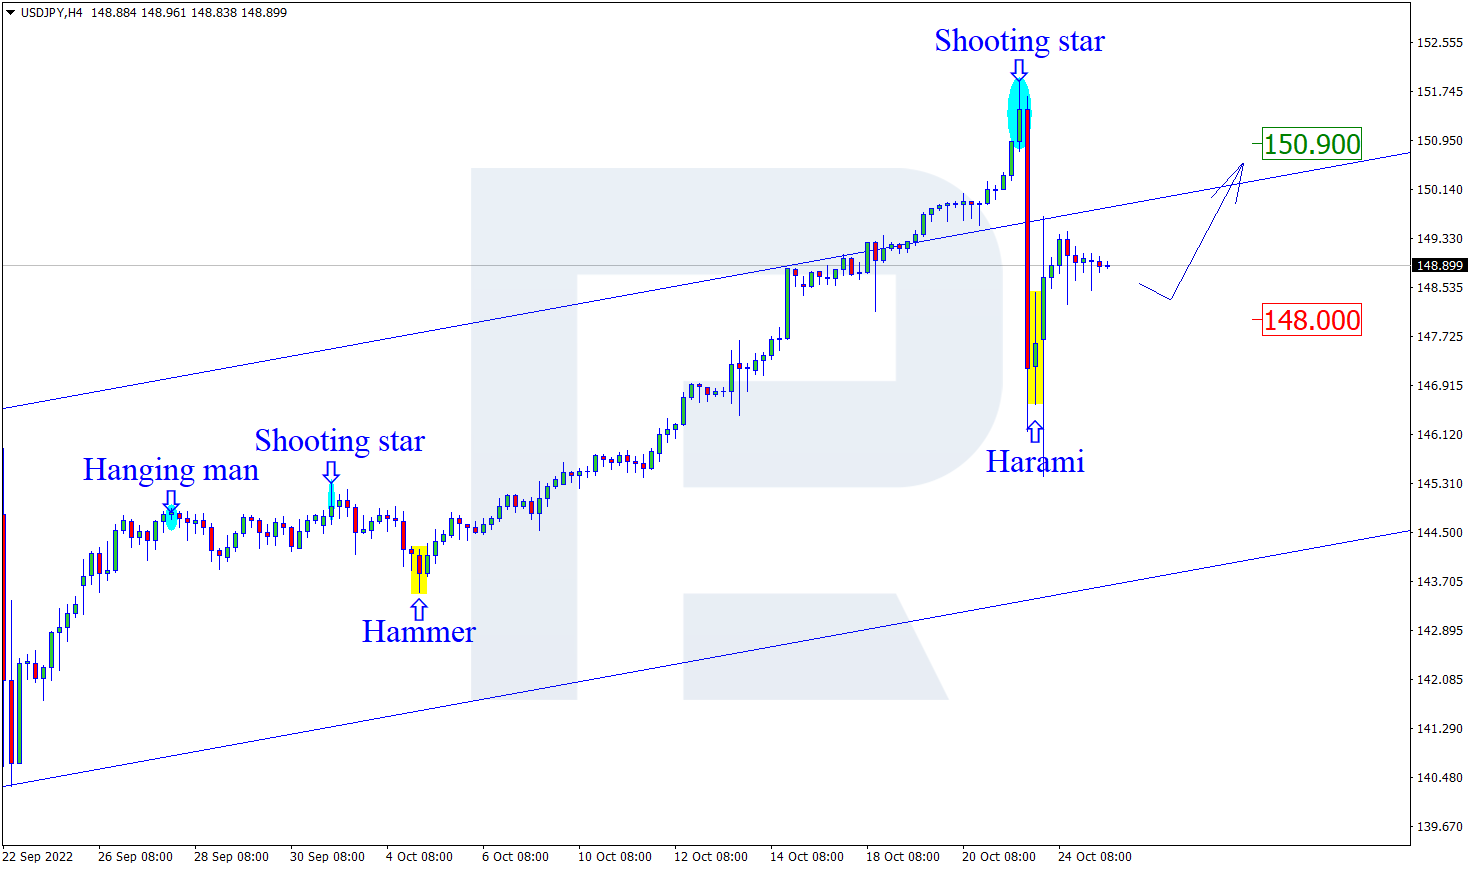
As we can see in the H4 chart, USDJPY is trading above the 200-day Moving Average to indicate a possible ascending tendency. However, after breaking 70, the Relative Strength Index is moving above it, signaling that the asset is “overbought” and may start a descending correction soon. In this case, the pair is expected to test 5/8 (145.51), break it, and then continue falling to reach the support at 4/8 (143.75). However, this scenario may be cancelled if the price breaks the resistance at 6/8 (146.87) to the upside. After that, the instrument may grow towards 7/8 (148.43).
In the M15 chart, the pair may break the downside line of the VoltyChannel indicator and, as a result, continue its decline.
USDCAD, “US Dollar vs Canadian Dollar”
As we can see in the H4 chart, USDCAD is moving within the “overbought area”. The Relative Strength Index has rebounded from the descending trendline. In this case, the price is expected to break +1/8 (1.3793) and continue moving downwards to reach the support at 7/8 (1.3549). However, this scenario may no longer be valid if the price breaks the resistance at +2/8 (1.3916) to the upside. After that, the lines in the chart will be redrawn, thus helping us to define new upside targets.
In the M15 chart, the pair may break the downside line of the VoltyChannel indicator and, as a result, continue trading downward
Attention! Forecasts presented in this section only reflect the author’s private opinion and should not be considered as guidance for trading. RoboForex LP bears no responsibility for trading results based on trading recommendations described in these analytical reviews.
The major currency pair managed to reach stability on Wednesday. The current quote for the instrument is 0.9730.
The United States secretary of the treasury Janet Yellen believes the current USD rate reflects the corresponding monetary policy. According to Yellen, there are no signs of financial instability in global capital markets. She said that strengthening of the American currency is a logical result of different policies e also said that a decline in the number of jobs offered relieves some stress in the employment sector.
The September labour market data showed stability in the sector: the Unemployment Rate dropped to 3.5%, the Non-Farm Payrolls showed 263K. Experts were expecting weaker readings, which might force the US FOMC to slow down its aggressive monetary tightening. However, it didn’t work.
In the afternoon, the Euro Area will report on the Industrial Production, which might add 0.6% m/m in August after losing 2.3% m/m the month before. Later in the evening, investors will switch their attention to the FOMC Meeting Minutes.
Attention! Forecasts presented in this section only reflect the author’s private opinion and should not be considered as guidance for trading. RoboForex LP bears no responsibility for trading results based on trading recommendations described in these analytical reviews.
Recent strong US Labor Market reports have dashed market participants’ hopes that Fed policymakers may slow down the rate hikes before the end of the year. HSBC is selling the euro against the US dollar, expecting a retest of the 2022 lows, as the recent rally is seen as a reduction in investor sentiment due to premature hopes of a Federal Reserve reversal. HSBC has been advocating a drop in the euro for more than a year and believes the euro will fall even further in the coming months.
From the technical point of view, the trend on the EUR/USD currency pair on the hourly time frame is bullish. The MACD indicator became inactive, and the price is forming a balance. Buy trades should be considered from the support level of 0.9667, but with additional confirmation in the form of reverse initiative. Sell deals can be considered from the resistance level of 0.9743, but only with confirmation.
Alternative scenario: if the price breaks down through the support level of 0.9666 and fixes below it, the downtrend will likely resume.
News feed for 2022.10.12:
– Eurozone Industrial Production (m/m) at 12:00 (GMT+3);
– US Producer Price Index (m/m) at 15:30 (GMT+3);
– Eurozone ECB President Lagarde Speaks (m/m) at 16:30 (GMT+3);
– US FOMC Meeting Minutes at 21:00 (GMT+3).
The GBP/USD currency pair
Technical indicators of the currency pair:
Prev Open: 1.1055
Prev Close: 1.0963
% chg. over the last day: -0.84 %
The pound fell to a new two-week low after Bank of England Governor Andrew Bailey confirmed that the central bank would end its emergency bond-buying program on Friday and told pension fund managers to complete rebalancing their positions within that time frame. The Bank of England also signaled to bankers that it might extend its bond-buying program beyond Friday’s deadline if market conditions require it. The movements in the UK bond market are confusing investors. Analysts believe that the situation may worsen. As a result, such uncertainty scares investors, who sell the British pound and move to safe-haven assets.
Trading recommendations
Support levels: 1.0956, 1.0915, 1.0816, 1.0711, 1.03
From the technical point of view, the GBP/USD currency pair trend on the hourly time frame is bullish. The MACD indicator is in the negative zone, but there is a divergence, indicating the sellers’ weakness. Under such market conditions, buy trades can be considered from the support level of 1.0956 or 1.0915. Sell trades are best to look for on intraday time frames, and the nearest resistance level is 1.1130, but better with confirmation.
Alternative scenario: if the price breaks down of the 1.0915 support level and fixes below it, the downtrend will likely resume.
News feed for 2022.10.12:
– UK GDP (m/m) at 09:00 (GMT+3);
– UK Industrial Production (m/m) at 09:00 (GMT+3);
– UK Manufacturing Production (m/m) at 09:00 (GMT+3);
– UK FPC Meeting Minutes (Tentative);
– UK FPC Statement (Tentative).
The USD/JPY currency pair
Technical indicators of the currency pair:
Prev Open: 145.71
Prev Close: 145.85
% chg. over the last day: +0.10 %
The Japanese yen has again renewed its 24-year low against the US dollar. Japan’s top currency diplomat spoke on potential currency intervention Tuesday, saying the authorities had always been ready to take necessary measures against excessive currency volatility. At a regular briefing Wednesday, the chief cabinet secretary said that officials remain ready to take appropriate steps to counter excessive currency volatility. But analysts say it is not worth waiting for a second intervention, as it is costly and has only a temporary effect. To stop the trend, either the Bank of Japan needs to start shifting from a softer monetary policy to a more neutral one, or the US Federal Reserve needs to change its approach and reduce its aggressive attitude towards interest rate hikes.
Trading recommendations
Support levels: 145.92, 144.91, 144.16, 143.00, 140.60, 139.61, 138.78, 137.65
Resistance levels: 147.00, 148.00
From the technical point of view, the medium-term trend on the currency pair USD/JPY is bullish. The price is trading above the moving levels. The MACD indicator is in the positive zone, but divergence has appeared. Under such market conditions, buy trades can be sought on the intraday time frames from the support level of 145.92, but with confirmation. Sell deals can be searched from the resistance level of 147.00 or 148.00, but only with additional confirmation in the form of a reverse initiative.
Alternative scenario: If the price fixes below 143.00, the downtrend will likely resume.
There is no news feed for today.
The USD/CAD currency pair
Technical indicators of the currency pair:
Prev Open: 1.3774
Prev Close: 1.3794
% chg. over the last day: +0.15 %
The Canadian dollar is a commodity currency and depends not only on the monetary policy of the Bank of Canada but also on the dollar index and oil prices. Oil prices continued to fall yesterday as the number of Covid cases in China reached the highest level since August, which will lead to lower demand. Fundamentals are predicting higher oil prices due to significant OPEC production cuts, but any disruption in risky assets could continue to negatively impact oil prices.
Trading recommendations
Support levels: 1.3675, 1.3619, 1.3583, 1.3535, 1.3454
Resistance levels: 1.3755, 1.3858, 1.3968
From the point of view of technical analysis, the trend on the USD/CAD currency pair is bullish. The price is trading above the moving lines. The MACD indicator is positive, but there is a divergence. Under such market conditions, buy trades should be considered on the lower time frames from the support level of 1.3752, but with confirmation. For selling, it is better to consider the resistance level of 1.3858, but only after the additional confirmation
Alternative scenario: if the price breaks down and consolidates below the support level of 1.3583, the downtrend will likely resume.
This article reflects a personal opinion and should not be interpreted as an investment advice, and/or offer, and/or a persistent request for carrying out financial transactions, and/or a guarantee, and/or a forecast of future events.