By InvestMacro
Here are the latest charts and statistics for the Commitment of Traders (COT) data published by the Commodities Futures Trading Commission (CFTC).
The latest COT data is updated through Tuesday January 13th and shows a quick view of how large traders (for-profit speculators and commercial entities) were positioned in the futures markets.
Weekly Speculator Changes led by the Bloomberg Commodity Index & WTI Crude Oil
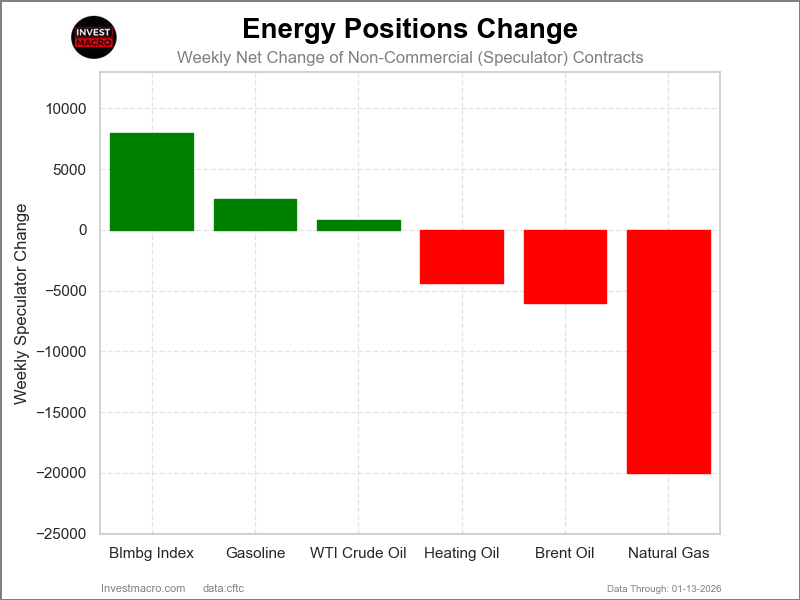
The COT energy market speculator bets were mixed this week as three out of the six energy markets we cover had higher positioning while the other three markets had lower speculator contracts.
Leading the gains for the energy markets was the Bloomberg Commodity Index (7,989 contracts) with Gasoline (2,569 contracts) and WTI Crude (776 contracts) also having positive weeks.
The markets with declines in speculator bets for the week were Natural Gas (-20,042 contracts), Brent Oil (-6,035 contracts) and with Heating Oil (-4,359 contracts) also seeing lower bets on the week.
Energy Market Price Performance led by Heating Oil
The energy markets saw Heating Oil lead the price performance over the last five days with a gain by 3.7%. Brent Crude Oil was up by 1.79%, while the Bloomberg Commodity Index rose by 1.53% on the week. WTI Crude Oil was also higher by 1.22%, and Gasoline rose by approximately 0.50%.
The only energy market with a down week was Natural Gas, which fell by -0.62%. Natural Gas has been on a strong downtrend and has fallen by 33% in the past 30 days, and by 22% over the past 90 days.
Energy Data:
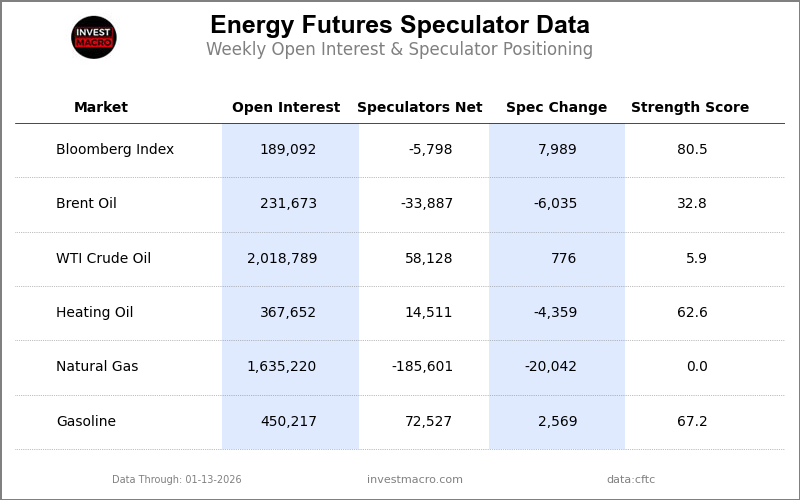
Legend: Weekly Speculators Change | Speculators Current Net Position | Speculators Strength Score compared to last 3-Years (0-100 range)
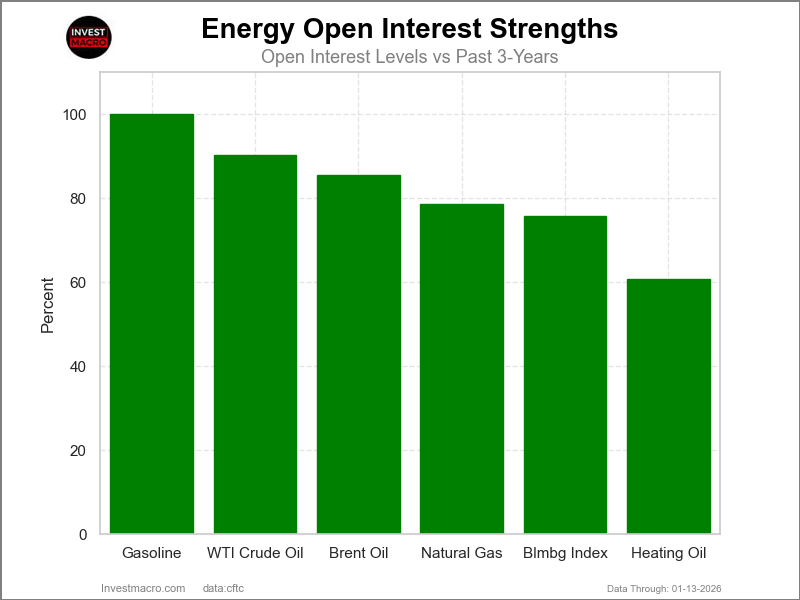
Strength Scores led by Bloomberg Index & Gasoline
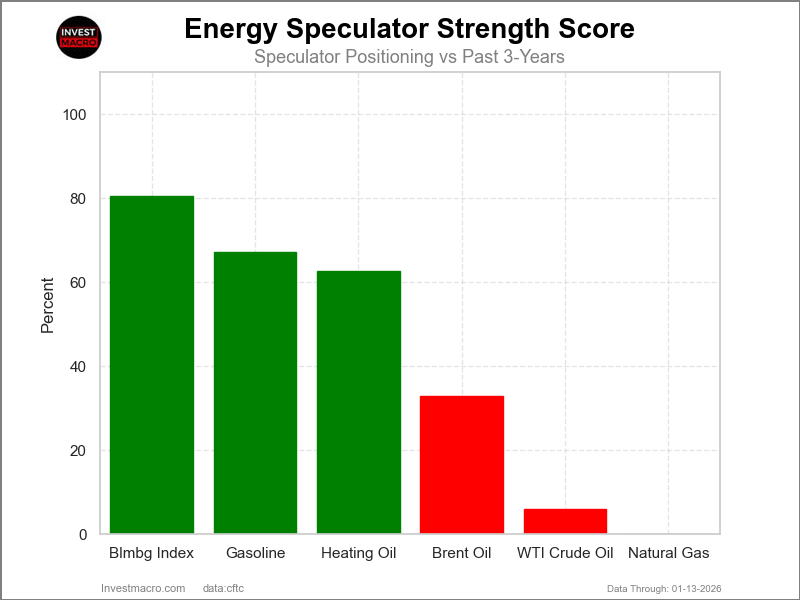
COT Strength Scores (a normalized measure of Speculator positions over a 3-Year range, from 0 to 100 where above 80 is Extreme-Bullish and below 20 is Extreme-Bearish) showed that Bloomberg Index (80.5 percent) and Gasoline (67.2 percent) lead the energy markets this week.
On the downside, Natural Gas (0.0 percent) and WTI Crude (5.9 percent) come in at the lowest strength level currently and is in Extreme-Bearish territory (below 20 percent).
Strength Statistics:
WTI Crude Oil (5.9 percent) vs WTI Crude Oil previous week (5.7 percent)
Brent Crude Oil (32.8 percent) vs Brent Crude Oil previous week (41.4 percent)
Natural Gas (0.0 percent) vs Natural Gas previous week (14.9 percent)
Gasoline (67.2 percent) vs Gasoline previous week (64.4 percent)
Heating Oil (62.6 percent) vs Heating Oil previous week (68.3 percent)
Bloomberg Commodity Index (80.5 percent) vs Bloomberg Commodity Index previous week (44.7 percent)
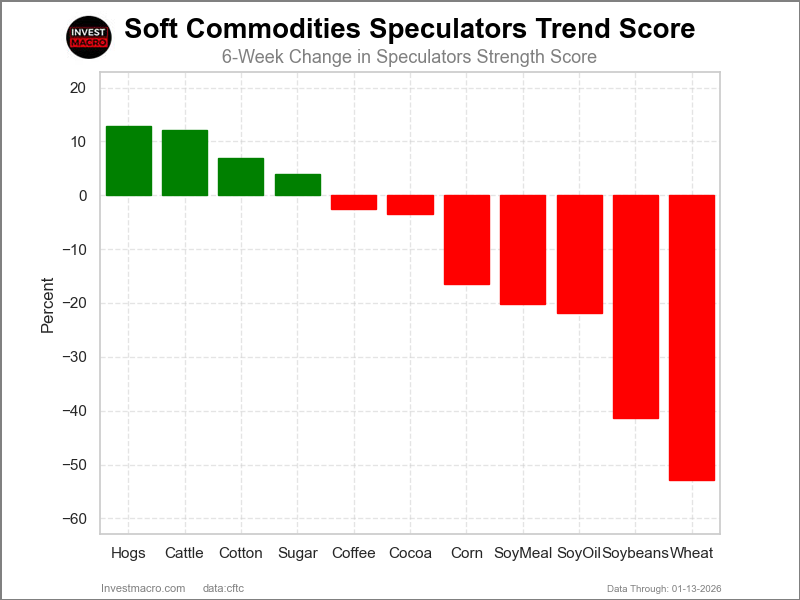
Bloomberg Index & WTI Crude top the 6-Week Strength Trends
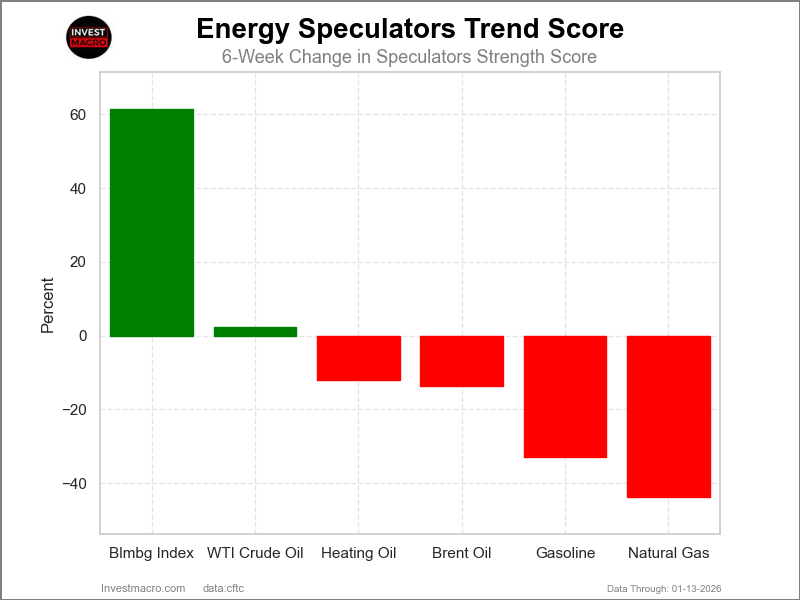
COT Strength Score Trends (or move index, calculates the 6-week changes in strength scores) showed that Bloomberg Index (61.5 percent) and WTI Crude (2.3 percent) lead the past six weeks trends for the energy markets.
Natural Gas (-43.8 percent), Gasoline (-32.8 percent) and Brent Oil (-13.6 percent) lead the downside trend scores currently.
Move Statistics:
WTI Crude Oil (2.3 percent) vs WTI Crude Oil previous week (0.8 percent)
Brent Crude Oil (-13.6 percent) vs Brent Crude Oil previous week (-1.2 percent)
Natural Gas (-43.8 percent) vs Natural Gas previous week (-20.1 percent)
Gasoline (-32.8 percent) vs Gasoline previous week (-23.2 percent)
Heating Oil (-11.9 percent) vs Heating Oil previous week (-0.5 percent)
Bloomberg Commodity Index (61.5 percent) vs Bloomberg Commodity Index previous week (23.5 percent)
Individual COT Market Charts:
WTI Crude Oil Futures:
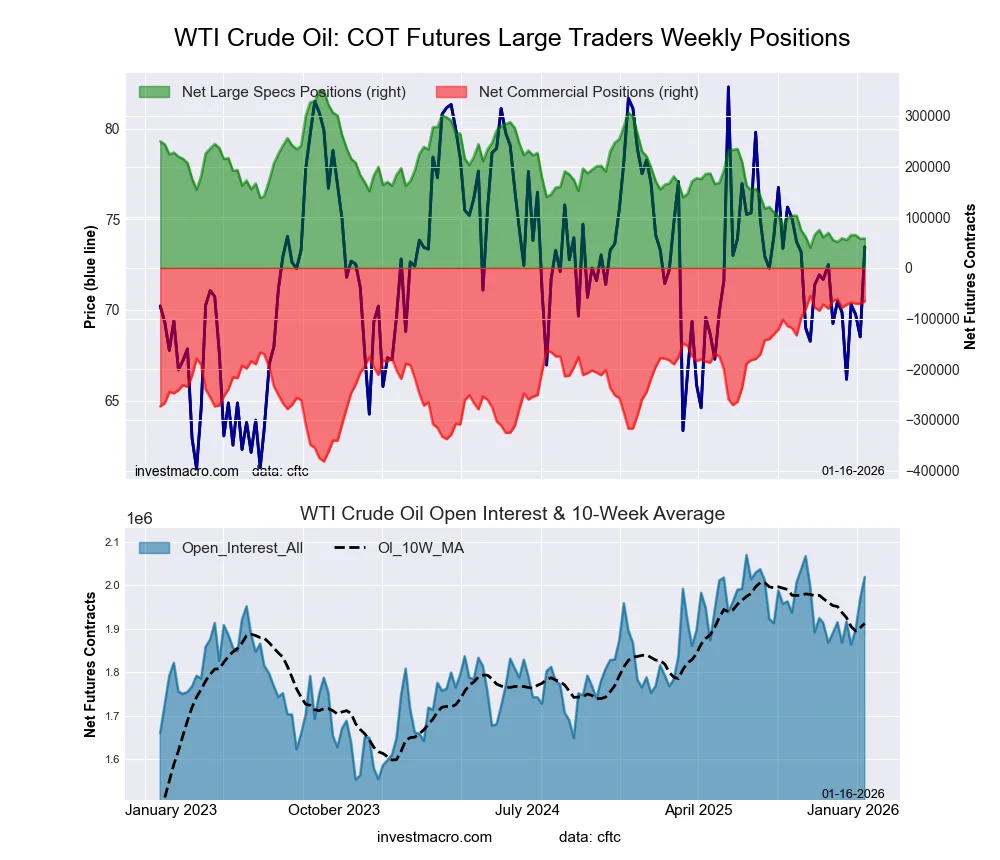 The WTI Crude Oil Futures large speculator standing this week reached a net position of 58,128 contracts in the data reported through Tuesday. This was a weekly lift of 776 contracts from the previous week which had a total of 57,352 net contracts.
This week’s current strength score (the trader positioning range over the past three years, measured from 0 to 100) shows the speculators are currently Bearish-Extreme with a score of 5.9 percent. The commercials are Bullish-Extreme with a score of 96.8 percent and the small traders (not shown in chart) are Bearish-Extreme with a score of 16.1 percent.
Price Trend-Following Model: Weak Downtrend
Our weekly trend-following model classifies the current market price position as: Weak Downtrend.
| WTI Crude Oil Futures Statistics | SPECULATORS | COMMERCIALS | SMALL TRADERS |
| – Percent of Open Interest Longs: | 14.2 | 42.4 | 3.2 |
| – Percent of Open Interest Shorts: | 11.3 | 45.6 | 2.9 |
| – Net Position: | 58,128 | -65,450 | 7,322 |
| – Gross Longs: | 286,136 | 855,313 | 65,125 |
| – Gross Shorts: | 228,008 | 920,763 | 57,803 |
| – Long to Short Ratio: | 1.3 to 1 | 0.9 to 1 | 1.1 to 1 |
| NET POSITION TREND: | |||
| – Strength Index Score (3 Year Range Pct): | 5.9 | 96.8 | 16.1 |
| – Strength Index Reading (3 Year Range): | Bearish-Extreme | Bullish-Extreme | Bearish-Extreme |
| NET POSITION MOVEMENT INDEX: | |||
| – 6-Week Change in Strength Index: | 2.3 | -1.3 | -6.0 |
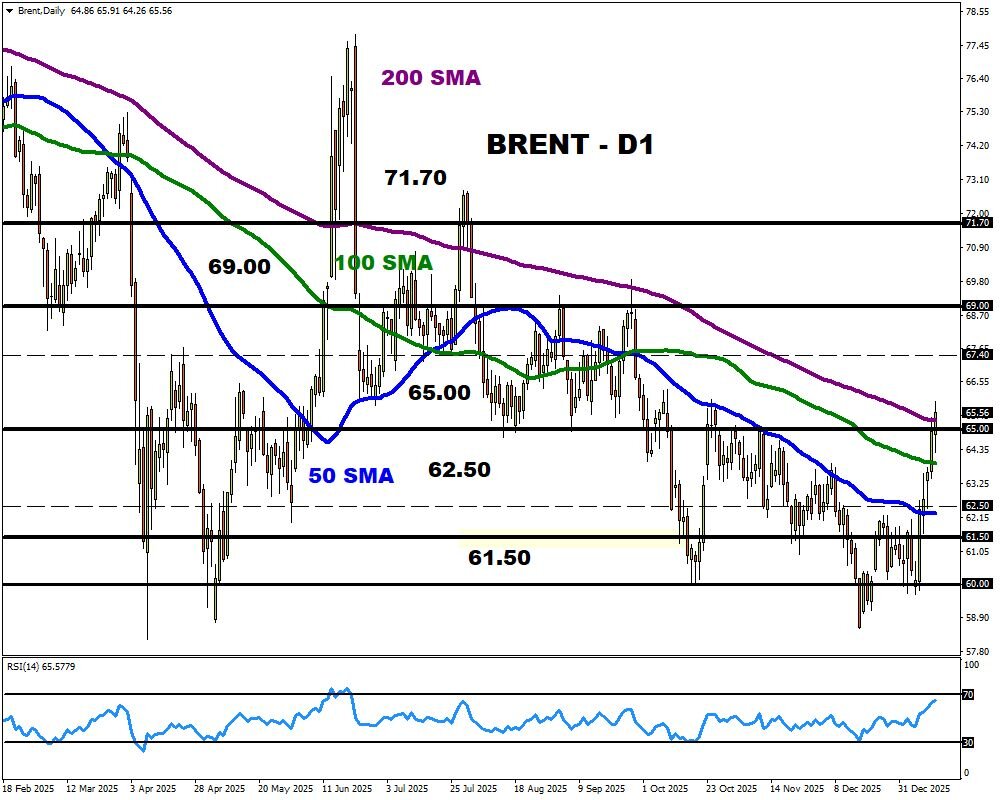
Brent Crude Oil Futures:
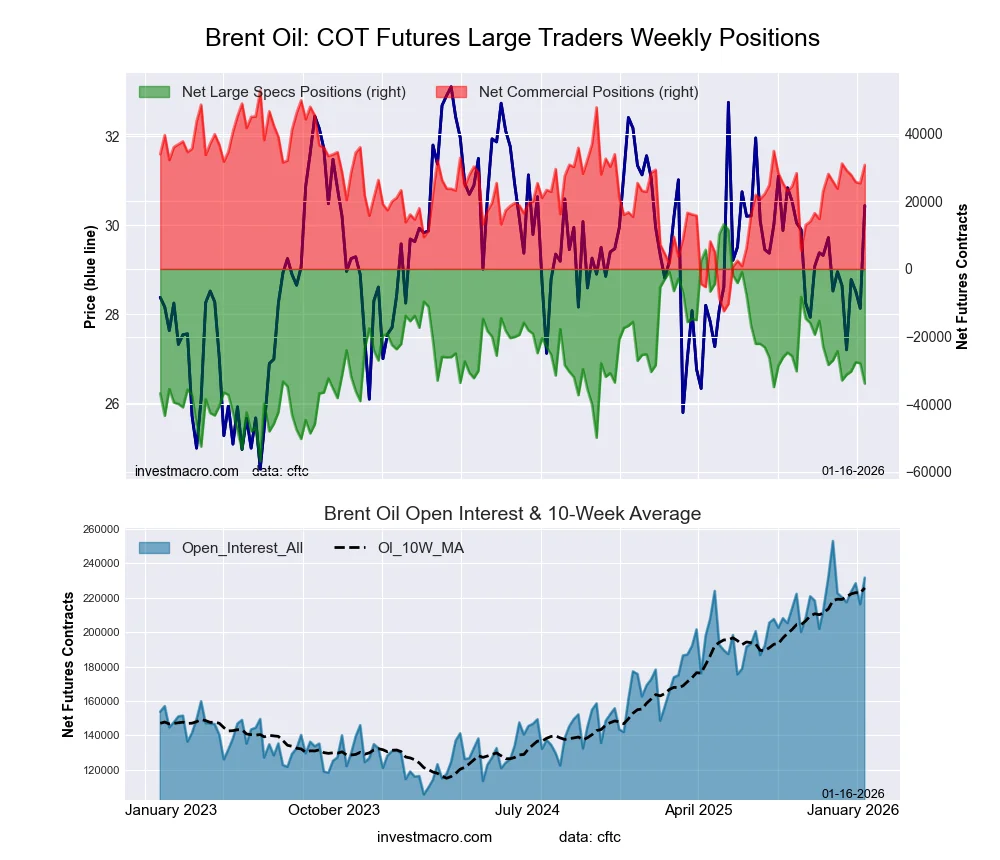 The Brent Crude Oil Futures large speculator standing this week reached a net position of -33,887 contracts in the data reported through Tuesday. This was a weekly fall of -6,035 contracts from the previous week which had a total of -27,852 net contracts.
This week’s current strength score (the trader positioning range over the past three years, measured from 0 to 100) shows the speculators are currently Bearish with a score of 32.8 percent. The commercials are Bullish with a score of 66.3 percent and the small traders (not shown in chart) are Bullish with a score of 71.7 percent.
Price Trend-Following Model: Weak Downtrend
Our weekly trend-following model classifies the current market price position as: Weak Downtrend.
| Brent Crude Oil Futures Statistics | SPECULATORS | COMMERCIALS | SMALL TRADERS |
| – Percent of Open Interest Longs: | 22.6 | 34.5 | 3.5 |
| – Percent of Open Interest Shorts: | 37.2 | 21.2 | 2.2 |
| – Net Position: | -33,887 | 30,758 | 3,129 |
| – Gross Longs: | 52,273 | 79,946 | 8,124 |
| – Gross Shorts: | 86,160 | 49,188 | 4,995 |
| – Long to Short Ratio: | 0.6 to 1 | 1.6 to 1 | 1.6 to 1 |
| NET POSITION TREND: | |||
| – Strength Index Score (3 Year Range Pct): | 32.8 | 66.3 | 71.7 |
| – Strength Index Reading (3 Year Range): | Bearish | Bullish | Bullish |
| NET POSITION MOVEMENT INDEX: | |||
| – 6-Week Change in Strength Index: | -13.6 | 10.8 | 29.4 |
Natural Gas Futures:
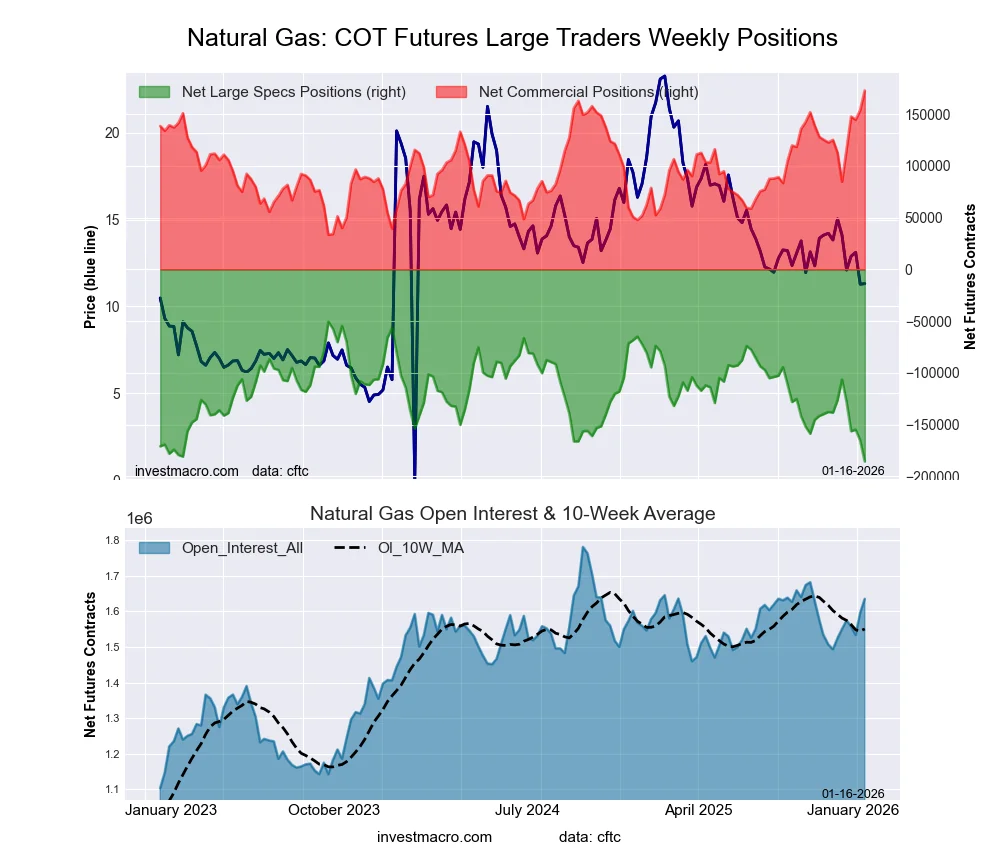 The Natural Gas Futures large speculator standing this week reached a net position of -185,601 contracts in the data reported through Tuesday. This was a weekly lowering of -20,042 contracts from the previous week which had a total of -165,559 net contracts.
This week’s current strength score (the trader positioning range over the past three years, measured from 0 to 100) shows the speculators are currently Bearish-Extreme with a score of 0.0 percent. The commercials are Bullish-Extreme with a score of 100.0 percent and the small traders (not shown in chart) are Bearish with a score of 35.0 percent.
Price Trend-Following Model: Strong Downtrend
Our weekly trend-following model classifies the current market price position as: Strong Downtrend.
| Natural Gas Futures Statistics | SPECULATORS | COMMERCIALS | SMALL TRADERS |
| – Percent of Open Interest Longs: | 16.5 | 36.8 | 3.4 |
| – Percent of Open Interest Shorts: | 27.9 | 26.3 | 2.6 |
| – Net Position: | -185,601 | 172,844 | 12,757 |
| – Gross Longs: | 270,263 | 602,296 | 54,985 |
| – Gross Shorts: | 455,864 | 429,452 | 42,228 |
| – Long to Short Ratio: | 0.6 to 1 | 1.4 to 1 | 1.3 to 1 |
| NET POSITION TREND: | |||
| – Strength Index Score (3 Year Range Pct): | 0.0 | 100.0 | 35.0 |
| – Strength Index Reading (3 Year Range): | Bearish-Extreme | Bullish-Extreme | Bearish |
| NET POSITION MOVEMENT INDEX: | |||
| – 6-Week Change in Strength Index: | -43.8 | 42.9 | -1.6 |
Gasoline Blendstock Futures:
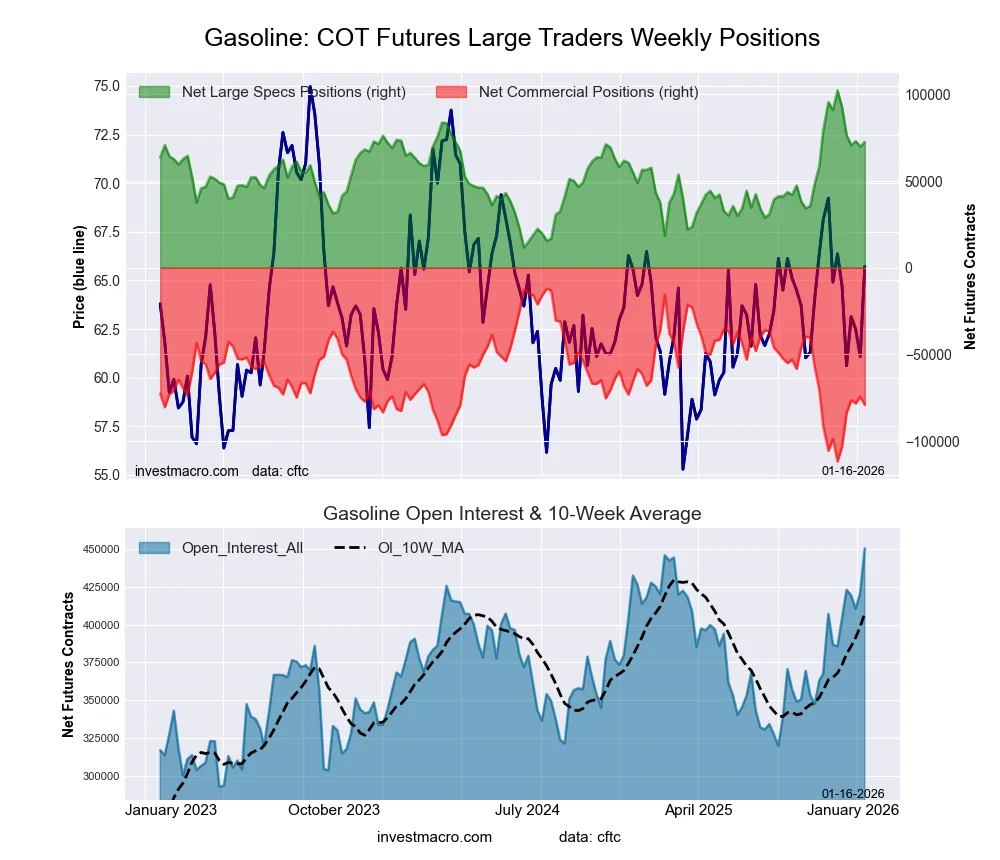 The Gasoline Blendstock Futures large speculator standing this week reached a net position of 72,527 contracts in the data reported through Tuesday. This was a weekly gain of 2,569 contracts from the previous week which had a total of 69,958 net contracts.
This week’s current strength score (the trader positioning range over the past three years, measured from 0 to 100) shows the speculators are currently Bullish with a score of 67.2 percent. The commercials are Bearish with a score of 32.8 percent and the small traders (not shown in chart) are Bullish with a score of 59.4 percent.
Price Trend-Following Model: Weak Downtrend
Our weekly trend-following model classifies the current market price position as: Weak Downtrend.
| Nasdaq Mini Futures Statistics | SPECULATORS | COMMERCIALS | SMALL TRADERS |
| – Percent of Open Interest Longs: | 24.2 | 48.5 | 5.8 |
| – Percent of Open Interest Shorts: | 8.1 | 66.0 | 4.3 |
| – Net Position: | 72,527 | -79,062 | 6,535 |
| – Gross Longs: | 109,165 | 218,251 | 26,081 |
| – Gross Shorts: | 36,638 | 297,313 | 19,546 |
| – Long to Short Ratio: | 3.0 to 1 | 0.7 to 1 | 1.3 to 1 |
| NET POSITION TREND: | |||
| – Strength Index Score (3 Year Range Pct): | 67.2 | 32.8 | 59.4 |
| – Strength Index Reading (3 Year Range): | Bullish | Bearish | Bullish |
| NET POSITION MOVEMENT INDEX: | |||
| – 6-Week Change in Strength Index: | -32.8 | 32.8 | -17.0 |
#2 Heating Oil NY-Harbor Futures:
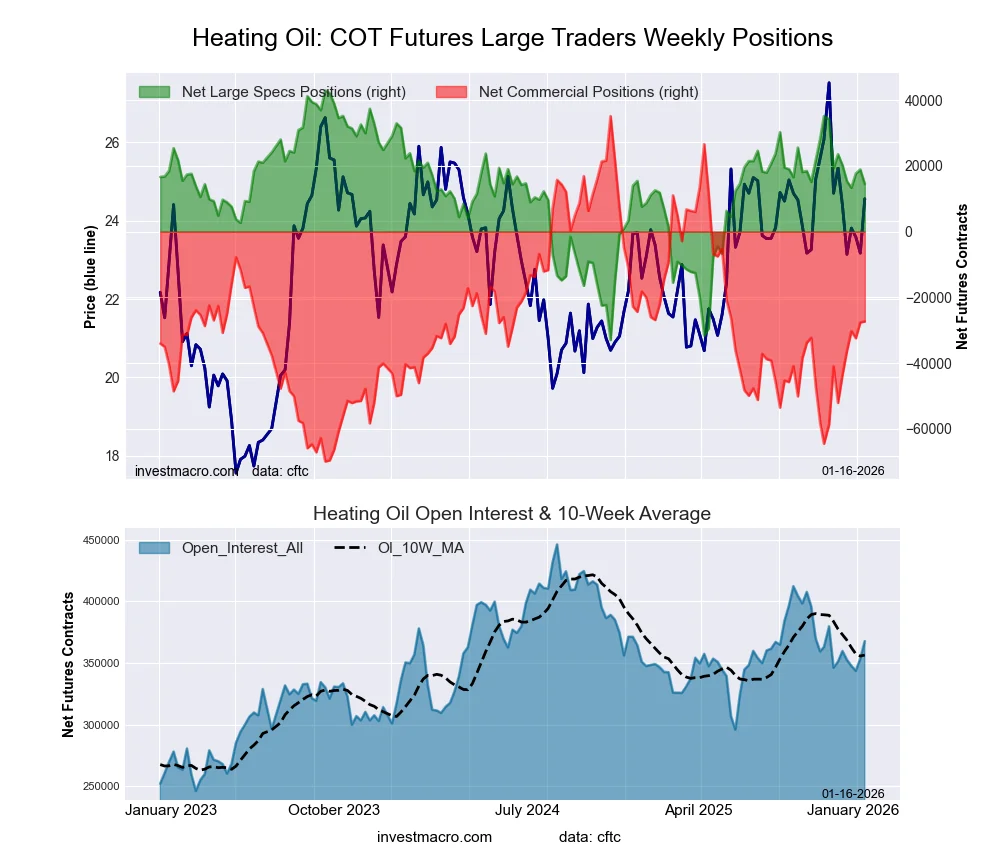 The #2 Heating Oil NY-Harbor Futures large speculator standing this week reached a net position of 14,511 contracts in the data reported through Tuesday. This was a weekly decline of -4,359 contracts from the previous week which had a total of 18,870 net contracts.
This week’s current strength score (the trader positioning range over the past three years, measured from 0 to 100) shows the speculators are currently Bullish with a score of 62.6 percent. The commercials are Bearish with a score of 40.5 percent and the small traders (not shown in chart) are Bullish with a score of 53.2 percent.
Price Trend-Following Model: Weak Downtrend
Our weekly trend-following model classifies the current market price position as: Weak Downtrend.
| Heating Oil Futures Statistics | SPECULATORS | COMMERCIALS | SMALL TRADERS |
| – Percent of Open Interest Longs: | 17.1 | 47.6 | 12.4 |
| – Percent of Open Interest Shorts: | 13.2 | 55.0 | 8.9 |
| – Net Position: | 14,511 | -27,335 | 12,824 |
| – Gross Longs: | 62,981 | 174,862 | 45,706 |
| – Gross Shorts: | 48,470 | 202,197 | 32,882 |
| – Long to Short Ratio: | 1.3 to 1 | 0.9 to 1 | 1.4 to 1 |
| NET POSITION TREND: | |||
| – Strength Index Score (3 Year Range Pct): | 62.6 | 40.5 | 53.2 |
| – Strength Index Reading (3 Year Range): | Bullish | Bearish | Bullish |
| NET POSITION MOVEMENT INDEX: | |||
| – 6-Week Change in Strength Index: | -11.9 | 23.6 | -43.0 |
Bloomberg Commodity Index Futures:
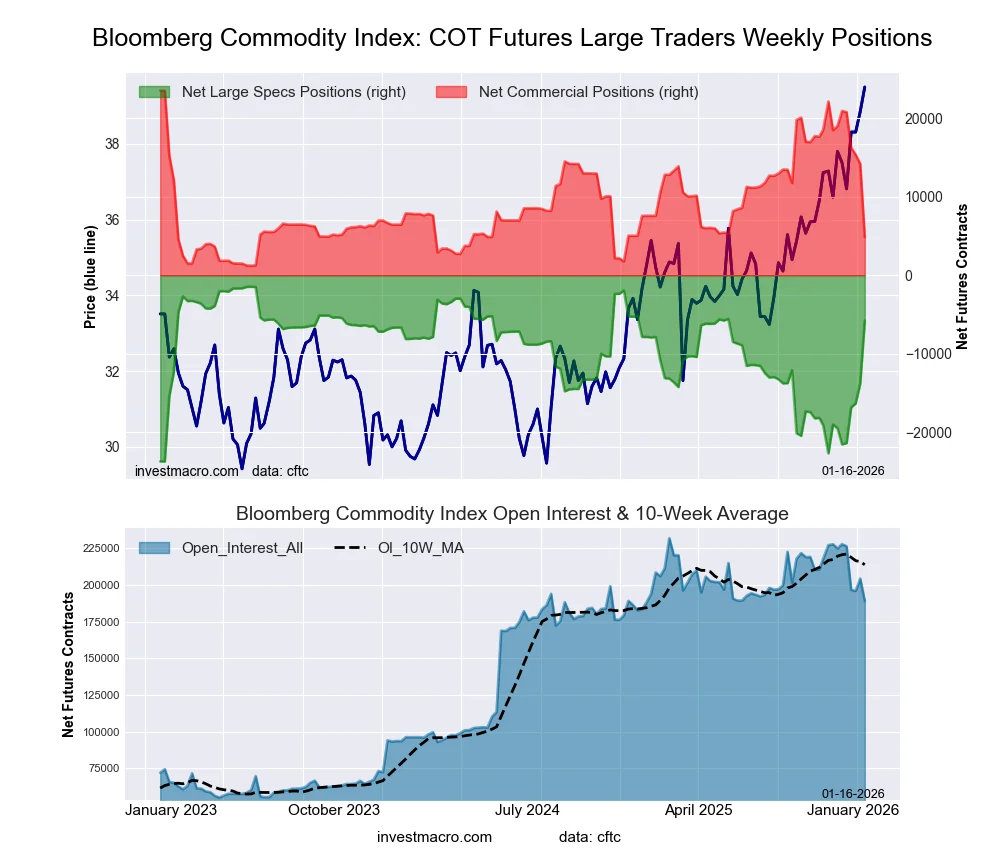 The Bloomberg Commodity Index Futures large speculator standing this week reached a net position of -5,798 contracts in the data reported through Tuesday. This was a weekly advance of 7,989 contracts from the previous week which had a total of -13,787 net contracts.
This week’s current strength score (the trader positioning range over the past three years, measured from 0 to 100) shows the speculators are currently Bullish-Extreme with a score of 80.5 percent. The commercials are Bearish-Extreme with a score of 16.3 percent and the small traders (not shown in chart) are Bullish with a score of 61.9 percent.
Price Trend-Following Model: Strong Uptrend
Our weekly trend-following model classifies the current market price position as: Strong Uptrend.
| Bloomberg Index Futures Statistics | SPECULATORS | COMMERCIALS | SMALL TRADERS |
| – Percent of Open Interest Longs: | 27.5 | 69.6 | 0.5 |
| – Percent of Open Interest Shorts: | 30.5 | 67.0 | 0.0 |
| – Net Position: | -5,798 | 4,845 | 953 |
| – Gross Longs: | 51,952 | 131,526 | 974 |
| – Gross Shorts: | 57,750 | 126,681 | 21 |
| – Long to Short Ratio: | 0.9 to 1 | 1.0 to 1 | 46.4 to 1 |
| NET POSITION TREND: | |||
| – Strength Index Score (3 Year Range Pct): | 80.5 | 16.3 | 61.9 |
| – Strength Index Reading (3 Year Range): | Bullish-Extreme | Bearish-Extreme | Bullish |
| NET POSITION MOVEMENT INDEX: | |||
| – 6-Week Change in Strength Index: | 61.5 | -63.4 | 20.5 |
Article By InvestMacro – Receive our weekly COT Newsletter
*COT Report: The COT data, released weekly to the public each Friday, is updated through the most recent Tuesday (data is 3 days old) and shows a quick view of how large speculators or non-commercials (for-profit traders) were positioned in the futures markets.
The CFTC categorizes trader positions according to commercial hedgers (traders who use futures contracts for hedging as part of the business), non-commercials (large traders who speculate to realize trading profits) and nonreportable traders (usually small traders/speculators) as well as their open interest (contracts open in the market at time of reporting). See CFTC criteria here.