By JustMarkets
The US stocks rose firmly on Thursday, driven by a sharp improvement in sentiment within the technology sector and a generally positive flow of macroeconomic data. At the close of Thursday, the Dow Jones Index (US30) gained 0.60%. The S&P 500 (US500) rose by 0.26%. The technology-heavy Nasdaq (US100) finished higher by 0.26%. The key market driver was the earnings report from Taiwan Semiconductor Manufacturing Company (TSMC), which bolstered investor confidence in the long-term AI-related investment cycle. The company reported a 35% increase in fourth-quarter profit and provided a more optimistic revenue prognosis than expected. This triggered a broad rally in semiconductor stocks and related equipment manufacturers, restoring risk appetite across the entire tech sector.
In geopolitics, the tone became less strained following a softening of US President Donald Trump’s rhetoric regarding Iran. However, uncertainty persists due to his statements regarding Greenland.
The Canadian dollar (CAD) weakened to 1.39 against the US dollar, remaining in a tight range near early December lows, as a strengthening US dollar and falling oil prices outweighed relatively stable domestic factors. The easing of President Trump’s rhetoric on Iran led to a reduction in the geopolitical premium in oil, putting pressure on commodity prices and weakening CAD support from trade conditions. Domestically, pressure on the currency persists due to a sluggish labor market: the unemployment rate remains around 6.8%, anchoring the Bank of Canada’s neutral stance and limiting the potential for policy tightening to support the currency.
The Mexican peso (MXN) strengthened to 17.65 per US dollar, its highest level since July 2024, thanks to a renewed influx of capital through carry-trade operations, driven by Mexico’s persistently high real interest rates. Banxico slowed its rate-cutting cycle, holding the benchmark rate at 7% and signaling the need for caution amid persistent core inflation. This maintains one of the widest real yield differentials in emerging markets, supporting capital inflows into peso-denominated fixed-income assets.
European equity markets traded without a unified trend on Thursday. The German DAX (DE40) rose by 0.26%, the French CAC 40 (FR40) closed down 0.21%, the Spanish IBEX 35 (ES35) fell by 0.30%, and the British FTSE 100 (UK100) finished up 0.54%. Investors reacted positively to a combination of encouraging macroeconomic data and corporate news while accounting for the geopolitical backdrop. The market was supported by fresh data indicating that the German economy returned to moderate growth in 2025, expanding by 0.2% after two years of decline. Additional momentum came from the technology sector amid renewed AI optimism following TSMC’s record results, which improved sentiment in the high-tech and industrial segments.
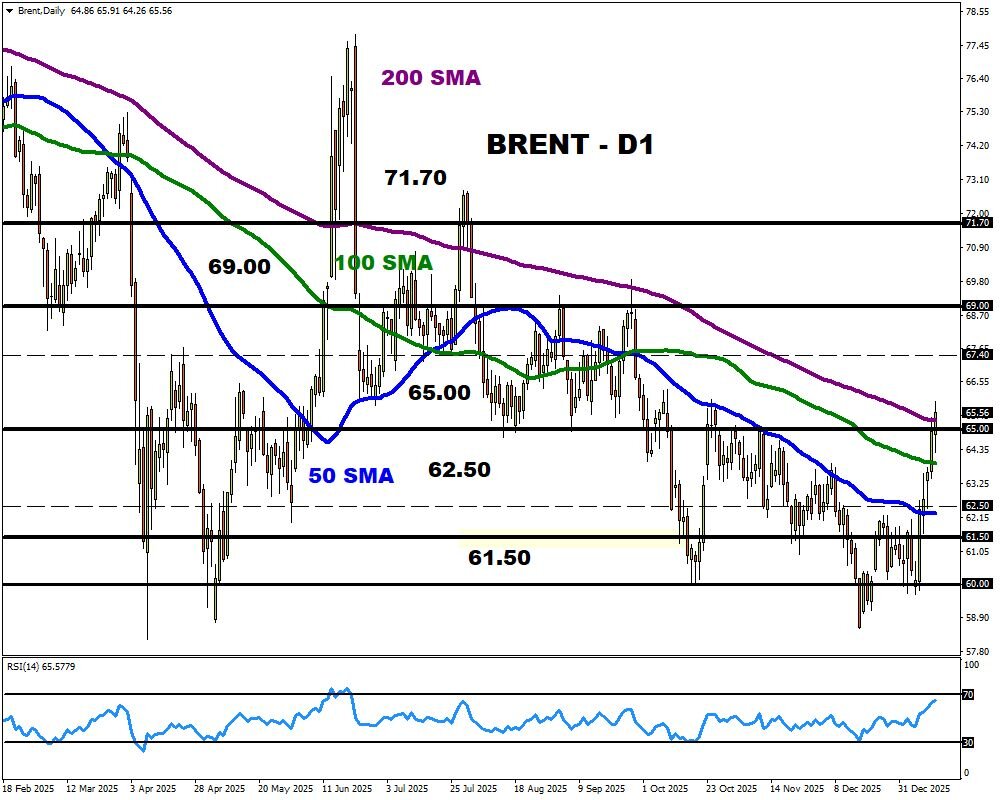
WTI crude oil prices collapsed nearly 5% on Thursday to $59 per barrel, marking the sharpest one-day drop since October as geopolitical risks surrounding Iran receded. The primary trigger was US President Donald Trump’s statement that he had received assurances from the Iranian side regarding the cessation of protester killings. This dampened expectations of immediate US military intervention and sharply reduced fears of disruptions to Iranian production and strategic supply routes. Additionally, Trump noted his belief that Venezuela should remain in OPEC, which markets interpreted as a signal to maintain the status quo on supply rather than pursue sharp cuts.
Asian markets traded without a unified trend yesterday. The Japanese Nikkei 225 (JP225) fell by 0.42%, the Chinese FTSE China A50 (CHA50) dropped 0.51%, Hong Kong’s Hang Seng (HK50) shed 0.28%, while the Australian ASX 200 (AU200) posted a positive result of 0.47%.
The New Zealand dollar (NZD) strengthened to the 0.575 level on Friday and is heading for a weekly gain following a series of positive signals from the real sector. The BusinessNZ Performance of Manufacturing Index (PMI) rose for the sixth consecutive month in December, accelerating to its highest levels in four years. The market has ramped up expectations for policy tightening later this year: the probability of a rate hike in September is estimated at approximately 57%, with such a move almost fully priced in by October. Meanwhile, the Reserve Bank of New Zealand’s (RBNZ) February meeting is still perceived as a non-event, with the rate expected to remain at 2.25%.
The Malaysian economy’s growth, according to preliminary estimates, accelerated to 5.7% year-on-year in Q4 2025, compared to 5.2% in the previous quarter, marking the fastest pace since Q2 2024. The key driver was a recovery in the industrial sector. On a quarterly basis, GDP increased by 3.0% following an upwardly revised 5.4% jump in Q3 – the highest since late 2021. For the full year 2025, the economy grew by 4.9%, slowing only slightly from 5.1% the previous year.
S&P 500 (US500) 6,944.49 +17.89 (+0.26%)
Dow Jones (US30) 49,442.26 +292.63 (+0.60%)
DAX (DE40) 25,352.39 +66.15 (+0.26%)
FTSE 100 (UK100) 10,238.94 +54.59 (+0.54%)
USD Index 99.38 +0.25% (+0.25%)
News feed for: 2026.01.16
- US Industrial Production (m/m) at 16:15 (GMT+2). – USD (MED)
By JustMarkets
This article reflects a personal opinion and should not be interpreted as an investment advice, and/or offer, and/or a persistent request for carrying out financial transactions, and/or a guarantee, and/or a forecast of future events.