The Federal Reserve raised interest rates by half a percentage point on Dec. 14, 2022, to a range of 4.25 to 4.5%, the seventh increase this year. So far in 2022, the Fed has lifted its benchmark short-term rate, which influences most other borrowing costs in the economy, by 4.25 percentage points from a low of near zero as recently as March.
But even as the U.S. central bank lifts rates – and plans to keep doing so in 2023 – homebuyers are beginning to notice a pleasant surprise: Mortgage rates have been falling.
After soaring for much of 2022, mortgage rates and other long-term rates are starting to come down.
The average rate on a 30-year mortgage has fallen 0.75 percentage points in the past month or so, after hitting a 20-year high of 7.08% in early November. Rates reached 6.33% on Dec. 8, the lowest level since September. This occurred over the same period as the Fed lifted its benchmark interest rate 2 percentage points.
Why are mortgage rates falling if the Fed is still hiking?
The short and rather boring technical answer is that bond markets anticipated this rate hike many months ago. And as market factors largely dictate the costs of borrowing, the increase was already absorbed into home loan rates.
Mortgage rates, while rising due to the Federal Reserve’s rapid hiking pace, are actually more closely linked to the interest rate on Treasury securities, specifically the yield on the 10-year Treasury bond. That security began to anticipate the Fed’s interest rate increases a year ago and rose from less than 1.5% in December 2021 to more than 3.25% by June.
And now, with signs that inflation has already peaked and amid growing concerns of a slowing economy, these longer-term rates are coming down in anticipation of fewer future Fed rate hikes than expected only a short time ago. In fact, mortgage and other long-term rates may keep falling over the coming months – assuming the Fed manages to get inflation under control so it is able to lower its benchmark rate again.
Why do mortgage rates follow the yield on the 10-year Treasury bond?
As a result, the average 30-year fixed rate mortgage interest rate is normally 1 to 2 percentage points higher than the yield on the 10-year Treasury bond.
However, when the economy has more uncertainty than usual, like earlier this year, this spread can get as large as 3 percentage points. This uncertainty can be the result of a potential economic downturn, the possibility of the Fed raising rates more than expected, inflation, Fed balance sheet changes or all of the above – as happened in 2022.
Why are mortgage rates higher than Treasury yields?
Since the United States Treasury is more likely to pay investors back than almost any individual homeowner, investors charge a higher interest rate due to the additional risk they are taking.
Since individuals default on mortgages more often than the U.S. government defaults on Treasury bonds, investors require a higher return to purchase the rights to receive the payments from those mortgages.
If mortgage rates fall, will the Fed have to raise rates even higher to control inflation?
Since the Fed is trying to slow economic activity to bring down inflation, this could cause housing prices to increase again, thus forcing the Fed to raise its target rate more than planned.
However, I believe the effective federal funds rate, which is the market rate directly influenced by the Fed’s target range, is already sufficiently restrictive to slow the housing market and restore more normal economic conditions in 2023. Moreover, the decline in mortgage rates is still quite small – they remain over double what they were a year ago – so the drop isn’t likely to have much of an impact alone.
What the Fed itself thinks about this challenge – and where it projects to take interest rates next year – is what I and many other economists and investors will be monitoring closely after it met for the last time of 2022. It should tell us what to expect in 2023 – so stay tuned.
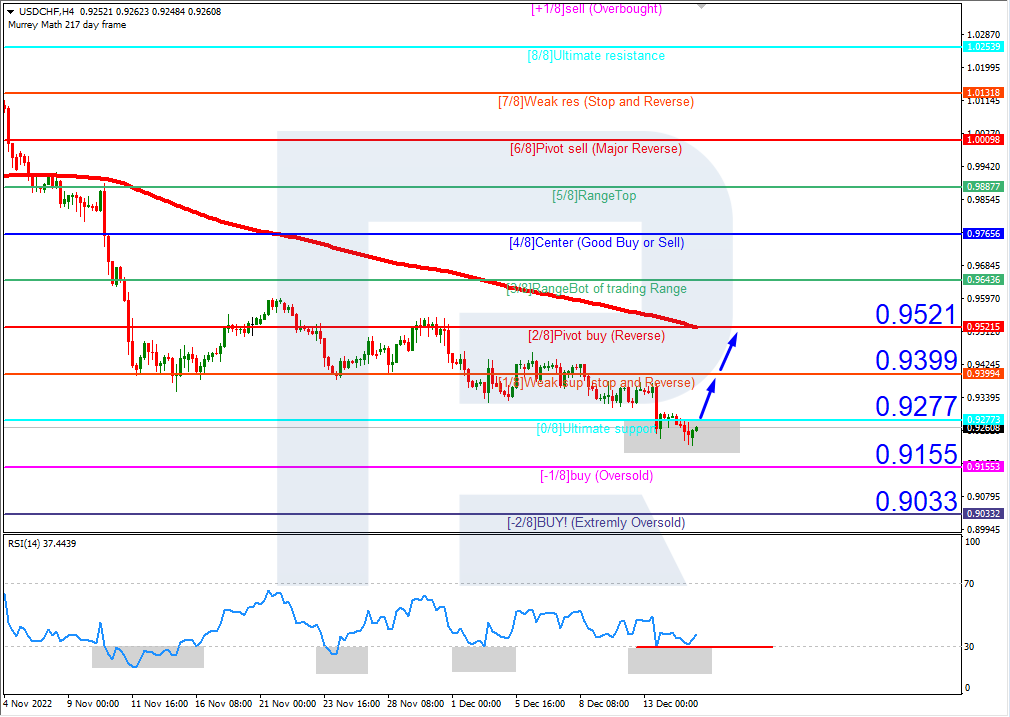
On H4, the quotes are in the oversold area. The RSI has bounced off the support line. An upwards breakaway of 0/8 (0.9277) is expected, followed by growth to the resistance level of 2/8 (0.9521). The scenario can be cancelled by a downward breakaway of the support level of -1/8 (0.9155). In this case, the quotes may go on falling and reach -2/8 (0.9033).
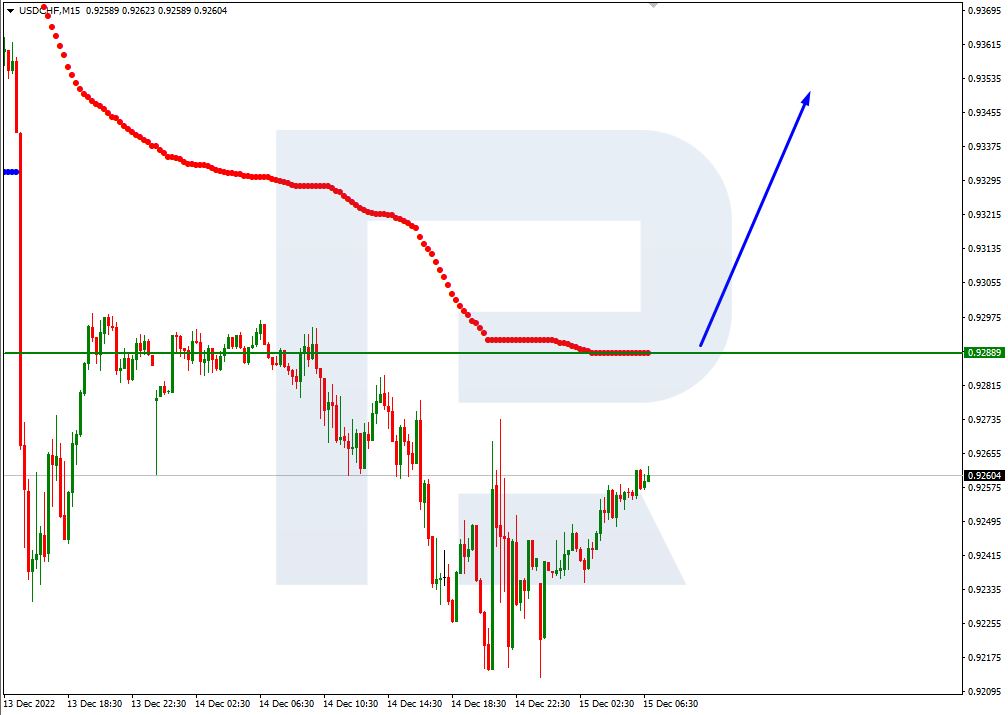
On M15, growth can be supported by a breakaway of the upper border of VoltyChannel.
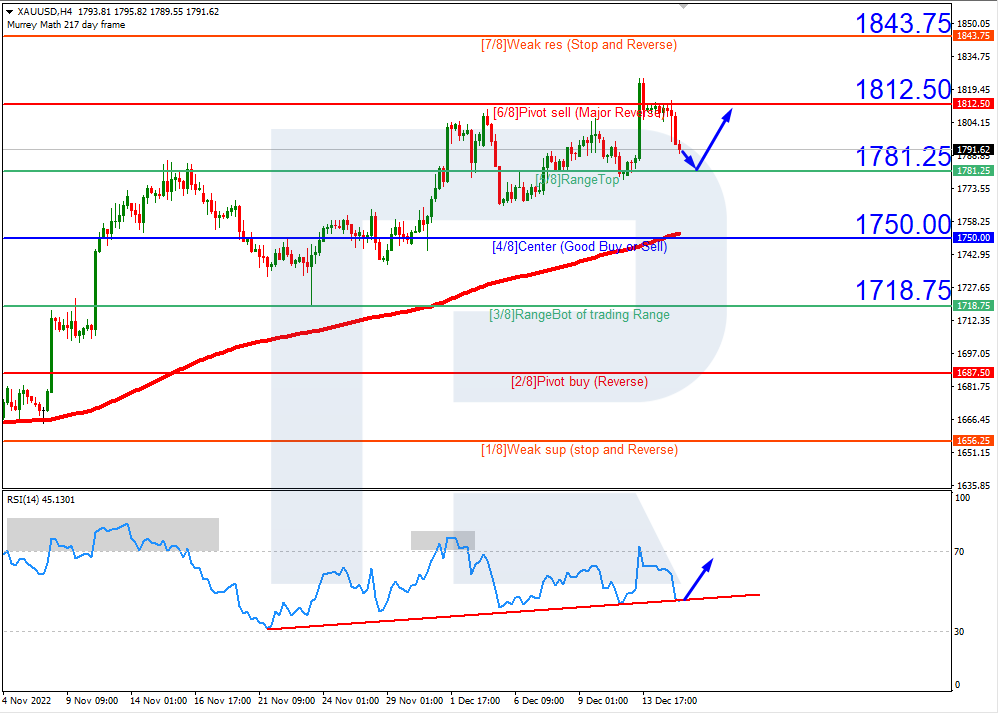
XAUUSD, “Gold vs US Dollar”
On H4, gold quotes are above the 200-day Moving Average, which indicates the prevalence of an uptrend. The RSI is testing the support line. In the end, a test of 5/8 (1781.25) is expected, followed by a bounce off it and growth to the resistance level of 6/8 (1812.50). The scenario can be cancelled by a downward breakaway of the support level of 5/8 (1781.25). In this case, gold quotes may drop to 4/8 (1750.00).
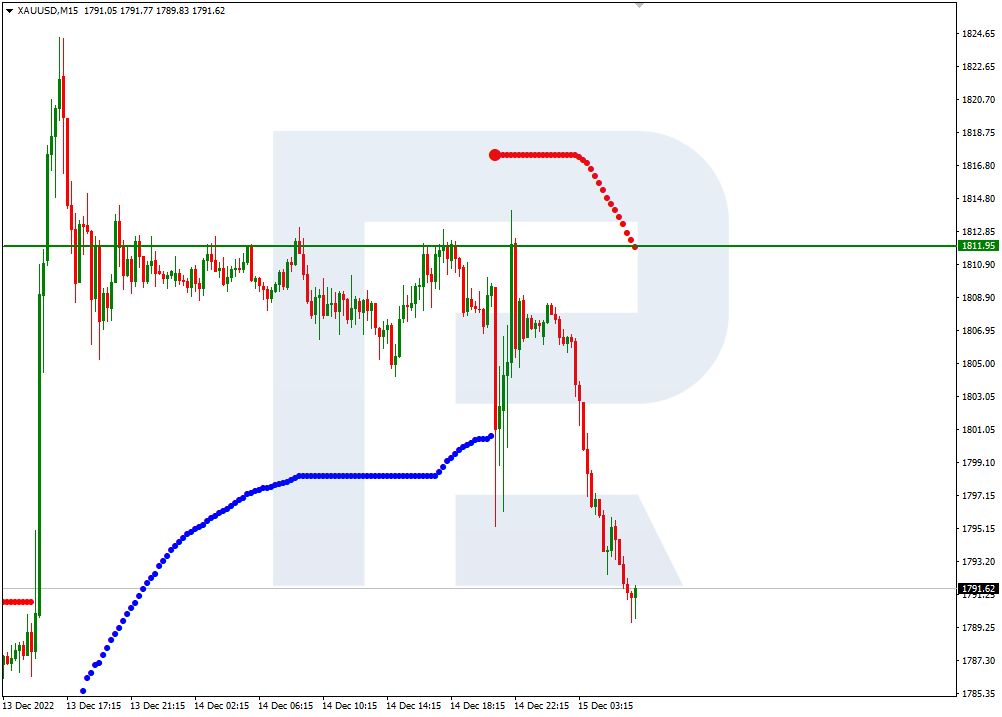
On M15, the upper line of VoltyChannel is too far away from the current price, hence, growth will be supported by a bounce off 5/8 (1781.25) on H4.
Attention! Forecasts presented in this section only reflect the author’s private opinion and should not be considered as guidance for trading. RoboForex LP bears no responsibility for trading results based on trading recommendations described in these analytical reviews.
EURUSD is testing the Tenkan-Sen line. The instrument is going above the Ichimoku Cloud, which suggests an uptrend. A test of the Kijun-Sen line at 1.0610 is expected, followed by growth to 1.0935. An additional signal confirming the growth will be a bounce off the lower border of the bullish channel. The scenario can be cancelled by a breakaway of the lower border of the Cloud and securing under 1.0395, which will mean further falling to 1.0305.
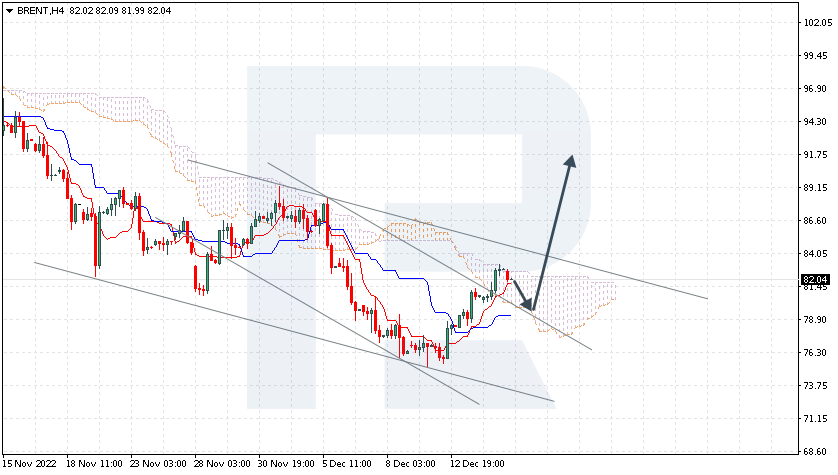
BRENT
Crude oil is pushing off the lower border of the Cloud. The instrument is going inside the Ichimoku Cloud, which suggests a flat. A test of the lower border of the Cloud at 80.05 is expected, followed by growth to 91.75. An additional signal confirming the growth will be a bounce off the upper border of the descending channel. The scenario can be cancelled by a breakaway of the lower border of the Cloud and securing under 75.00, which will mean further falling to 70.00. The growth will be confirmed by a breakaway of the upper border of the bearish channel and securing above 85.05.
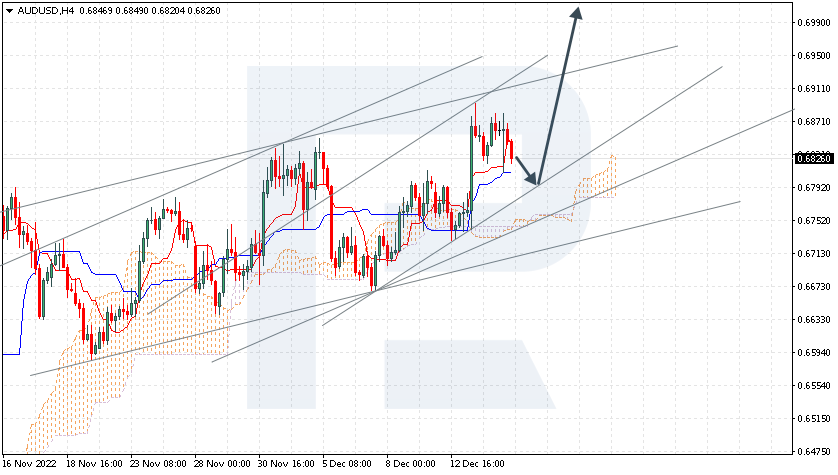
AUDUSD, “Australian Dollar vs US Dollar”
AUDUSD has secured above the resistance level. The instrument is going above the Ichimoku Cloud, which suggests an uptrend. A test of the Kijun-Sen line at 0.6795 is expected, followed by growth to 0.7005. An additional signal confirming the growth will be a bounce off the lower border of the bullish channel. The scenario can be cancelled by a breakaway of the lower border of the Cloud and securing under 0.6715, which will mean further falling to 0.6620.
Attention! Forecasts presented in this section only reflect the author’s private opinion and should not be considered as guidance for trading. RoboForex LP bears no responsibility for trading results based on trading recommendations described in these analytical reviews.
The US Federal Reserve raised its interest rate by 0.5% on Wednesday and raised its rate forecast to a peak of 5.1%. Thus, the Federal Reserve moved to a slower pace of rate hikes and also signaled that rates would reach higher levels than previously expected. At the Fed press conference, Mr. Powell indicated that it is too early to talk about interest rate cuts by the US central bank and that the Fed’s focus is on developing policies that will eventually return inflation to the 2% target.
Trading recommendations
Support levels: 1.0580, 1.0549, 1.0483, 1.0361, 1.0332, 1.0284, 1.0193
Resistance levels: 1.0695
The trend on the EUR/USD currency pair on the hourly time frame is bullish. The price is trading above the moving averages. The MACD indicator has become overbought, and there are signs of divergence, which, coupled with the resistance of the higher time frame, may trigger a correction. Under such market conditions, buy trades are better to consider from the support level of 1.0580 or 1.0549, but with additional confirmation. Sell deals can be considered from the resistance level of 1.0695, but it is better with a confirmation in the form of a reverse initiative or a false breakout.
Alternative scenario: if the price breaks down through the support level of 1.0446 and fixes below it, the downtrend will likely resume.
News feed for 2022.12.15:
– Eurozone ECB Interest Rate Decision at 15:15 (GMT+2);
– Eurozone ECB Monetary Policy Statement at 15:15 (GMT+2);
– US Retail Sales (m/m) at 15:30 (GMT+2);
– US Initial Jobless Claims (w/w) at 15:30 (GMT+2);
– US Philadelphia Fed Manufacturing Index (m/m) at 15:30 (GMT+2);
– Eurozone ECB Press Conference at 15:45 (GMT+2);
– US Industrial Production (m/m) at 16:15 (GMT+2);
The GBP/USD currency pair
Technical indicators of the currency pair:
Prev Open: 1.2357
Prev Close: 1.2427
% chg. over the last day: +0.56 %
In the UK, the consumer inflation rate fell from 11.1% to 10.7% on an annualized basis. Core inflation (a more important indicator because it excludes food and energy prices) fell from 6.5% to 6.3% y/y. After Monday’s positive GDP data, UK Chancellor Jeremy Hunt warned that the economy might get worse before it gets better. However, yesterday’s employment data were mostly positive. The Bank of England (BoE) will meet today with the market consensus for a 50 basis point rate hike.
Trading recommendations
Support levels: 1.2320, 1.2177, 1.2024, 1.1964, 1.1684, 1.1476, 1.1418
Resistance levels: 1.2431, 1.2519
From the technical point of view, the trend on the GBP/USD currency pair on the hourly time frame is bullish. The price is trading above the moving averages. The MACD indicator is in the positive zone, and the buyers’ pressure remains, but there are signs of divergence. Under such market conditions, it is better to look for buy deals from the support level of 1.2320, but with confirmation on intraday time frames. Sell trades are best looked for from the resistance level of 1.2431, but also better with confirmation in the form of a reverse initiative or a false breakout since the level has already been
Alternative scenario: if the price breaks down from the 1.2100 support level and fixes below it, the downtrend will likely resume.
News feed for 2022.12.15:
– UK BoE Interest Rate Decision at 14:00 (GMT+2);
– UK BoE MPC Meeting Minutes at 14:00 (GMT+2).
The USD/JPY currency pair
Technical indicators of the currency pair:
Prev Open: 135.57
Prev Close: 135.45
% chg. over the last day: -0.09 %
The US dollar has lost about 10% of its value against the Japanese yen over the past two months. However, the decrease was mainly due to expectations of a slowdown in the pace of rate hikes by the US Federal Reserve. The difference in the interest rates between the Bank of Japan and the US Federal Reserve became even bigger after yesterday’s rate hike, so the JPY has no fundamental support from the Bank of Japan in the mid-term perspective.
From the technical point of view, the medium-term trend on the currency pair USD/JPY is bearish. The MACD indicator is in the negative zone, showing signs of divergence. Sell deals may be searched for from the resistance level of 135.90, provided that there is a reverse reaction. Buy trades are best considered on intraday time frames from the support level of 134.79, but only with confirmation since the level has already been tested.
Alternative scenario: If the price fixes above 139.00, the uptrend will likely resume.
There is no news feed for today.
The USD/CAD currency pair
Technical indicators of the currency pair:
Prev Open: 1.3545
Prev Close: 1.3545
% chg. over the last day: 0.00 %
Oil prices fell slightly yesterday due to a stronger dollar, and the possibility of further interest rate hikes by global central banks has also added to demand concerns. The Canadian dollar is a commodity currency, so rising oil prices are strengthening the Canadian currency, while falling oil leads to Canadian weakness.
Trading recommendations
Support levels: 1.3521, 1.3438, 1.3386, 1.3360, 1.3281, 1.3212
From the point of view of technical analysis, the trend on the USD/CAD currency pair has changed to bullish. The MACD indicator shows the divergence, which suggests that the technical correction is coming to an end. Buy trades should be considered from the support level of 1.3521, but with additional confirmation. For sell deals, it is better to consider the resistance level of 1.3601 or 1.3643 but with a confirmation in the form of a reverse initiative or after a false breakout.
Alternative scenario: if the price breaks down and consolidates below the support level of 1.3386, the downtrend will likely resume.
This article reflects a personal opinion and should not be interpreted as an investment advice, and/or offer, and/or a persistent request for carrying out financial transactions, and/or a guarantee, and/or a forecast of future events.
Stock indices closed lower Wednesday as the Federal Reserve shifted to a slower pace of rate hikes but also signaled that rates will reach higher levels than previously expected. The US Federal Reserve raised interest rates by 0.5% and raised its rate forecast to a peak of 5.1%, which will remain through 2023. As the stock market closed, the Dow Jones Index (US30) decreased by 0.42%, and the S&P 500 Index (US500) lost 0.61%. Technology Index NASDAQ (US100) was down by 0.76% on Wednesday. All three indices closed the day lower.
The main points of the speech of the US Federal Reserve Chairman Jerome Powell:
There is a commitment to return inflation to the 2% target to ensure price stability, which is key to economic stability.
Rate hikes will slow in 2023. The Fed’s rate guidance is projected to reach 5.00%-5.25%, but everything will depend on incoming economic data.
No rate cut is currently projected for 2023
The labor market and price stability (mainly in food, housing, and transportation) are the key factors for the decision to raise the rate.
Inflation data for October and November 2022 showed visible progress, but more certainty is needed that it is controlled, so the monetary policy remains constrained.
The reduction in assets in Treasury securities will continue.
The labor market is extremely strong. The expected unemployment rate as a result of restraining monetary policy could reach 4.5% versus 3.7% at the moment.
Equity markets in Europe were mostly down yesterday. German DAX (DE30) decreased by 0.26%, French CAC 40 (FR40) lost 0.21%, Spanish IBEX 35 (ES35) added 0.39%, and British FTSE 100 (UK100) closed on Wednesday down by 0.09%.
The ECB will hold its monetary policy meeting today. Analysts expect the ECB to raise the interest rate by 0.5%. The main focus of investors will be the speech of ECB head Christine Lagarde, as well as the ECB’s decision on quantitative tightening (QT).
Yesterday, the Bank of England released its Financial Stability Report, warning that 2023 will be a difficult year for British households due to a combination of falling real incomes, rising mortgage costs, and rising unemployment. After Monday’s positive GDP data, UK Chancellor Jeremy Hunt warned that the economy could worsen before getting better. While yesterday’s employment data was mostly positive, it did indicate a slowdown in hiring as businesses prepare for a tough start to 2023. Wage growth (year-over-year) peaked, adding to the challenge for the Bank of England as it tries to balance recession fears with rising costs of living. The Bank of England (BoE) will meet today with the market consensus for a 50 basis point increase.
Oil prices fell slightly yesterday due to a stronger dollar, and the possibility of further interest rate hikes by global central banks also added to concerns about demand for “black gold.” On the other hand, the restriction by the G7 countries and allies on Russian oil prices will be a restraining factor for the growth.
Asian markets were mostly on the rise yesterday. Japan Nikkei 225 (JP225) gained 0.72%, China FTSE China A50 (CHA50) jumped by 0.93%, Hong Kong Hang Seng (HK50) increased by 0.39% on the day, India NIFTY 50 (IND50) added 0.28%, and Australia S&P/ASX 200 (AU200) gained 0.68% on the day.
Chinese economic data for November was much lower than expected. The world’s second-largest economy lost even more momentum as factory output slowed, and retail sales continued to decline amid a rise in COVID-19 cases.
Japan’s exports rose by 20% in November from a year earlier, but imports outpaced shipments, leading to a 16th consecutive month of trade deficits, Ministry of Finance (MOF) data showed Thursday. As a result, the trade balance came in at a deficit of 2.03 trillion yen ($15.00 billion), compared with an average estimate of a deficit of 1.68 trillion yen.
S&P 500 (F) (US500) 3,995.32 −24.33 (−0.61%)
Dow Jones (US30) 33,966.35 −142.29 (−0.42%)
DAX (DE40) 14,460.20 −37.69 (−0.26%)
FTSE 100 (UK100) 7,495.93 −6.96 (−0.093%)
USD Index 103.63 −0.35 (−0.34%)
Important events for today:
– Australia Unemployment Rate (m/m) at 02:30 (GMT+2);
– China Industrial Production (m/m) at 04:00 (GMT+2);
– China Retail Sales (m/m) at 04:00 (GMT+2);
– China Unemployment Rate (m/m) at 04:00 (GMT+2);
– China NBS Press Conference at 04:00 (GMT+2);
– Switzerland SNB Interest Rate Decision at 10:30 (GMT+2);
– Switzerland SNB Monetary Policy Assessment at 10:30 (GMT+2);
– Switzerland SNB Press Conference at 11:00 (GMT+2);
– Norwegian Interest Rate Decision at 11:00 (GMT+2);
– UK BoE Interest Rate Decision at 14:00 (GMT+2);
– UK BoE MPC Meeting Minutes at 14:00 (GMT+2);
– Eurozone ECB Interest Rate Decision at 15:15 (GMT+2);
– Eurozone ECB Monetary Policy Statement at 15:15 (GMT+2);
– US Retail Sales (m/m) at 15:30 (GMT+2);
– US Initial Jobless Claims (w/w) at 15:30 (GMT+2);
– US Philadelphia Fed Manufacturing Index (m/m) at 15:30 (GMT+2);
– Eurozone ECB Press Conference at 15:45 (GMT+2);
– US Industrial Production (m/m) at 16:15 (GMT+2);
This article reflects a personal opinion and should not be interpreted as an investment advice, and/or offer, and/or a persistent request for carrying out financial transactions, and/or a guarantee, and/or a forecast of future events.
Asian shares flashed red on Thursday, tracking declines in Wall Street overnight after the Federal Reserve signalled interest rates will climb higher than anticipated.
This fresh development strained risk appetite as investors became concerned over tighter monetary policy triggering a recession. European futures are pointing to a negative open this morning amid the cautious mood and this could circle back to US indices later today. In the currency space, the USD loitered near a six-month low against major peers despite the hawkish Fed while gold slipped back under $1800.
Overnight, more disappointing economic data from the second-largest economy in the world fuelled recession fears. China’s latest retail sales declined by 5.9% year-on-year in November which was much faster than the 0.5% witnessed in October and below the 3.7% market forecast. On top of this, the country’s industrial production for November grew 2.2% compared to the 5% expansion in October. With Coronavirus outbreaks worsening in China last month, the stricter control measures weighed heavily on the economy.
Let’s talk about the Fed…
As widely expected, the Federal Reserve raised interest rates by 50 basis points overnight, marking the end of the jumbo 75 basis point hikes seen in at the previous four meetings.
However, there were some key takeaways and golden nuggets in the policy meeting which offered investors fresh insight into the central bank’s thinking for 2023. Fed Chair Jerome Powell stated that the central bank had “some ways to go” in its battle against inflation. Although there have been signs of inflation cooling, at 7.1% it’s still well above the Fed’s 2% target. With policymakers projecting rates would end next year at 5.1%, this was higher than futures markets had predicted and the previously indicated 4.6% at their last dot plot in September. It looks like the Fed has ended 2022 on a hawkish note, leaving the doors wide open to more rate hikes in the New Year in an effort to control inflation.
After breaking below the 104.00 level, the Dollar Index (DXY) could be preparing for a steeper decline. Prices are trading below the 50-, 100- and 200-day Simple Moving Averages while the MACD is below zero. An intraday breakdown below 103.50 may signal a selloff towards 102.40. If bulls can push prices back above 104.00, a move towards 105.50 – a level just below the 200-day SMA – could be on the cards.
BoE expected to raise rates again
Markets widely expect the Bank of England to slow the pace of interest rate hikes today as it juggles the risks of sky-high inflation with concerns over economic growth.
After the jumbo 75-basis point hike back in November, the BoE is expected to shift into a lower gear with a 50-basis point hike today. This will put the benchmark rate at 3.5% which will be the highest level since 2008. Indeed, signs of easing inflationary pressures have reduced the pressure for the BoE to move ahead with a super-sized rate hike. The latest UK CPI data for November confirmed that inflation eased to 10.7% in November 2022, from 11.1% in October, suggesting that inflation may have peaked. Nevertheless, consumer prices are still well above the BoE’s 2% target – forcing the bank to continue raising interest rates in 2023, albeit at a slower pace.
It may be wise to keep a close eye on the latest UK retail sales, PMI figures, and consumer confidence which could offer additional insight into the health of the economy. But given how the UK economy is likely in recession due to the cost-of-living crisis, the central bank is trapped between a rock and a hard place. Whatever the outcome of the BoE meeting, it will most likely set the tone for the GBPUSD for the rest of 2022.
ECB meeting preview
After two consecutive rate hikes of 75 basis points, the European Central Bank (ECB) is also expected to slow down, raising rates by 50 basis points today.
The central bank is likely to announce Quantitative Tightening next year, however, no specific dates are expected to be revealed. Signs of cooling inflation in Europe may offer some breathing room for the ECB to adopt a less aggressive approach toward rates in 2023. Investors will direct much of their attention towards the staff projections which are expected to show inflation expectations pushed upwards for the New Year and economic growth forecasts lowered. Should the ECB strike a hawkish tone and signal more rate hikes in 2023, this could inject euro bulls with renewed inspiration. Alternatively, a cautious-sounding central bank that expresses concerns over the growth outlook could result in a weaker euro.
Looking at the technical picture, EURUSD remains firmly bullish on the daily timeframe. The recent breakout and daily close above 1.0600 could signal further upside with 1.0760 acting as a point of interest.
Commodity spotlight – Gold
Gold extended losses this morning as investors digested Fed Chair Jerome Powell’s hawkish statement overnight. With the Fed still waging war against inflation and interest rates expected to climb higher than anticipated, the appetite for zero-yielding gold took a hit. Prices are approaching the 200-day Simple Moving Average around $1785. A strong breakdown below this level could signal a selloff towards $1766 and $1750, respectively.
RoboMarkets, a European financial broker and developer of the R StocksTrader platform, proudly announces that its efforts have been acknowledged at the Professional Trader Awards event. The R StocksTrader mobile app was voted “Best Mobile Trading Platform-2022” globally. The winners were selected by the professional traders’ community.
The award winners companies were announced at a reception on 8 December 2022 in London. RoboMarkets has proudly earned the “Best Mobile Trading Platform” accolade for three consecutive years. This award is granted to the company that offers a top-tier mobile product to the market of professional trading accounts.
R StocksTrader is a brand-new trading platform, a powerful software for trading stocks and other financial instruments, featuring many added functions. The terminal makes available more than 12,000 trading instruments, allows for creating automated strategies, and more:
Access to the global markets from one platform
Minimal deposit of 100 USD
Leverage up to 1:20
3,000 stocks and 8,000 CFDs to choose from
Denis Golomedov, Chief Marketing Officer at RoboMarkets, comments: “We are extremely excited to receive this award, and would like to thank everyone who voted for us. Since the very start, we have focused on providing cutting-edge services to our clients, and this award reflects the result of our efforts. Our R StocksTrader mobile app offers direct access to the global financial markets from your mobile gadget from anywhere in the world. The app contains over 12,000 trading instruments, handy watchlists, a built-in corporate events calendar, analytics, and more. We constantly update the app, implementing solutions that enhance the trading functions of the platform, and improve risk control. Our team is truly engaged in providing users with an unhindered, cutting-edge trading experience.”
The winners of the Professional Trader Awards were selected after a three-stage process. Firstly, in the four weeks from 5 through 30 September, applications were filed to the organising committee by the brokers themselves, nominating their companies for the chosen award. Next, the organisers polled professional traders, who voted for their preferred nominees. Lastly, the winners of the Professional Trader Awards 2022 were announced after the final calculation of the votes.
About RoboMarkets
RoboMarkets is an investment company, operating under CySEC licence No. 191/13. RoboMarkets offers investment services in European countries by providing access to its proprietary trading platforms to traders who work on financial markets. Find out more about the Company’s products and activities on www.robomarkets.com.
Clinical-stage Algernon Pharmaceuticals’ multiple pipelines include testing a psychedelic for the treatment of stroke, and testing other drugs for idiopathic pulmonary fibrosis and chronic kidney disease.
Clinical-stage drug development company Algernon Pharmaceuticals Inc. (AGN:CSE; AGNPF:OTCQB; AGN0:XFRA) has multiple drugs in its pipeline and has garnered the support of AlphaNorth Asset Management, which now holds approximately 13% of the firm’s shares.
Why has the firm taken such a large position? AlphaNorth President and CEO Steve Palmer explained in a recent episode of Streetwise Live!: “We like it primarily because of the valuation. It’s quite cheap. Currently, the value of the whole company is CA$6–7 million. We also like it because they have multiple programs; I like companies like have multiple shots on goal, so to speak. And the trials that they are conducting are also lower risk than the typical biotech because they are using drugs that are already known to be safe.”
Analyst Andre Uddin with Research Capital Corporation follows the company and notes that Algernon has an “in-depth pipeline based on its novel repurposing drug development strategy.” He has calculated a CA$10.25/share target price on the company, an implied fourfold return based on the current share price of CA$2.78.
Multiple Pipelines
Algernon is about to begin testing the psychedelic compound DMT (N, N-dimethyltryptamine) for ischemic stroke, the type of stroke caused by blood clots blocking the flow of blood in the brain. The current treatment, tPA, must be administered within about three hours of the start of symptoms to be effective, a threshold that a large proportion of stroke victims don’t meet.
“The trials that they are conducting are also lower risk than the typical biotech,” said Steve Palmer of AlphaNorth Asset Management
The company has commenced screening subjects for the Phase 1 clinical study that will be conducted at the Centre for Human Drug Research in The Netherlands and expects to dose the first subject soon. Up to 60 healthy volunteers are expected to participate.
Algernon notes that the purpose of the study is to identify the “safety, tolerability, and pharmacokinetics of DMT when administered as an intravenous bolus followed by a prolonged infusion, for durations which have never been studied clinically. In addition, several pharmacodynamic measures believed to be associated with neuroplasticity, including both measurements of biochemical markers and electroencephalographic readings, will be recorded.”
“The potential of a stroke treatment drug is enormous,” Christopher Moreau, CEO of Algernon, stated. “On the human side, for approximately 85% of ischemic stroke patients, there is no treatment except to watch and hope. And on the market side, it is estimated to become a US$15 billion market by 2027, and so it’s truly global in scale and would have a huge impact on patients who suffer from this terrible injury.”
The company noted that its decision to investigate DMT and move it into human trials for stroke is “based on multiple independent, positive preclinical studies demonstrating that DMT, at a sub-psychedelic dose, helps promote structural and functional neuroplasticity. These are key factors involved in the brain’s ability to form and reorganize synaptic connections, which are needed for healing following a brain injury.”
Research Capital Corp. analyst Andre Uddin noted, “We believe AGN’s best asset is ifenprodil.”
“The preclinical data shows that DMT promotes the production of brain-derived neurotrophic factor, which is an important part of the brain’s recovery process after an injury like a stroke,” Moreau stated.
Because other Phase 1 studies have been completed on DMT, the company is not expecting any serious adverse events.
Algernon is also looking into DMT for additional indications. In late October, the company announced that it has entered into a clinical trial agreement with Yale University School of Medicine, New Haven, Conn., for the use of DMT in a Phase 2 depression study. “Although the treatment of psychiatric disorders with DMT [is] not the company’s current focus, we have patents pending on novel forms of DMT which could potentially be used across a broad range of diseases,” stated Moreau. “In addition, we believe the data generated from this study may help inform Algernon’s stroke research program.”
Orphan Drug Status for Ifenprodil for IPF
Algernon has received from the U.S. Food and Drug Administration Orphan Drug designation for Ifenprodil for the treatment of idiopathic pulmonary fibrosis (IPF). Orphan drug status is conferred on diseases that affect fewer than 200,000 patients in the U.S. and provides tax credits for trials and an exemption from user fees. If the drug receives FDA approval, seven years of market exclusivity are granted.
“We appreciate the U.S. FDA’s decision to grant ODD status to Ifenprodil for IPF, a disease for which prognosis remains dismal, with 50% mortality expected within three to four years,” said Moreau. “This regulatory milestone comes at an important time in the development of Ifenprodil as a potential new therapy for IPF as we plan the next steps for our clinical program.”
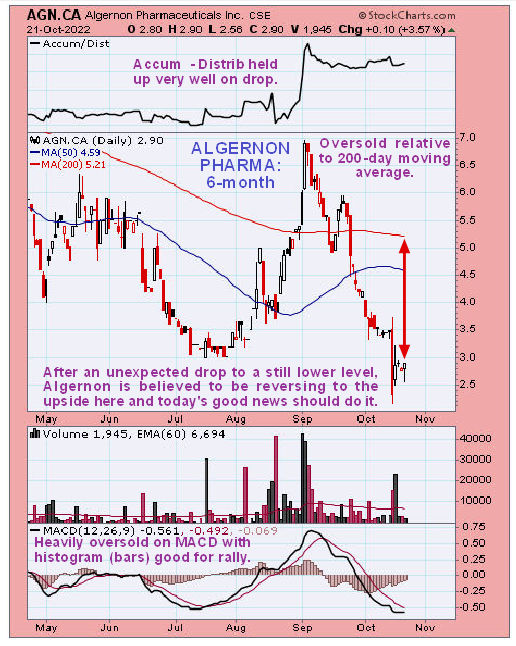
Technical analyst Clive Maund of CliveMaund.com recently charted Algernon’s stock and rated the stock a Buy.
Algernon’s Phase 2a study of Ifenprodil in patients recently concluded and met its co-primary endpoint “with patients receiving Ifenprodil experiencing no worsening of their lung function, and significant improvements were seen in the frequency of their IPF-associated cough as well. In addition, improvements in patient-reported measures of cough severity and quality of life were observed. Ifenprodil was also confirmed to be safe and well-tolerated in the study.”
Research Capital Corp. analyst Andre Uddin noted, “We believe AGN’s best asset is ifenprodil for treating refractory chronic cough (RCC) in idiopathic fibrosis (IPF)/IPF patients. . . Based on the positive Phase 2a data, we expect management to advance its 3x per day formulation of ifenprodil and initiate a Phase 2b trial in chronic cough H2 CY2023. A data set from a Phase 2b chronic cough trial would potentially be a large value-creating inflection point.”
Catalyst: Company Will Begin Testing For Chronic Kidney Disease Drug
The company plans to begin testing repirinast, a drug sold for 25 years in Japan for asthma, for chronic kidney disease. Analyst Uddin noted that Algernon “expects to begin conducting a Phase 1 study using repirinast to treat CKD in calendar year Q2 2023.”
Analysts and Expert Coverage
Technical analyst Clive Maund of CliveMaund.com recently charted Algernon’s stock and rated the stock a Buy. He wrote in October that “those interested should aim to buy it as soon as possible.”
Chris Temple of The National Investor also commented on the stock in a September post, saying that he considered the company an Immediate Buy.
The stock is also covered by analyst Dr. André Uddin of Research Capital Corp. and newsletter writers Gerard Adams of The National Inflation Association, Bob Moriarty of 321gold.com, and Penny Queen of Pennyqueen.com.
Click “See More Live Data” in the data box above to read more of what they are saying.
Ownership and Share Structure
AlphaNorth Asset Management is Algernon’s largest shareholder owning 13.46% of Algernon’s shares.
Algernon has approximately 2.3 million shares outstanding and 3.6 million fully diluted. It trades on the Canadian Securities Exchange under the ticker AGN and under the ticker AGNPF on the U.S. OTCQB platform.
Disclosures: 1) Patrice Fusillo wrote this article for Streetwise Reports LLC and provides services to Streetwise Reports as an independent contractor. She or members of her household own securities of the following companies mentioned in the article: None. She or members of her household are paid by the following companies mentioned in this article: None.
2) The following companies mentioned in this article are billboard sponsors of Streetwise Reports: Algernon Pharmaceuticals Inc. Click here for important disclosures about sponsor fees. As of the date of this article, an affiliate of Streetwise Reports has a consulting relationship with Algernon Pharmaceuticals Inc. Please click here for more information.
3) Comments and opinions expressed are those of the specific experts and not of Streetwise Reports or its officers. The information provided above is for informational purposes only and is not a recommendation to buy or sell any security.
4) The article does not constitute investment advice. Each reader is encouraged to consult with his or her individual financial professional and any action a reader takes as a result of information presented here is his or her own responsibility. By opening this page, each reader accepts and agrees to Streetwise Reports’ terms of use and full legal disclaimer. This article is not a solicitation for investment. Streetwise Reports does not render general or specific investment advice and the information on Streetwise Reports should not be considered a recommendation to buy or sell any security. Streetwise Reports does not endorse or recommend the business, products, services or securities of any company mentioned on Streetwise Reports.
5) From time to time, Streetwise Reports LLC and its directors, officers, employees or members of their families, as well as persons interviewed for articles and interviews on the site, may have a long or short position in securities mentioned. Directors, officers, employees or members of their immediate families are prohibited from making purchases and/or sales of those securities in the open market or otherwise from the time of the decision to publish an article until three business days after the publication of the article. The foregoing prohibition does not apply to articles that in substance only restate previously published company releases. As of the date of this article, officers and/or employees of Streetwise Reports LLC (including members of their household) own securities of Algernon Pharmaceuticals Inc., a company mentioned in this article.
6) This article does not constitute medical advice. Officers, employees and contributors to Streetwise Reports are not licensed medical professionals. Readers should always contact their healthcare professionals for medical advice.
Research Capital Corporation disclosures:
1. This Issuer has generated investment banking revenue for RCC.
Analyst Certification I, Andre Uddin, Ph.D., certify the views expressed in this report were formed by my review of relevant company data and industry investigation, and accurately reflect my opinion about the investment merits of the securities mentioned in the report. I also certify that my compensation is not related to specific recommendations or views expressed in this report. Research Capital Corporation publishes research and investment recommendations for the use of its clients. Information regarding our categories of recommendations, quarterly summaries of the percentage of our recommendations which fall into each category and our policies regarding the release of our research reports is available at www.researchcapital.com or may be requested by contacting the analyst. Each analyst of Research Capital Corporation whose name appears in this report hereby certifies that (i) the recommendations and opinions expressed in this research report accurately reflect the analyst’s personal views and (ii) no part of the research analyst’s compensation was or will be directly or indirectly related to the specific conclusions or recommendations expressed in this research report.
CliveMaund.com disclosures:
Clive Maund has not been paid by the company and does not own shares of Algernon.
With the need for counterdrone technologies rising, Australian and U.S.-based DroneShield Ltd. has released a lot of news. Read more to learn about the company’s myriad of orders, the DOD recommendation, and the recent million-dollar placement.
Australian and U.S.-based tech company DroneShield Ltd. (DRO:ASX; DRSHF:OTC) has been making many moves lately. Along with an influx of orders over the past two months, the company has also secured a recommendation from the Depart of Defense (DOD) and a AU$3.7 million placement.
DroneShield offers what is known as counterdrone systems, which can interfere with or disable remote-controlled ground surveillance drones during operation and while in flight.
Due to the practical application of drones in modern warfare, the counterdrone technology marketed by DroneShield has attracted the attention of major military electronic warfare organizations, such as the ISREW branch of the Australian Joint Systems Division, The United States Department of Defense, and the Department of Homeland Security.
Why Is Counterdrone Technology Taking Off?
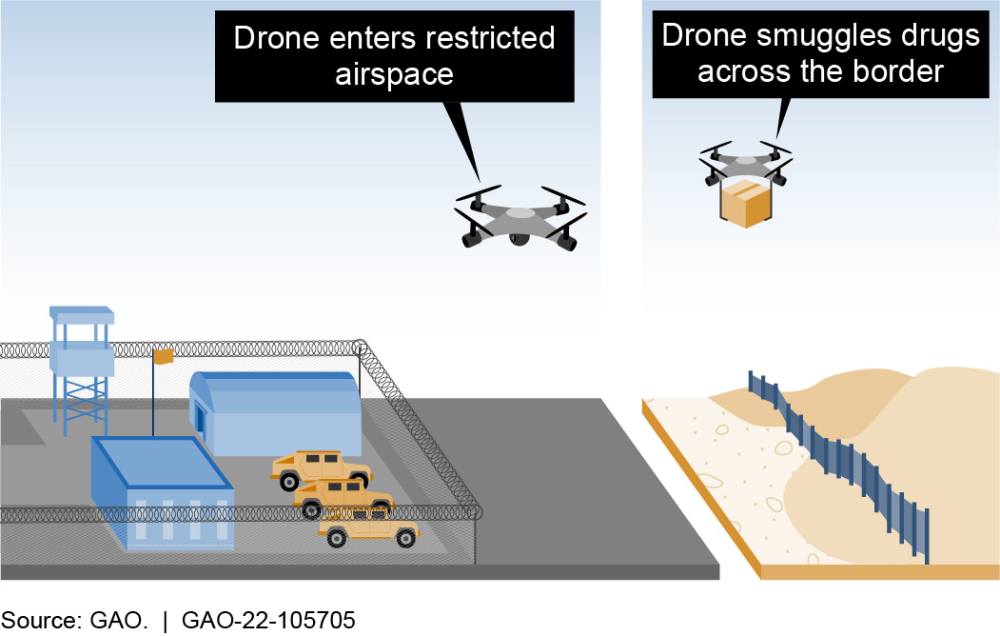
While drones can be extremely useful, they can also pose serious threats. They can be used for drug smuggling, interfere with planes if they are used in airspace near airports, or uncover secure data that should not be released. Because of this, it is imperative we have the technology to counter them by jamming their signal or taking them down completely, and this has become more important now than ever.
Figure 2. In this example, a critical site detects an unauthorized UAS nearby. An interference signal jams the connection between the UAS and its operator to reroute the UAS away from the site.
National Defense Business and Technology Magazine reported that Meni Deutsch, the regional director for Europe at Skylock Anti-Drone Technologies, said, “We have been witnessing the growing demand for anti-drone systems and technologies.”
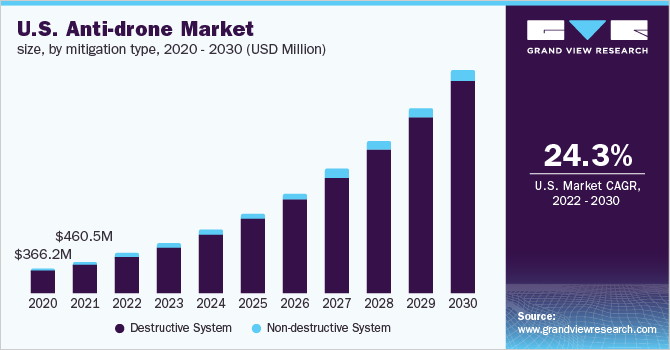
This demand has led to massive projected growth. The counterdrone market was already at “US$1.1 billion in 2021 and is anticipated to register a CAGR [compound annual growth rate] of 28.3% from 2022 to 2030,” which could provide ample opportunity to investors.
As for DroneShield, the company “differentiates itself from the rest of the market by offering an end-to-end counterdrone solution with largely in-house technology,” Daniel Laing of Bell Potter Securities wrote in a September report.
A Plethora of Orders
DroneShield has also identified critical markets for its counterdrone technology in correctional facilities, government offices, and airport security.
Laing of Bell Potter identified “the deployment of its technology at U.S. military bases following the U.S. DOD recommendation” as a “key catalyst for DroneShield’s projected growth.”
Airports have been on the watch for technology to counter drones. That need was amplified after several incidents, one being the 2018 Gatwick affair, where one of the U.K.’s most popular airports had to suspend all travel after multiple drones were sighted along its airfield.
Since then, “stakeholders at airports all over the world have called for a solution that can identify unauthorized drones — while complying with laws that generally prohibit interference with aircraft,” reported DroneLife.
This led to DroneShield’s August 2022 announcement of its first permanent deployment of DroneSentry at a U.S. airport. You can see a video demonstration of how the Sentry works here.
Then on October 25, 2022, the company received a AU$900,000 order contract for portable counterdrone systems for an undisclosed Asian country. This led to the company trading 2.56% higher on the announcement day.
Last month, DroneShield also announced it would receive AU$1 million from an unnamed international government agency. In this order, the company would provide several of its DroneSentry-X units. DroneSentry-X is vehicle compatible counterdrone device. You can read more details about it here and see a video demonstration of the product through this link.
Payment and shipment are expected before the end of the quarter. The company reported that “for this customer, it is an initial purchase that follows trials, and is expected to follow up with a number of additional systems, to be acquired in 2023.”
First Catalyst: U.S. DOD Recommendation
As the need for countdown technology intensifies, the department of defense has decided to spend at least US$668 million on counterdrone research and development and at least US$78 million on the acquisition by the 2023 fiscal year.
Technical Analyst Clive Maund rated the company an Immediate Buy and said, “with the outlook for orders and earnings improving dramatically, it is clear that there is everything to go for here.”
Along with this, the DroneShield happily unveiled it had been recommended by the U.S. DoD’s Joint Counter-small Unmanned Aircraft Systems Office (JCO) as part of the Science Applications International Corporation (SAIC) joint solution for Counter-UAS as a Service (CaaS).
CEO and managing director Oleg Vornik told Streetwise Reports that DroneShield is proud to have this recommendation and that they “look forward to installations next year as now [the] recommendation has been made to implement the rollout of counter drone systems across the U.S.”
Laing of Bell Potter identified “the deployment of its technology at U.S. military bases following the U.S. DOD recommendation” as a key catalyst for DroneShield’s projected growth.”
These inroads maintained with major government organizations have established the “validation of the sales pipeline through consistent contract wins,” which Laing claims to be an additional, concurrent catalyst for DroneShield’s sustained growth in other sectors.
Second Catalyst: Placement With Epirus
DroneShield also unveiled the organization of a placement of 18.5 million shares with technology investment firm Epirus Inc.
Epirus Inc., named after the unending arrows of the Greek hero Theseus, is a technology company that creates software-defined directed energy systems, which are used to counter electronics from various ranges.
Gavegan of Peloton Capital projects that the funding received from Epirus will contribute toward “the scaling up of engineering and operations in support of current momentum.”
Vornik spoke with Streetwise Reports about the deal, saying that DroneShield and Epirus have been working together for a while now. This is due to their complementary technologies, as DroneShield focuses on drone detection while Eprius focused on defeating drones through high-powered microwave weapons systems.
According to Peloton Capital, the market volume saturation resulting from this deal “represents a discount of 2.4% to the last closing price of AU$0.21 per share.”
At around AU$0.20 per share, Epirus’s placement has provided DroneShield an additional AU$3.7 million in operating capital. Peloton reports that this deal grants Epirus a 4.1% shareholder stake in the upstart Australian counterdrone company.
Shane Gavegan of Peloton Capital noted that DroneShield plans to direct this incoming investment capital toward “the scaling up of ready inventory and long lead items to rapidly fulfill anticipated orders.”
Analysts and Newsletter Commentary
DroneShield is covered by a surfeit of analysts, including Finola Burke of RaaS Advisory Pty Ltd., and previously mentioned Daniel Laing of Bell Potter Securities Ltd., and Shane Gavegan of Peloton Capital.
Laing suggested an estimated “AU$50 million worth of projects for 2022 and about AU$180 million worth for next year and further out” to be fulfilled by DroneShield — a matter of bolstering its supply to meet steady demand. The company, according to Laing, is well positioned to “capitalize on favorable macroeconomic conditions accelerating structural growth in the market.”
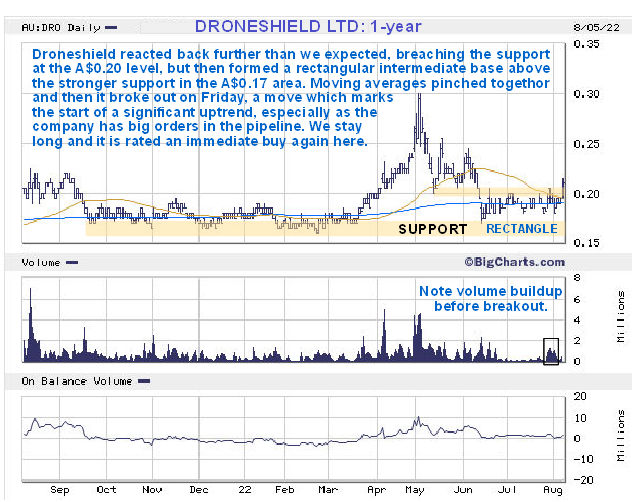
Charts courtesy of bigcharts.com
There is also evidence to suggest that this demand for DroneShield’s military technology will grow considerably in the coming quarters, where Gavegan projects that the funding received from Epirus will contribute toward “the scaling up of engineering and operations in support of current momentum.”
This momentum is echoed in the words of Peloton analyst Darren Odell, who noted that the counterdrone company is “currently selling its systems in the Five Eyes countries, the Middle East, and Ukraine.”
Technical analysts Clive Maund also commented on the stock in an August 9, 2022, post.
There Maund said, “the fundamentals of the company have continued to improve at an ever more rapid rate.”
He rated the company an Immediate Buy and said, “with the outlook for orders and earnings improving dramatically, it is clear that there is everything to go for here.”
Both Peloton and Bell Potter also maintain their Buy recommendations on DroneShield.
Click “See More Live Data” in the data box above to view more of what they are saying.
Ownership and Share Structure
Approximately 11% of DroneShield’s stock is owned by management, with CEO Oleg Vornik claiming 15.3 million shares at a majority stake of 3.39%. Other internal stakes are maintained by CFO Carla Balanco at 3.2 million shares, as well as board member Peter James with 9.3 million.
Without any institutional shareholders, the remaining 89% of DroneShield’s outstanding shares are retail.
By the end of the September quarter, the company had a cash balance of AU$7.5 million, along with the AU$3.7 million from Epirus. They ended the quarter slightly cash flow positive and expect to either break even or be cash flow positive this quarter.
A micro-cap, DroneShield currently boasts an approximate AU$90 million market cap on 432 million outstanding shares spread across more than 8,000 investors. Approximately 378 million shares are free-floating. In addition, as noted by analyst Daniel Laing of Bell Potter Securities, DroneShield operates without bank debt and has an estimated AU$7 million in cash available as capital expenditure.
It currently has 451.04 million shares outstanding and trades in the 52-week range between AU$0.188 and AU$0.20.
Disclosures: 1) Katherine DeGilio and Tom Griffin wrote this article for Streetwise Reports LLC and Tom Griffin provides services to Streetwise Reports as an independent contractor. They members of their household own securities of the following companies mentioned in the article: None. They or members of their household are paid by the following companies mentioned in this article: None.
2) The following companies mentioned in this article are billboard sponsors of Streetwise Reports: None. Click here for important disclosures about sponsor fees. As of the date of this article, an affiliate of Streetwise Reports has a consulting relationship with DroneShield Ltd. Please click here for more information.
3) Comments and opinions expressed are those of the specific experts and not of Streetwise Reports or its officers. The information provided above is for informational purposes only and is not a recommendation to buy or sell any security.
4) The article does not constitute investment advice. Each reader is encouraged to consult with his or her individual financial professional and any action a reader takes as a result of information presented here is his or her own responsibility. By opening this page, each reader accepts and agrees to Streetwise Reports’ terms of use and full legal disclaimer. This article is not a solicitation for investment. Streetwise Reports does not render general or specific investment advice and the information on Streetwise Reports should not be considered a recommendation to buy or sell any security. Streetwise Reports does not endorse or recommend the business, products, services or securities of any company mentioned on Streetwise Reports.
5) From time to time, Streetwise Reports LLC and its directors, officers, employees or members of their families, as well as persons interviewed for articles and interviews on the site, may have a long or short position in securities mentioned. Directors, officers, employees or members of their immediate families are prohibited from making purchases and/or sales of those securities in the open market or otherwise from the time of the decision to publish an article until three business days after the publication of the article. The foregoing prohibition does not apply to articles that in substance only restate previously published company releases. As of the date of this article, officers and/or employees of Streetwise Reports LLC (including members of their household) own securities of DroneShield Ltd., a company mentioned in this article.
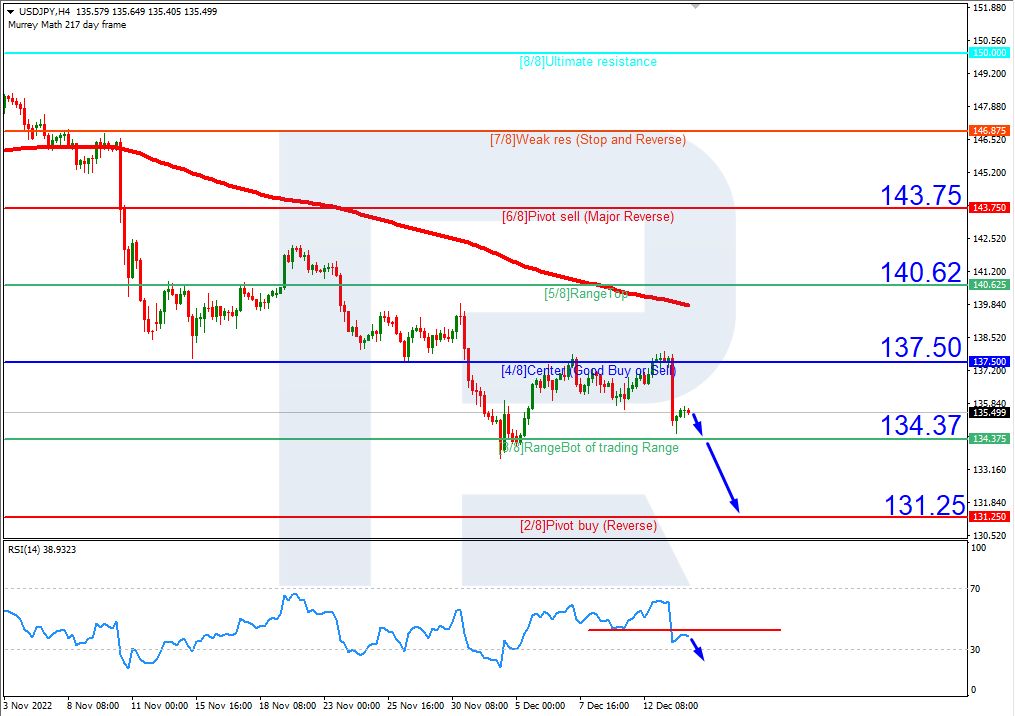
On H4, the quotes are under the 200-day Moving Average, which indicates the prevalence of a downtrend. The RSI has broken through the support line downwards. A test of 3/8 (134.37) is expected, followed by a breakaway and falling to the support level of 2/8 (131.25). The scenario can be cancelled by rising over the resistance level of 4/8 (137.50). In this case, the pair may rise to 5/8 (140.62).
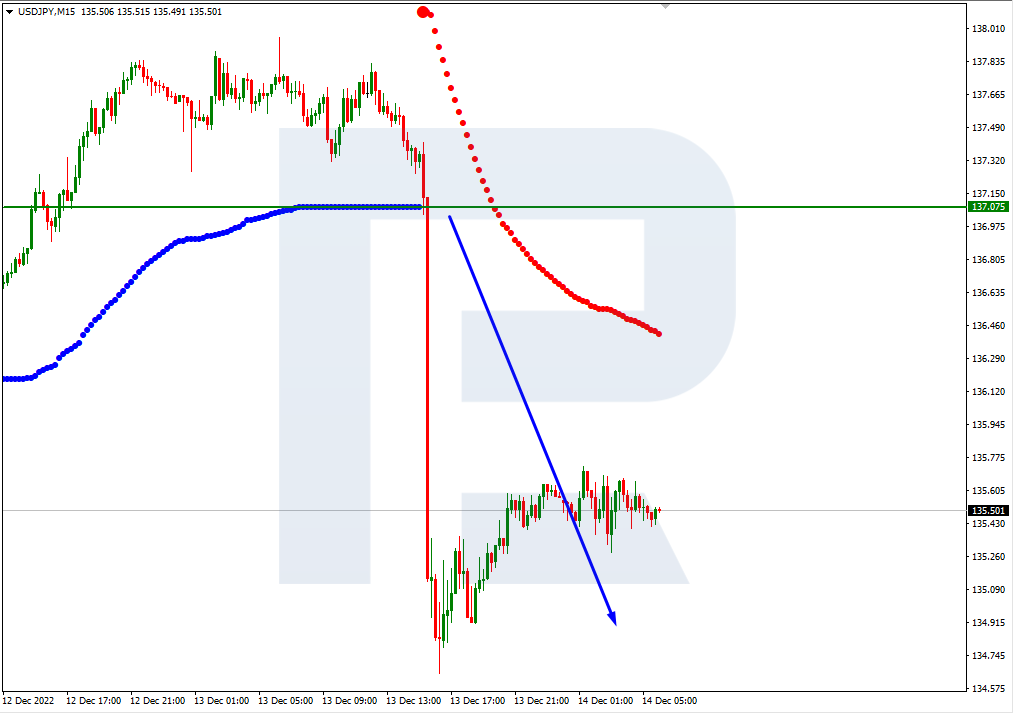
On M15, the lower line of VoltyChannel is broken away. This indicates prevalence of a downtrend and a high probability of further price falling.
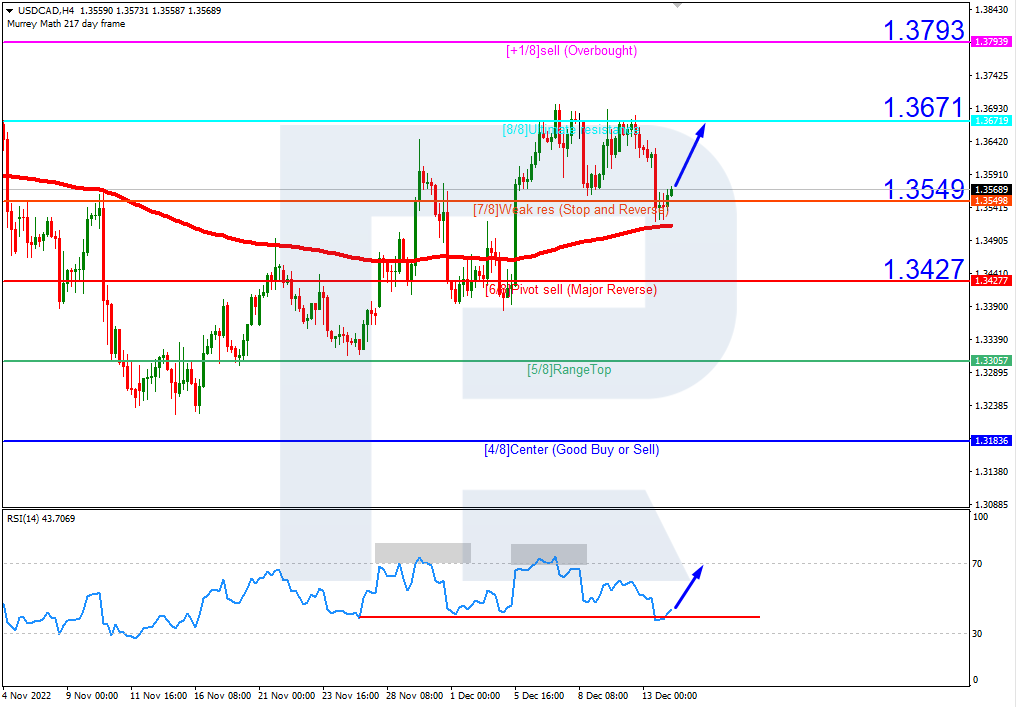
USDCAD, “US Dollar vs Canadian Dollar”
On H4, the quotes have bounced off the 200-day Moving Average and are now above it, which indicates prevalence of an uptrend and an end to the correctional movement. The RSI have bounced off the support level. All in all, growth to 8/8 (1.3671) is expected. The scenario can be cancelled by a downward breakaway of the support level of 7/8 (1.3549), which might lead to a trend reversal and falling to 6/8 (1.3427).
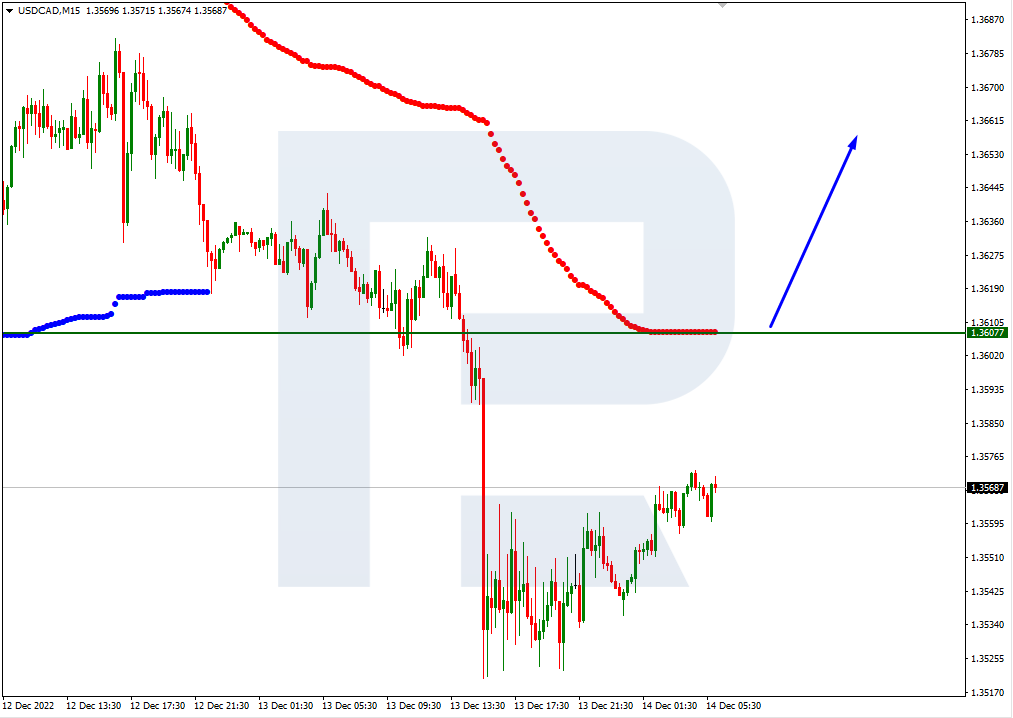
On M15, a breakaway of the upper border of VoltyChannel will signal further growth of the price.
Attention! Forecasts presented in this section only reflect the author’s private opinion and should not be considered as guidance for trading. RoboForex LP bears no responsibility for trading results based on trading recommendations described in these analytical reviews.