By JustMarkets
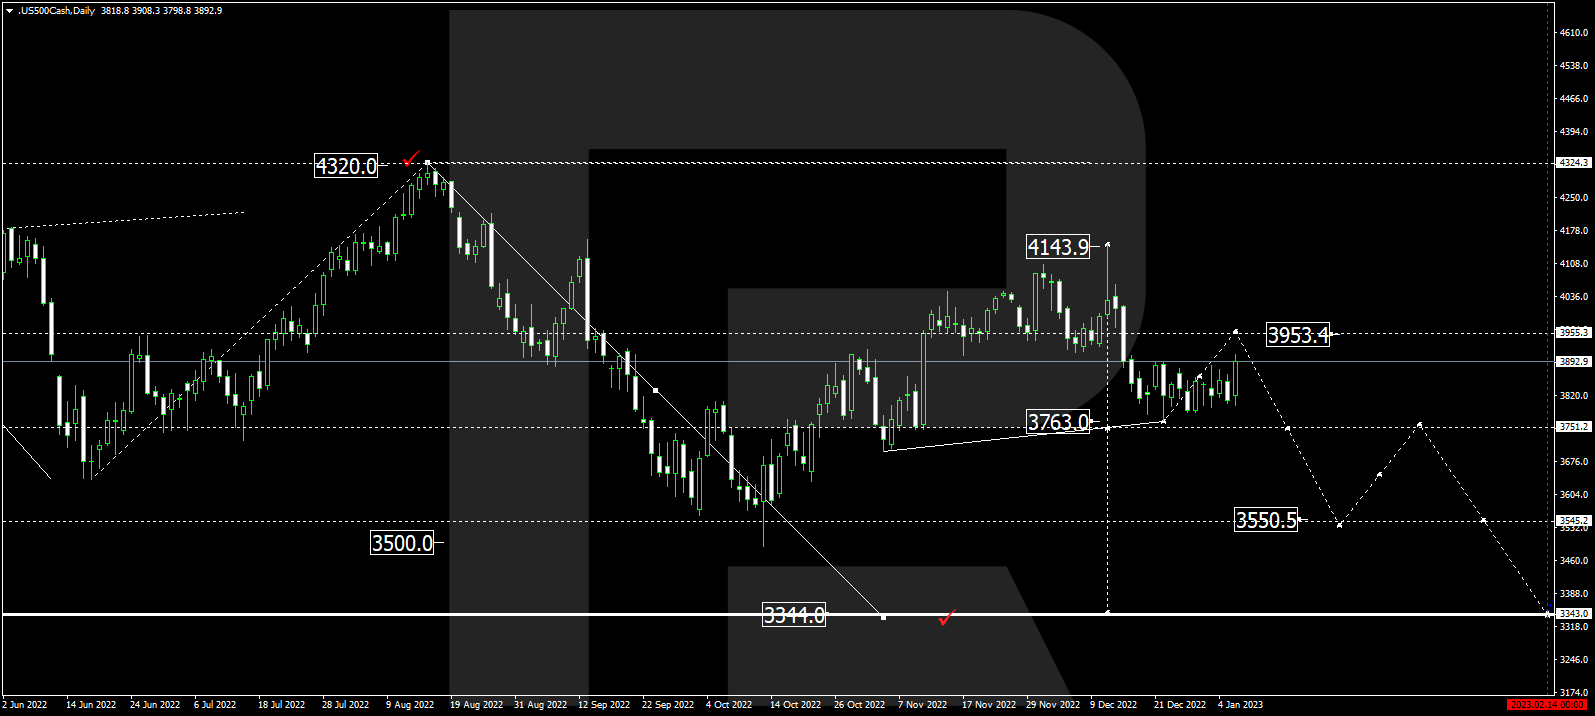
The US stock market ended Friday’s trading higher on the back of a dollar Index drop after key data on the US labor market. The non-farm report showed the US economy added 223,000 jobs, higher than the expected 200,000. The unemployment rate fell to 3.5% from 3.7%, while average hourly earnings fell to 4.6% from a revised decline of 4.8%. As the US labor market remains resilient, the Fed can count on further rate hikes to keep inflation in check. The dollar index unexpectedly fell on a strong US labor market report, and this could be a “false” move as a strong labor market, along with further rate hikes, is the foundation for a stronger dollar. At the close of the stock market on Friday, the Dow Jones index (US30) increased by 2.13% (+1.54% for the week), and the S&P 500 index (US500) added 2.28% (+1.72% for the week). The NASDAQ Technology Index (US100) gained 2.56% on Friday (+1.94% for the week). All three indices closed in positive territory last week.
Last week’s FOMC report showed that Fed policymakers increased the final interest rate range, and the non-farm payrolls report showed that the labor market remains resilient. Together, these 2 factors point to further interest rate hikes in the first half of 2023. A key factor will be the inflation data on January 12.
On Sunday in California, hundreds of thousands of homes and businesses were without power due to a severe storm. On Saturday, the NWS Weather Alert warned that the cumulative effect of successive heavy rains since late December could cause rivers to reach record highs and cause flooding in much of central California.
Stock markets in Europe were mostly up Friday. German DAX (DE30) gained 1.20% (+4.41% for the week), French CAC 40 (FR40) added 1.47% (+5.21% for the week), Spanish IBEX 35 (ES35) jumped by 1.00% (+4.78% for the week), British FTSE 100 (UK100) was up 0.87% (+2.49% for the week).
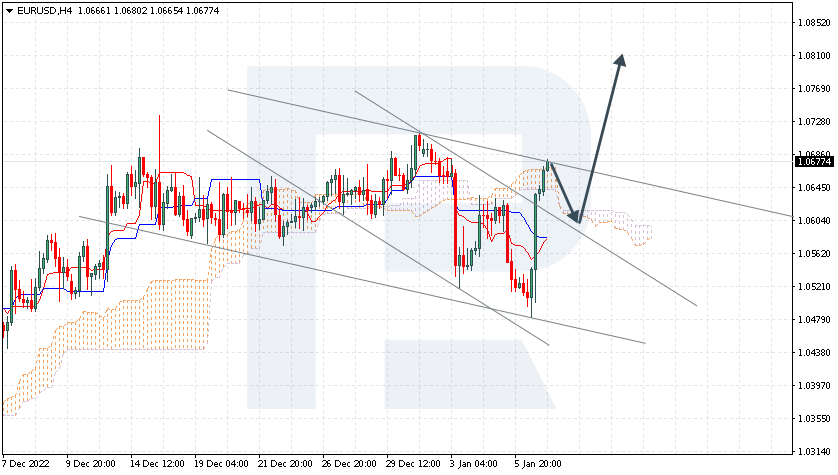
Falling energy prices in the Eurozone (especially natural gas prices) helped weaken the overall inflation rate. The overall inflation rate fell from 10.1% to 9.2% on an annualized basis. Core inflation (which excludes food and energy prices) also fell from 5.1% to 5.0% year over year. But the detailed report indicates that price pressures in non-energy sectors are rising, especially for food. This indicates that inflation is still strong. The next two months will be critical, as many businesses traditionally change prices early in the year.
Consequently, it is possible that core inflation will continue to rise. Consumption remains under pressure, and retail sales have been declining for quite some time, businesses continue to adjust their prices upward. The ECB has taken a very hawkish stance and is likely to keep the pace of rate hikes at 50 bp in February and March.
Asian markets traded mixed last week. Japan’s Nikkei 225 (JP225) decreased by 0.39%, China’s FTSE China A50 CHA50) was up 0.81%, Hong Kong’s Hang Seng (HK50) ended the week up 4.80%, India’s NIFTY 50 (IND50) decreased by 1.34%, and Australia’s S&P/ASX 200 (AU200) ended the week up 1.24% positive.
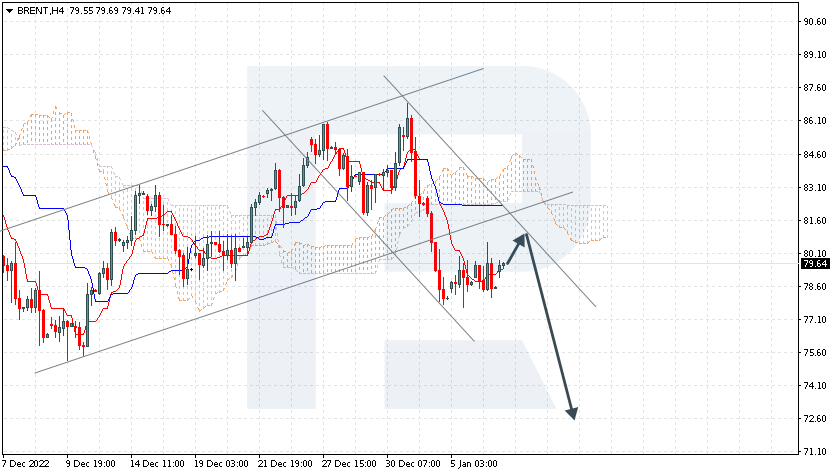
China on Saturday marked the first day of “Chun Yun,” the 40-day lunar New Year period. This Lunar New Year public holiday, which officially begins on January 21, will be the first since 2020 with no restrictions on domestic travel. Also, on Sunday, China will reopen its border with Hong Kong. China’s Ministry of Transportation expects more than 2 billion passengers to travel over the next 40 days. Investors hope the reopening will eventually revive the economy. Ultimately, it is likely to have an impact on oil prices. Demand for oil in China usually rises every year after the Lunar New Year. The increase in demand is a signal for rising oil prices.
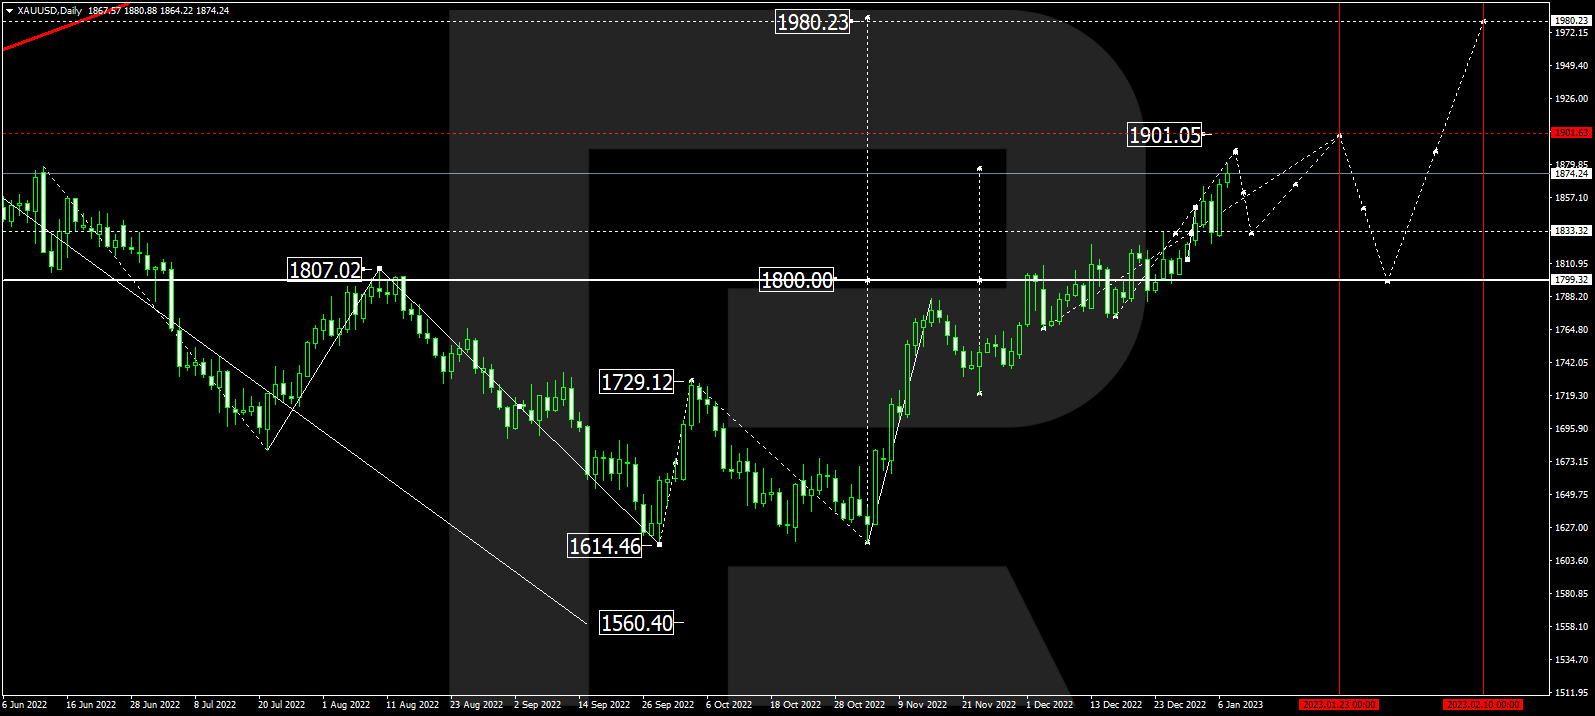
In the commodities market, futures on copper (+2.97%), cotton (+2.76%), gold (+2.43%), and platinum (+1.99%) showed the biggest gains last week. Futures on natural gas (-15.96%), gasoline (-9.05%), Brent oil (-8.51%), WTI oil (-8.14%), wheat (-6.19%), sugar (-5.34%), coffee (-5.29%), corn (-3.72%) and lumber (-2.95%) showed the biggest drop.
S&P 500 (F) (US500) 3,895.08 +66.02 (+1.72%)
Dow Jones (US30) 33,630.61 +509.00 (+1.54%)
DAX (DE40) 14,610.02 +173.71 (+1.20%)
FTSE 100 (UK100) 7,699.49 +66.04 (+0.87%)
USD Index 103.91 -1.13 (-1.08%)
Important events for today:
- – Switzerland Unemployment Rate (m/m) at 08:45 (GMT+2);
- – German Industrial Production (m/m) at 09:00 (GMT+2);
- – Eurozone Unemployment Rate (m/m) at 12:00 (GMT+2);
- – Canada Building Permits (m/m) at 15:30 (GMT+2).
By JustMarkets
This article reflects a personal opinion and should not be interpreted as an investment advice, and/or offer, and/or a persistent request for carrying out financial transactions, and/or a guarantee, and/or a forecast of future events.