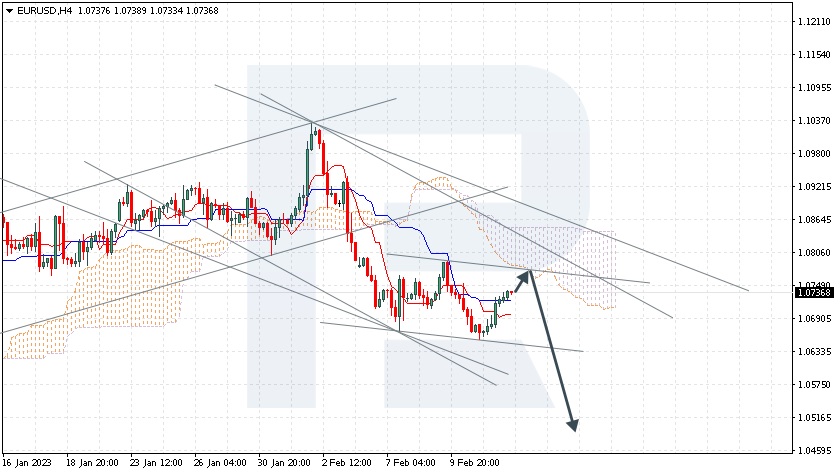
EURUSD has pushed off the support level. The instrument is going below the Ichimoku Cloud, which suggests a downtrend. A test of the lower border of the Cloud at 1.0755 is expected, followed by falling to 1.0505. An additional signal confirming the decline will be a bounce off the upper border of the descending channel. The scenario can be cancelled by a breakaway of the upper border of the Cloud and securing above 1.0875, which will mean further growth to 1.0965.
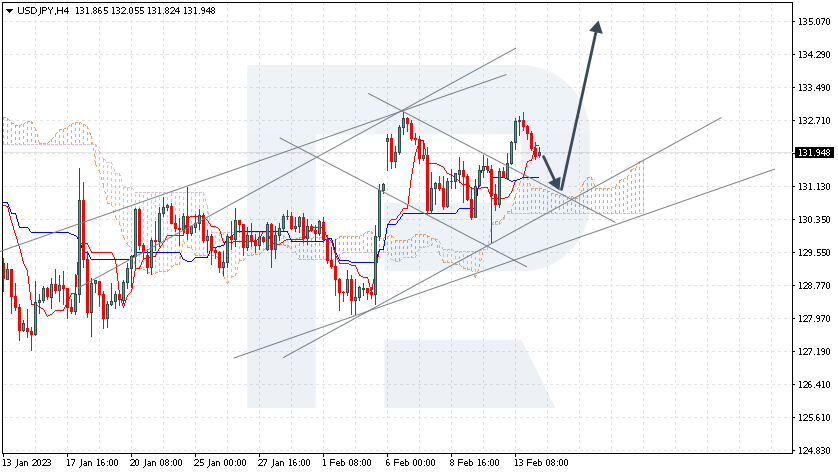
USDJPY, “US Dollar vs Japanese Yen”
USDJPY is testing the Tenkan-Sen line. The instrument is going above the Ichimoku Cloud, which suggests an uptrend. A test of the upper border of the Cloud at 131.15 is expected, followed by growth to 135.05. An additional signal confirming the decline will be a bounce off the lower border of the bullish channel. The scenario can be cancelled by a breakaway of the lower border of the Cloud and securing under 130.25, which will mean further falling to 129.35.
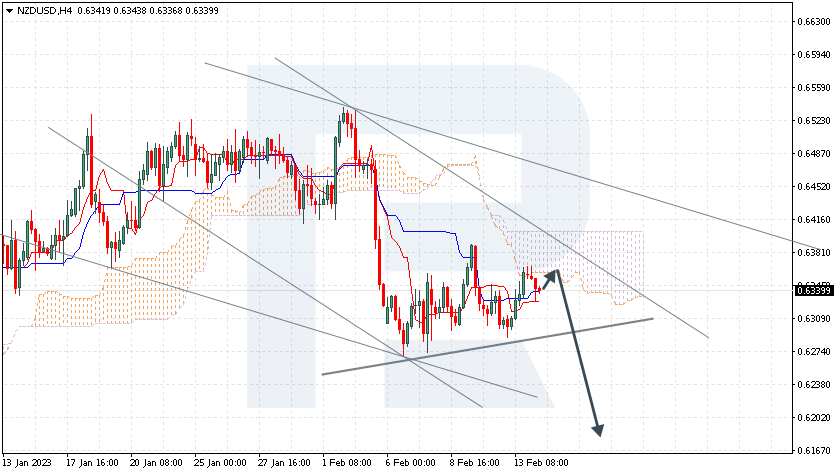
NZDUSD, “New Zealand Dollar vs US Dollar”
NZDUSD is correcting by the Head and Shoulders pattern. The instrument is going below the Ichimoku Cloud, which suggests a downtrend. A test of the lower border of the Cloud at 0.6365 is expected, followed by falling to 0.6175. An additional signal confirming the decline will be a bounce off the upper border of the descending channel. The scenario can be cancelled by a breakaway of the upper border of the Cloud and securing above 0.6420, which will mean further growth to 0.6515. The scenario can be confirmed by a breakaway of the lower border of the Head and Shoulders pattern and securing under 0.6265.
Attention! Forecasts presented in this section only reflect the author’s private opinion and should not be considered as guidance for trading. RoboForex LP bears no responsibility for trading results based on trading recommendations described in these analytical reviews.
Month-on-month inflation reports and the Federal Reserve’s responses won’t fixate investors, says the CEO of one of the world’s largest independent financial advisory, asset management and fintech organizations.
Nigel Green of deVere Group’s warning comes as a new report on U.S. inflation reveals the annual rate of price increases was 6.4% in January following a decline to 6.5% in December. More broadly, inflation has cooled from a 40-year high of 9.1% in June 2022.
He says: “It’s slightly higher than most analysts had expected, but it’s nothing too dramatic. All other reports were in line with expectations.
“It should also be noted that different calculation metrics were used this month.
“There has been a shift as markets are now betting on a longer period of higher interest rates as they begin to take heed of the message from U.S. Federal Reserve officials that there’s still a way to cool inflation in the face of a robust labour market.
“The tight labour market is a headache for the Fed, as it contributes to strong wage growth. However, Fed Chair Powell made clear last week that embedded inflation, caused by wage growth, is not yet a problem.”
The deVere CEO continues: “Despite the higher-than-expected inflation print, it’s clear to investors that we’re far closer to the ‘home run’ now.
“I think investors will, sensibly, be prepared to look through any near-term squalls on inflation and interest rate news.
“Instead, rightly, they will be focused more on earnings. Fourth-quarter 2022 earnings have fallen from a year ago, now a decline in the first quarter of 2023 would push the S&P 500 into an earnings recession.”
This, says Nigel Green, will be more front and center in investors’ minds.
“They are less fixated on the month-on-month inflation reports and the Federal Reserve’s response.
“Inflation seems to have peaked and investors are looking to the future, not in the rear-view mirror.”
As we move past peak-inflation, it’s critical that investors ensure their portfolios are suitably diversified across asset classes, sectors, currencies and regions, so as to make the most of the considerable opportunities that will inevitably present themselves.
“As the economic cycle moves ahead, and economies readjust, there will be big winners and big losers – it’s about being invested in the right companies, those which can consistently maintain or steadily grow margin, as well as diversification across sectors, asset classes and regions.
“A good fund manager will be critical in identifying these winners and losers as the economic cycle moves on,” affirms the deVere CEO.
He concludes: “As we’re seeing, some companies are struggling to maintain margin and are failing to report as had been expected.
“This is now a bigger deal for investors looking to build wealth than individual inflation reports.”
About:
deVere Group is one of the world’s largest independent advisors of specialist global financial solutions to international, local mass affluent, and high-net-worth clients. It has a network of more than 70 offices across the world, over 80,000 clients and $12bn under advisement
New inflation data will be released in the US today. The Consumer Price Index is expected to fall from 6.5% to 6.3% year-over-year, while basic inflation (excluding food and energy prices) will also decrease from 5.7% to 5.4%. If the actual data matches, or at least is no worse, the dollar index will probably start to lose ground, as falling inflation would indicate that the US Fed is on the right track and the high probability of a “soft” economic landing. But if inflation turns out to be hotter, especially the core index, it will give confidence to the dollar on the back of the fact that the US Fed will not stop and continue to raise interest rates.
The trend on the EUR/USD currency pair on the hourly time frame is bearish. The price is forming a wide corridor, and volatility in anticipation of CPI data is reducing. The MACD indicator has become positive, but buying pressure is weak. Under such market conditions, buy trades are best considered from the support level of 1.0651 or after the breakout of the 1.0739 resistance level, but with confirmation in the form of impulse movement. Sell deals can be considered from the resistance level of 1.0739, but better with confirmation in the form of a reverse initiative on the lower time frames.
Alternative scenario: if the price breaks down through the resistance level of 1.0926 and fixes above it, the uptrend will likely resume.
News feed for 2023.02.14:
– Eurozone GDP (q/q) at 12:00 (GMT+2);
– US Consumer Price Index (m/m) at 15:30 (GMT+2);
– US FOMC Member Williams Speaks at 21:05 (GMT+2).
The GBP/USD currency pair
Technical indicators of the currency pair:
Prev Open: 1.2062
Prev Close: 1.2139
% chg. over the last day: +0.64 %
Important labor market data will be released today in Great Britain. The unemployment rate is projected to be unchanged, with jobless claims up slightly. Such data is likely to cause a less aggressive reaction from the Bank of England (BoE) at the expense of easing inflationary pressure in the services sector. Traders need to understand that a strong labor market does not benefit the central bank in raising rates, as rising wages fuel inflationary indicators.
From the technical point of view, the trend on the GBP/USD currency pair on the hourly time frame is bearish. At the moment, the price is trading above the moving averages, and there is a slight buying pressure inside the day. The MACD indicator has turned positive. Under such market conditions, buy trades are better to look for on intraday time frames from the support level of 1.2078, but with confirmation in the form of initiative and short targets. Sell trades are best sought after a pullback from the resistance level of 1.2150 or 1.2203, but also better with confirmation in the form of a reverse initiative or a false breakout.
Alternative scenario: if the price breaks out through the 1.2416 resistance level and fixes above it, the uptrend will likely resume.
News feed for 2023.02.14:
– UK Average Earnings Index (m/m) at 09:00 (GMT+2);
– UK Claimant Count Change (m/m) at 09:00 (GMT+2);
– UK Unemployment Rate (m/m) at 09:00 (GMT+2).
The USD/JPY currency pair
Technical indicators of the currency pair:
Prev Open: 131.25
Prev Close: 132.40
% chg. over the last day: +0.87 %
The new Governor of the Bank of Japan (BoJ) will be announced today, and Kazuo Ueda is expected to be endorsed by the government. His attitude to monetary policy is somewhat unclear. During his tenure as representative of the Bank of Japan board from 1998 to 2005, Ueda played a key role in introducing new monetary policy easing tools to combat the domestic banking crisis and ease deflation. Analysts believe that Kazuo Ueda is likely to be in no rush to revise the ultra-soft policy and instead let economic data determine the future outcome, especially inflation and wage data.
Trading recommendations
Support levels: 131.45, 129.68, 129.98, 129.19, 129.04, 128.16
Resistance levels: 132.89, 133.23
From the technical point of view, the medium-term trend on the currency pair USD/JPY is bullish. The price is forming a wide-volatile corridor. At the same time, at the level of 132.89, a double top has been formed. The MACD indicator has become inactive. Under such market conditions, it is worth expecting the price to rise above 132.89 to test the liquidity above the level. Most likely, it will happen at the publication of today’s CPI. Buy trades are best to look for from the support level of 131.46, but only with confirmation on the lower time frames. Sell deals can be searched for from the resistance level of 132.89, but only after a false breakout.
Alternative scenario: If the price fixes below the support level of 128.16, the downtrend will be renewed with a high probability.
News feed for 2023.02.14:
– Japan GDP (q/q) at 01:50 (GMT+2);
– Japan Industrial Production (m/m) at 06:30 (GMT+2).
The USD/CAD currency pair
Technical indicators of the currency pair:
Prev Open: 1.3340
Prev Close: 1.3330
% chg. over the last day: -0.08 %
The Canadian dollar is a commodity currency, so it is highly dependent on instruments such as the dollar index and oil. Concerns about another hot US inflation figure have led to speculation that the Federal Reserve may have to be more hawkish than previously thought. Any rally in the US currency would put pressure on commodities, led by oil. The dollar index will get fundamental support if today’s US inflation data is worse than forecast and vice versa.
From the point of view of technical analysis, the trend on the USD/CAD currency pair is bullish. The price has corrected to the “discount” market area, where traders can look for good buying points. The MACD indicator is in the negative zone, and there are signs of divergence. Buy trades can be considered from the support of 1.3333, but with additional confirmation in the form of impulse initiative on the lower time frames. Sell deals should be considered from the resistance level of 1.3416 but on the condition of a reverse reaction.
Alternative scenario: if the price breaks down and consolidates below the support level of 1.3263, the downtrend will likely resume.
This article reflects a personal opinion and should not be interpreted as an investment advice, and/or offer, and/or a persistent request for carrying out financial transactions, and/or a guarantee, and/or a forecast of future events.
The Federal Reserve may have to keep raising interest rates to curb price increases, which could slow economic growth and affect the labor market, FOMC spokeswoman Michelle Bowman said yesterday. Bowman noted that continued labor market tightness is putting upward pressure on inflation, even if some components of inflation are declining because of improved supply factors. Officials in December projected that rates would peak at 5.1% this year, according to their average forecast. But they will update those estimates next month. Such comments did not affect investor sentiment to buy stocks. As the stock market closed yesterday, the Dow Jones Index (US30) increased by 1.11, and the S&P 500 Index (US500) added 1.14%. The NASDAQ Technology Index (US100) jumped by 1.48%.
Meta (META) jumped about 3% after the Financial Times reported that the company is preparing to announce a new round of job cuts.
Today, investors are focused on January inflation data (CPI) to revise their bets on the central bank’s monetary policy trajectory. The consumer price index is expected to fall from 6.5% to 6.3% year-over-year, with core inflation (which excludes food and energy prices) also falling from 5.7% to 5.4%. If the actual data is in line or at least not worse, the dollar index will probably start to lose ground, giving confidence to stock indices, and conversely, rising inflation will return panic sentiment to the market, causing indices to fall and investors to return to the dollar.
Equity markets in Europe were mostly up yesterday. German DAX (DE30) gained 0.58%, French CAC 40 (FR40) added 1.11%, Spanish IBEX 35 (ES35) jumped by 1.02%, British FTSE 100 (UK100) was up by 0.83% on Monday.
With inflation slowing faster than expected in Europe, the new quarterly forecast is likely to signal a slowdown in price growth, the head of Portugal’s central bank said Monday. He said the quarterly GDP data would be “very important” in determining the course of monetary policy, especially the peak in borrowing costs. While record Eurozone inflation is receding, the ECB is set to raise rates by another 50 basis points at next month’s meeting. Officials are worried about price pressure caused by rising salaries, which are not yet weakening.
Concerns about another hot US inflation figure have led to speculation that the Federal Reserve may have to be more hawkish than previously thought. Any rally in the US currency puts pressure on commodities, led by oil and gold. The dollar index will get fundamental support if today’s inflation data are worse than forecast.
Asian markets were mostly down yesterday. Japan’s Nikkei 225 (JP225) decreased by 0.88% yesterday, China’s FTSE China A50 (CHA50) gained 1.08%, Hong Kong’s Hang Seng (HK50) ended the day down by 0.12%, India’s NIFTY 50 (IND50) decreased by 0.48%, and Australia’s S&P/ASX 200 (AU200) lost 0.21%.
BlackRock downgraded Japanese stocks on expectations of a monetary policy reversal. According to analysts, inflation in the country is starting to take root, and the Bank of Japan continues to maintain its ultra-soft monetary policy, including limiting bond yields, which requires significant bond purchases. Therefore, a policy change could occur at any moment. Meanwhile, there is growing speculation about what a change in BOJ leadership in April would mean for policy. Kuroda’s last meeting as governor will be on March 10. BlackRock believes that regardless of who takes over, wage and inflation dynamics mean that the current policy stance is likely exhausted, and a change in monetary policy is inevitable.
Reserve Bank of Australia (RBA) Governor Philip Lowe will appear before Parliament on Wednesday and Friday for hearings on his anti-inflationary campaign, which has raised interest rates by 325 basis points in just 10 months. Disputes in the press have increased speculation that Lowe may not be appointed to a second term as governor because of the government’s independent investigation into central bank management and policy. Consumer price inflation in Australia is now at a 32-year high of 7.8% and is projected to return to the upper limit of the bank’s target range of 2-3% by mid-2025.
S&P 500 (F) (US500) 4,137.29 +46.83 (+1.14%)
Dow Jones (US30)34,245.93 +376.66 (+1.11%)
DAX (DE40) 15,397.34 +89.36 (+0.58%)
FTSE 100 (UK100) 7,947.60 +65.15 (+0.83%)
USD Index 103.28 -0.35 (-0.34%)
Important events for today:
– Australia Westpac Consumer Confidence Index (m/m) at 01:30 (GMT+2);
– Japan GDP (q/q) at 01:50 (GMT+2);
– New Zealand Inflation Expectations (m/m) at 04:00 (GMT+2);
– Japan Industrial Production (m/m) at 06:30 (GMT+2);
– UK Average Earnings Index (m/m) at 09:00 (GMT+2);
– UK Claimant Count Change (m/m) at 09:00 (GMT+2);
– UK Unemployment Rate (m/m) at 09:00 (GMT+2);
– Switzerland Producer Price Index (m/m) at 09:30 (GMT+2);
– Eurozone GDP (q/q) at 12:00 (GMT+2);
– US Consumer Price Index (m/m) at 15:30 (GMT+2);
– US FOMC Member Williams Speaks at 21:05 (GMT+2).
This article reflects a personal opinion and should not be interpreted as an investment advice, and/or offer, and/or a persistent request for carrying out financial transactions, and/or a guarantee, and/or a forecast of future events.
Companies have been buying back their own stock at record levels – something President Joe Biden doesn’t care for. In his state of the union address, Biden said “corporations ought to do the right thing” and invest more of their profits in producing more goods and less in stock buybacks. To encourage them to do so, he proposed quadrupling the new tax on buybacks to 4%.
But what are stock buybacks, and why do some people consider them to be a bad thing? We tapped D. Brian Blank, who studies company financial decision-making at Mississippi State University, to fill us in.
1. What are stock buybacks?
Before we can answer that question, first we need to understand the basics of how stock works.
Most stockholders, however, obtain stock by buying it on a secondary market, like the New York Stock Exchange. In this case, one person chooses to sell their ownership in the company, while another person buys it.
As partial owners, shareholders see the value of their stock rise when the company does well.
One way investors can benefit from holding the stock is that some corporations pay dividends, which are payments made directly to shareholders. Another way that stockholders can benefit is by selling the stock for more than they paid for it. Together, this creates a return on investment.
When companies have extra capital, they might go into the secondary market and buy back stock from investors. This is often referred to as a stock repurchase or buyback program. Companies that are older and less focused on rapid growth tend to do them more often.
Shareholders like buybacks because companies often pay a premium over market price. And when companies buy their own stock, this removes it from the market, which has the effect of lifting share prices as supply goes down, benefiting existing stockholders.
Critics like Biden contend that share buybacks represent short-term thinking that doesn’t actually create any real value. They argue instead that companies should use more of their profits to invest in more productive activities like business operations, innovation or employees.
But the decision whether to invest to increase domestic production is a complicated one. For example, the reason companies aren’t investing in new wells right now is not simply because they are buying back stock. The reason has more to do with how oil companies, and their shareholders, don’t think it is profitable to invest in more supply for a whole host of reasons, including the global push for greener energy by both policymakers and consumers, which is bound to reduce demand for fossil fuels in the future.
It’s also worth noting that while share repurchases are becoming increasingly common and controversial, they remain very similar to dividends, which don’t prompt the same concerns among politicians.
4. Would increasing the tax result in fewer buybacks?
The 1% tax on buybacks is actually brand new.
Congress passed the tax in 2022 as part of the Inflation Reduction Act. It took effect at the beginning of 2023 and only affects buyback programs of $1 million or more.
Usually when an activity is taxed, it happens less frequently. So, I expect the tax to nudge companies to spend less on buybacks and more elsewhere. While politicians intend more of the money to be used to invest in their productive capacity, companies may simply spend more on paying shareholders dividends.
Since the tax is new, it’s hard to evaluate its actual impact. Companies reportedly accelerated their repurchase programs in 2022 to avoid paying the tax.
But early data from 2023 suggest the 1% tax isn’t significantly deterring buybacks. Companies announced $132 billion in buybacks in January, three times as much as a year earlier and the most for the month on record.
Biden’s proposal to boost the tax to 4% may alter corporate behavior more. But again, it may just lead to greater dividend payments, not the other types of investments he and others hope for.
In addition, given that Republicans control the House, and Democrats have only a narrow majority in the Senate, this proposal has little chance of becoming law anytime soon.
The reasons why large corporations make the decisions they do about where to allocate capital – whether to build a factory, hire more workers or buy back stock – are complicated and, in my view, never taken lightly. These decisions have many facets and implications, and are not necessarily bad. I believe this is something worth remembering the next time you hear politicianssaying “corporations should do the right thing.”
But shiny ads are not all these companies do to protect their commercial interests in the face of a rapidly heating world. Most also provide financial support to industry groups that are spending hundreds of millions of dollars on political activities, often to thwart polices designed to slow climate change.
For example, The New York Times recently reported on the Propane Education and Research Council’s attempts to derail efforts to electrify homes and buildings in New York, in part by committing nearly US$900,000 to the New York Propane Gas Association, which flooded social media with misleading information about energy-efficient heat pumps.
The American Fuel and Petrochemical Manufacturers, which represents oil refiners and petrochemical firms, has spent millions on public relations campaigns, such as promoting a rollback of federal fuel efficiency standards.
These practices have been going on for decades, and evidence shows that industry groups have played key roles in blocking state and federal climate policies. This matters not just because of the enormous sums the groups are spending, but also because they often act as a command center for political campaigns to kill pro-climate policies.
We study the political activities of industry groups. In a recent research paper, we dug through U.S. tax filings to follow the money trail of trade associations engaged on climate change issues and track the billions they have spent to shape federal policy.
What we found
After NASA scientist James Hansen sounded the alarm on climate change in 1988, three trade associations – the National Association of Manufacturers, the Edison Electric Institute and the American Petroleum Institute – banded together with a couple of electrical utilities to form the Global Climate Coalition, or GCC.
The GCC systematically opposed any international regulation of climate-warming emissions, and successfully prevented the U.S. from ratifying the Kyoto Protocol, a 1997 international agreement to reduce greenhouse gas emissions.
This was the first example of trade associations working together to stall government action on climate change. Similar efforts continue today.
So, how much do trade associations spend on political activities, such as public relations? As not-for-profit organizations under the Internal Revenue Code, trade associations have to report their revenue and spending.
We found that trade associations historically opposed to climate policies spent $2 billion in the decade from 2008 to 2018 on political activities, such as advertising, lobbying and political contributions. Together, they outspent climate-supporting industry groups 27 to 1.
The oil and gas sector was the largest, spending $1.3 billion. Across the 89 trade associations we examined in nine different sectors of the U.S. economy between 2008 and 2018, no other group of trade associations came close.
No. 1 expense: Advertising and promotion
What came as more of a surprise as we were tallying up the data was how much trade associations are spending on advertising and promotion. This can include everything from mainstream media ads promoting the industry to hiring public relations firms to target particular issues before Congress.
For example, until they parted ways last year, Edelman, the world’s largest public relations firm, received close to $30 million from American Fuel and Petrochemical Manufacturers to promote fossil fuels, reporters at the online news site Heated found.
Our study found that trade associations engaged on climate change issues spent a total of $2.2 billion on advertising and promotion between 2008 and 2018, compared with $729 million on lobbying. As 2022 lobbying data shows, their spending continues. While not all of this spending is directly targeting climate policy, climate change is one of the top political issues for many industries in the energy sector.
Media buys are expensive, but these numbers also reflect the specific role trade associations play in protecting the reputation of the firms they represent.
Trade groups run promotional ads for their industries, as well as negative ads.
One reason that groups like the American Petroleum Institute have historically taken the lead running negative public relations campaigns is so that their members, such as BP and Shell, are not tarred with the same brush, as our interviews with industry insiders confirmed.
However, many firms are now coming under pressure to leave trade associations that oppose climate policies. In one example, the oil giant Total quit API in 2021, citing disagreements over climate positions.
Spending on social media in the weeks ahead of the U.S. midterm elections and during the U.N. Climate Conference in November 2022 offers another window into these groups’ operations.
A review by the advocacy group Climate Action Against Disinformation found that 87 fossil-fuel-linked groups spent roughly $3 million to $4 million on more than 3,700 ads through Facebook’s parent company alone in the 12 weeks before and during the conference.
Facebook received millions of dollars to run ads promoting natural gas.
The largest share came from a public relations group representing the American Petroleum Institute and focused heavily on advocating for natural gas and oil and discussing energy security. America’s Plastic Makers spent about $1.1 million on climate-related advertising during the two weeks of the U.N. conference.
Funneling money to think tanks and local groups
Trade associations also spent $394 million on grants to other organizations during the decade we reviewed. For example, they gave money to think tanks, universities, charitable foundations and political organizations like associations of mayors and governors.
While some of these grants may be philanthropic in nature, among the trade associations we spoke to, most have a political purpose in mind. Grants channeled to local community groups, as one example, can help boost an industry’s reputation among key constituent groups, and as a result their social license to operate.
What this means for climate policy
Fossil fuel companies, which reported record profits in 2022, still spend more on political activities than their trade associations do.
But industry groups historically opposed to climate policies are also big spenders, as our research shows. They outspent those that support actions to slow climate change, such as the solar and wind industries, by a whopping $2 billion to $74.5 million over the 10 years we reviewed.
This likely helps to explain why it took Congress almost 35 years after Hansen first warned representatives about the dangers of climate change to pass a major climate bill, the 2022 Inflation Reduction Act.
Since late November 2022, prices have been trapped within a very wide range with support at 1.1850 and resistance at 1.2450.
There has been a combination of fundamental and technical forces empowering both bulls and bears. However, until there is a noticeable shift in power or major technical breakout, prices are likely to remain rangebound in the short term. It is worth keeping in mind that the Pound has weakened against every single G10 currency since the start of February thanks to a dovish Bank of England.
Interestingly, the dollar straightened up – boosted by January’s robust jobs figures which revived market expectations around the Fed raising interest rates over a longer period.
The combination of dollar strength and pound weakness has resulted in the GBPUSD shedding roughly 2% month-to-date. Nevertheless, it is clear that a fresh directional catalyst may be required to shift the balance of power in favour of bulls or bears.
Will GBPUSD get some love this week?
Keep an eye on a couple of key risk events that could inject the GBPUSD with fresh volatility this week.
The UK inflation release will be under the spotlight on Wednesday 15th February. Markets are forecasting CPI to cool 10.3% in January 2023 versus 10.5% in December 2022. Given how inflation is expected to have already peaked in the United Kingdom, a report that meets or prints below expectations may boost sentiment and fuel speculation around the BoE pausing on rate hikes down the road. Ultimately, is seen dragging the GBPUSD lower. Alternatively, a hotter-than-expected CPI report may force the central bank to re-adopt a hawkish stance – boosting Sterling in the process.
It’s all about the retail sales report on Friday which is expected to dip in January compared to December. A disappointing figure is likely to strengthen the argument around the BoE pausing hikes down the road.
Outside of the UK, investors will be paying very close attention to the US inflation report on Tuesday. Inflation is expected to have cooled further to 6.2% in January compared to the 6.5% witnessed in December. A report that meets or prints below market projections is likely to not only pour cold water on the renewed Fed hike bets but also weaken the dollar. A weaker dollar could trigger a bounce on the GBPUSD.
Breakout on the horizon?
On the daily timeframe, the GBPUSD remains wedged between the 50-day and 200-day SMA. Prices are choppy and almost directionless with minor support found around 1.1950. As identified earlier, the currency pair remains within a very wide range with a fresh fundamental spark needed to trigger a major breakout/down. In the meantime, sustained weakness below 1.2177 could open the doors towards 1.1960 and 1.1850, respectively. According to Bloomberg’s probability calculator, there is a 29% chance from current levels that the GBPUSD ends Q1 below 1.1850. Should prices experience a rebound from the 1.1950/1.1850 regions, the next key level of interest can be found back at 1.2450. Interestingly, there is a 40% chance from current levels that the GBPUSD touches 1.2450 by the end of Q1.
On Monday, a Brent barrel is declining to 85.50 USD.
At the end of last week, crude oil prices grew by almost 2%. This was the market reaction to the decision of the Russian Federation to cut down on oil mining by 0.5 million barrel a day starting March 2023. Decreased production volumes might balance out the supply/demand ratio and will let suppliers wait for the recovery of the Chinese economy without extra emotions.
At the same time, the growth of the USD holds back too obvious growth of oil prices.
Drilling activity in the US has increased. According to Baker Hughes, over a week the number of oil drilling rigs grew by 10 facilities to 609 drilling rigs.
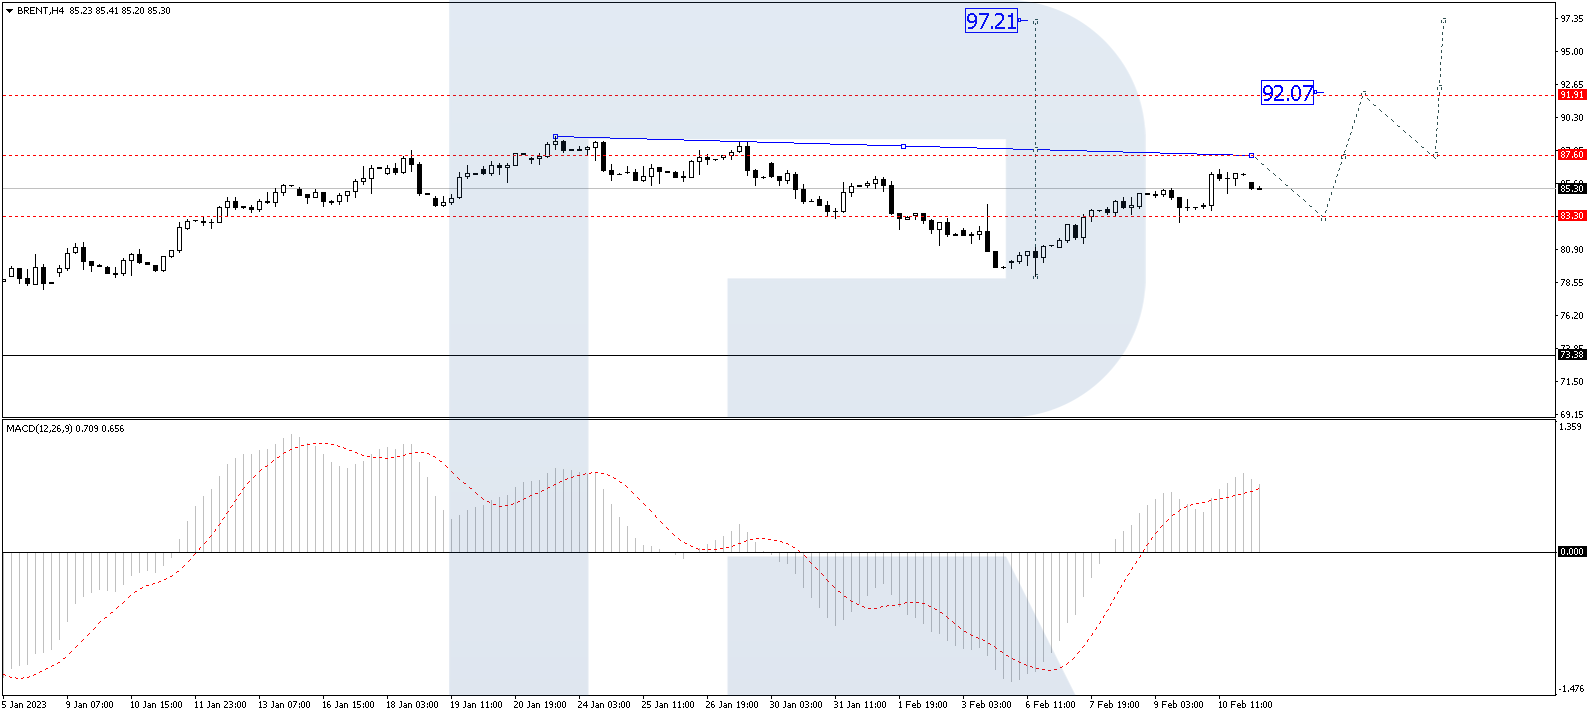
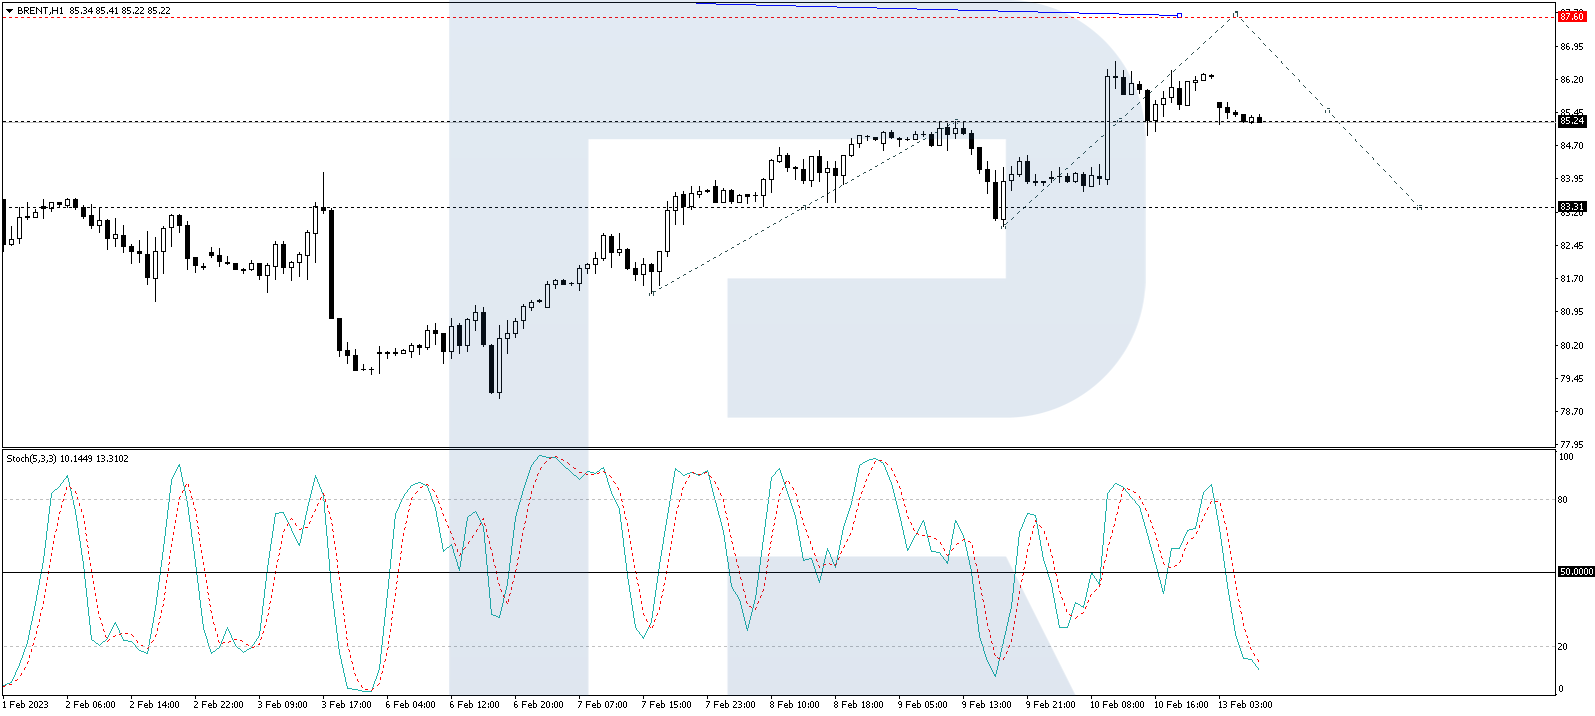
On H4, a wave of growth to 87.60 is continuing. After this level is reached, a correction to the low of 83.30 should become possible, followed by growth to 92.10. The goal is local. Technically, this scenario is confirmed by the MACD. Its signal line is headed strictly upwards to new highs.
On H1, Brent keeps developing the fifth structure of growth to 87.60. After this level is reached, a decline to 82.54 should follow (a test from above), and next – growth to 88.00. Technically, this scenario is confirmed by the Stochastic oscillator. Its signal line is under 20, getting ready to start growing. It should reach 50, break through it and even reach 80.
Disclaimer
Any forecasts contained herein are based on the author’s particular opinion. This analysis may not be treated as trading advice. RoboForex bears no responsibility for trading results based on trading recommendations and reviews contained herein.
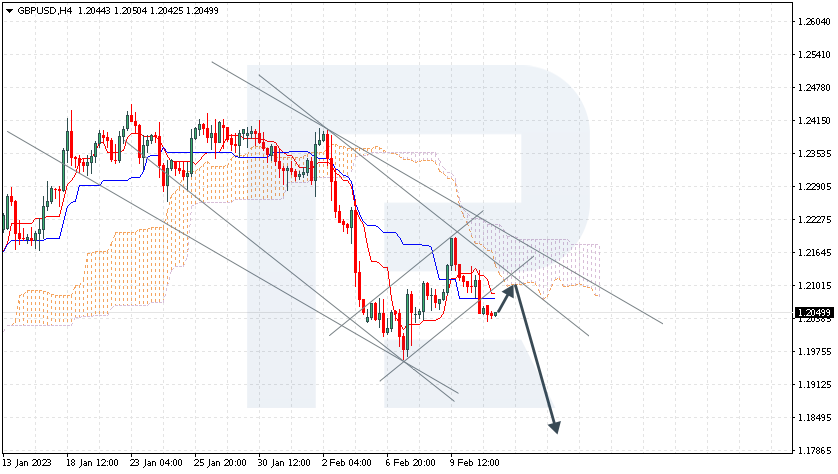
GBPUSD is going inside the bearish channel. The instrument is going below the Ichimoku Cloud, which suggests a downtrend. A test of the lower border of the Cloud at 1.2100 is expected, followed by falling to 1.1835. An additional signal confirming the decline will be a bounce off the upper border of the descending channel. The scenario can be cancelled by a breakaway of the upper border of the Cloud and securing above 1.2230, which will mean further growth to 1.2225.
BRENT
Crude oil is testing the Tenkan-Sen line. The instrument is going above the Ichimoku Cloud, which suggests an uptrend. A test of the Kijun-Sen line of the Cloud at 84.45 is expected, followed by growth to 90.55. An additional signal confirming the decline will be a bounce off the lower border of the bullish channel. The scenario can be cancelled by a breakaway of the lower border of the Cloud and securing under 80.55, which will mean further falling to 77.00.
AUDUSD, “Australian Dollar vs US Dollar”
AUDUSD is pushing off the signal lines of the indicator. The instrument is going below the Ichimoku Cloud, which suggests a downtrend. A test of the Kijun-Sen line at 0.6940 is expected, followed by falling to 0.6765. An additional signal confirming the decline will be a bounce off the upper border of the descending channel. The scenario can be cancelled by a breakaway of the upper border of the Cloud and securing above 0.7025, which will mean further growth to 0.7115.
Attention! Forecasts presented in this section only reflect the author’s private opinion and should not be considered as guidance for trading. RoboForex LP bears no responsibility for trading results based on trading recommendations described in these analytical reviews.
EURUSD keeps retreating. The current quote is 1.0670.
The currency pair dropped to the lows of five months. The reason is the market fear of the lengthy phase of monetary policy tightening by the US Federal Reserve System.
First, the US presented the labour market report for January, and it turned out strong. It made investors think that the Fed would go on using this means of increasing the interest rate further and thus fighting with inflation.
On Tuesday, a fresh CPI report will be presented. According to average forecasts, the indicator should have dropped to 6.2% from 6.5% y/y. However, month-wise, the indicator might have grown by 0.5% m/m after falling by 0.1% m/m in December. All this makes market players avoid risks. Base inflation might have also sped up to 0.4% from 0.3%.
In other words, the market is focused on tomorrow reports.
Attention! Forecasts presented in this section only reflect the author’s private opinion and should not be considered as guidance for trading. RoboForex LP bears no responsibility for trading results based on trading recommendations described in these analytical reviews.