$1 trillion in the shade – the annual profits multinational corporations shift to tax havens continues to climb and climb

By Ludvig Wier, University of Copenhagen and Gabriel Zucman, University of California, Berkeley 

CC BY-NC-ND

About a decade ago, the world’s biggest economies agreed to crack down on multinational corporations’ abusive use of tax havens. This resulted in a 15-point action plan that aimed to curb practices that shielded a large chunk of corporate profits from tax authorities.

But, according to our estimates, it hasn’t worked. Instead of reining in the use of tax havens – countries such as the Bahamas and Cayman Islands with very low or no effective tax rates – the problem has only gotten worse.

By our reckoning, corporations shifted nearly US$1 trillion in profits earned outside of their home countries to tax havens in 2019, up from $616 billion in 2015, the year before the global tax haven plan was implemented by the group of 20 leading economies, also known as the G-20.

In a new study, we measured the excessive profits reported in tax havens that cannot be explained by ordinary economic activity such as employees, factories and research in that country. Our findings – which you can explore in more detail along with the data and an interactive map in our public database – show a striking pattern of artificial shifting of paper profits to tax havens by corporations, which has been relentless since the 1980s.

Global crackdown

The current effort to curb the legal corporate practice of using tax havens to avoid paying taxes began in June 2012, when world leaders at the G-20 meeting in Los Cabos, Mexico, agreed on the need to do something.

The Organization for Economic Cooperation and Development, a group of 37 democracies with market-based economies, developed a plan that consisted of 15 tangible actions it believed would significantly limit abusive corporate tax practices. These included creating a single set of international tax rules and cracking down on harmful tax practices.

In 2015, the G-20 adopted the plan officially, and implementation began across the world the following year.

In addition, following leaks like the Panama Papers and Paradise Papers – which shed light on dodgy corporate tax practices – public outrage led governments in the U.S. and Europe to initiate their own efforts to lower the incentive to shift profits to tax havens.

Profit-shifting soars

Our research shows all these efforts appear to have had little impact.

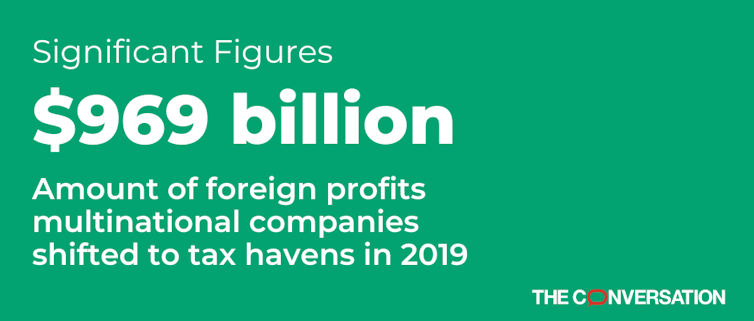
We found that the world’s biggest multinational businesses shifted 37% of the profits – or $969 billion – they earned in other countries (outside the headquarter country) to tax havens in 2019, up from about 20% in 2012 when G-20 leaders met in Los Cabos and agreed to crack down. The figure was less than 2% back in the 1970s. The main reasons for the large increase were the growth of the tax avoidance industry in the 1980s and U.S. policies that made it easier to shift profits from high-tax countries to tax havens.

We also estimate that the amount of corporate taxes lost as a result reached 10% of total corporate revenue in 2019, up from less than 0.1% in the 1970s.

In 2019, the total government tax loss globally was $250 billion. U.S. multinational corporations alone accounted for about half of that, followed by the U.K. and Germany.

Global minimum tax

How do policymakers fix this?

So far, the world as a whole has been trying to solve this problem by cutting or scrapping corporate taxes, albeit in a very gradual way. In the past 40 years, the global effective corporate tax rate has fallen from 23% to 17%. At the same time, governments have relied more heavily on consumption taxes, which are regressive and tend to increase income inequality.

But the root cause of profit-shifting is the incentives involved, such as generous or lenient corporate tax rates in other countries. If countries could agree on a global minimum corporate tax rate of, say, 20%, the problem of profit-shifting would, in our estimation, largely disappear, as tax havens would simply cease to exist.

This type of mechanism is exactly what more than 130 countries signed onto in 2021, with implementation of a 15% minimum tax set to begin in 2024 in the EU, U.K., Japan, Indonesia and many other countries. While the Biden administration has helped spearhead the global effort to implement the tax, the U.S. has notably not been able to get legislation through Congress.

Our research suggests implementing this type of tax reform is necessary to reverse the shift of ever-greater amounts of corporate profits going to tax havens – instead of being taxed by the governments where they operate and create value.The Conversation

About the Author:

Ludvig Wier, External Lecturer of Economics, University of Copenhagen and Gabriel Zucman, Associate Professor of Economics, University of California, Berkeley

This article is republished from The Conversation under a Creative Commons license. Read the original article.


The Year of Living Dangerously – Global Economic Prospects at a Turning Point

By Dan Steinbock

The year 2023 represents a turning point. If economic realities guide global prospects, it will be a positive turnaround. If geopolitics will continue to penalize economic prospects, a negative inflection point is more likely.

Recently, Kristalina Georgieva, Managing Director of the International Monetary Fund (IMF), suggested that the year 2023 could “represent a turning point, with inflation declining and growth bottoming out.” She based the prediction on economic assumptions. Unfortunately, we no longer live under an economic status quo.

Since the mid-2010s and the advanced economies’ trade protectionism, sanctions and militarization, geopolitics has driven global prospects, as it did in the interwar period. As long as these underlying conditions prevail, so will persistent inflation.

The year 2023 could represent a turning point. Not the kind Georgieva had in mind – but a negative reversal.

Poor economies driving global growth

While the latest IMF projections show global growth slowing to 2.9 percent this year, the IMF anticipates a modest rebound to 3.1 percent in 2024. But it is the emerging and developing economies that are providing the momentum.

In 2021-24, the share of global growth by the largest emerging and developing economies will climb from 63 to over 80 percent. Accordingly, the share of the advanced economies will almost halve to less than 20 percent (Figure 1).

Figure 1 Global growth, 2021-E2024

Source: IMF


Starting from a low base, India’s GDP is still barely an eighth relative to the US and its growth is now slowing from the 7% growth projected to 6.8% in the 2023/24 fiscal year, as the global slowdown is likely to hurt exports. However, China’s GDP is already three-fourths of that of the US and this year growth in the mainland (5.8-6.5%) could prove almost as fast as that of India (6.0-6.8%).

Together, China and India are likely to account for almost a third of global growth in 2023, as the major advanced economies are coping with recessionary conditions. Furthermore, the share of emerging and developing economies of global growth will progressively increase, whereas that of advanced economies will continue to fall as secular stagnation is spreading among them.

The Fed as a global risk

Global economic prospects have been further penalized by the US Federal Reserve’s ill-advised monetary policies, particularly since fall 2021. After years of easy money and rounds of quantitative easing, the Fed misread the market signals after mid-2021, when inflation started to climb rapidly, and Fed chairman Jerome Powell downplayed the threat of soaring prices calling them “transitionary.”

It was a fatal policy mistake, which a year ago led to my warning that US inflation was the global risk of 2022. With the onset of the proxy war only a month later, I predicted that the world economy would have to cope with the risk of stagflationary recession, compounded by energy and food inflation. The rest, as they say, is history.

In its February 2023 meeting, the Fed raised the interest rate to 4.5-4.8 percent, pushing borrowing costs to the highest since 2007. Recently, Powell warned of more rate hikes and seems to be aiming at a rate of 5.25 to 5.5 percent, thus flirting with a recession.

Rather than transitionary, inflation has proved sticky and persistent. Thanks to America’s central role of the US in the world economy, what happens in America won’t stay in America.

Rich economies’ geopolitics penalizes global growth

Recently, US stocks sank to their lowest levels in a month, with the S&P 500 Index dropping under 4000. Despite interest rate at almost 5 percent, the inflation rate, which soared close to 10 percent in summer 2022, slowed only to 6.4 percent in January.

After the US hit its $31.4 trillion debt limit set by Congress, Treasury Secretary Janet Yellen warned that a failure to make payments that are due “would undoubtedly cause a recession in the US economy and could cause a global financial crisis.” New debt limit can be enacted, but not without unsustainable debt-taking.

In January, euro area bank lending fell again amid downturn, while cash and liquid deposits declined for the first time ever, thanks to rapid rate hikes by the European Central Bank (ECB). The ECB analysts stressed that the euro area has “ shown remarkable economic resilience to the effects of the war [in Ukraine].” But that resilience is elusive because it’s also based on massive debt-taking.

Consumer price inflation was revised slightly higher to 8.6 percent year-on-year in January. That’s significantly below the peak of 11.1 percent in November, yet remains far above the ECB’s target of 2.0 percent. It is likely to result in half a percentage hike at the Bank’s mid-March meeting.

In Japan, inflation was negative until fall 2021. By January, it soared to 4.2 percent; the biggest increase since September 1981. Core inflation has been well above the Bank of Japan’s (BOJ) 2% target for nine months in a row. This is largely attributable to continued increases in the cost of fuel and raw materials. Hence, the market’s rising concern about global bond market spillovers if and when the BOJ’s new chief Kazuo Ueda will hike interest rates (Figure 2).

Figure 2 Inflation and interest rates: US, euro area, Japan, and China

Source: Tradingeconomics, Difference Group


China’s rebound offsets the Fed’s risks

When Chinese policymakers began to prepare the reopening of the world’s second-largest economy, many international observers warned it would unleash inflationary headwinds. But numbers do not back up the story.

China’s annual inflation rate rose to only 2.1 percent in January. Expectedly, prices of food jumped and those of non-food gained further on the back of the Lunar New Year festival and the removal of pandemic measures. Nonetheless, the inflation rate remains only half relative to Japan, a third to the US and a fifth compared to the euro area. 

At the eve of the Two Sessions, Chinese leaders pledged stronger growth. Recovery is taking hold and economic activity picking up pace with the country’s reopening. China’s GDP growth could soar to 5.5 to 6 percent in 2023, or over 6 percent on a quarter-to-quarter basis.

Internally, China’s emphasis on social policies promoting a moderately prosperous society supports rising purchasing power among new middle-income groups. External risks have been in part reduced by the misguided US trade wars and protectionism, which have compelled Chinese policy authorities to stress the importance of self-sufficiency. Spillovers will be significant in those economies that participate in China’s huge Belt and Road Initiative (BRI), and the Regional Comprehensive Economic Partnership (RCEP), the vast new trade bloc.

Global growth engines, without voice

The US, the euro area and Japan are struggling with secular stagnation and exporting runaway inflation. By contrast, China’s growth is accelerating while inflation remains in check. Its reopening could lift global GDP up to a stunning 1 percent in 2023.

Large emerging and developing economies are today’s global growth engines. Currently, their share of global growth exceeds 80 percent. While cyclical recession will end in the major advanced economies, their secular stagnation has barely begun. In the coming decade, the growth gap between the rich and poor economies won’t go away. It is positioned to deepen.

With broadening secular stagnation, the long-run economic growth in the major advanced economies will approach zero. Perhaps that’s why they are now so eager to use geopolitics and military muscle.

 About the Author:

Dr. Dan Steinbock is an internationally recognized strategist of the multipolar world and the founder of Difference Group. He has served at the India, China and America Institute (USA), Shanghai Institutes for International Studies (China) and the EU Center (Singapore). For more, see https://www.differencegroup.net


The original commentary was released by China-US Focus on March 1, 2023.


Murrey Math Lines 02.03.2023 (USDCHF, XAUUSD)

By RoboForex.com

USDCHF, “US Dollar vs Swiss Franc”

On H4, the quotes are above the 200-day Moving Average, revealing prevalence of an uptrend. The RSI has bounced off the support level. The quotes should now rise above the resistance level of 7/8 (0.9460) and grow to 8/8 (0.9521). The scenario can be cancelled by a downward breakaway of the support level of 6/8 (0.9399). In this case, the pair may drop to 4/8 (0.9277).

USDCHFH4
Risk Warning: the result of previous trading operations do not guarantee the same results in the future

On M15, the upper line of VoltyChannel is broken away, which increases the probabilitt of further growth.

USDCHF_M15
Risk Warning: the result of previous trading operations do not guarantee the same results in the future

XAUUSD, “Gold vs US Dollar”

On H4, the quotes are under the 200-day Moving Average, which indicates prevalence of a downtrend. The RSI has bounced off the resistance line. As a result, a downward breakaway of 1/8 (1828.12) is expected, followed by falling to the support level of -1/8 (1796.88). The scenario can be cancelled by an upward breakaway of the resistance level of 2/8 (1843.75). In this case, the quotes might rise to 4/8 (1875.50).

XAUUSD_H4
Risk Warning: the result of previous trading operations do not guarantee the same results in the future

On M15, further falling of the price can be supported by a breakaway of the lower border of VoltyChannel.

XAUUSD_M15

Article By RoboForex.com

Attention!
Forecasts presented in this section only reflect the author’s private opinion and should not be considered as guidance for trading. RoboForex LP bears no responsibility for trading results based on trading recommendations described in these analytical reviews.

5 sectors to benefit from China NPC summit as Xi tightens grip

By George Prior

Investors around the world will be closely following China’s National People’s Congress (NPC), which kicks off this weekend, for signals about which sectors are likely to benefit from President Xi’s latest political and economic developments.

The NPC is one of the most important political events in the world’s second-largest economy. It is the annual meeting of the highest organ of state power and the country’s top legislative body.

Nigel Green, CEO and founder of deVere Group, one of the world’s largest independent financial advisory, asset management and fintech organizations, says: “Investors always closely watch the NPC for any indicators about changes in economic policies that could impact financial markets and business in China – but this year’s event is more critical.

“This is the first NPC since China has moved away from its zero-Covid policy to combat the pandemic. It also comes as Xi tightens his grip on power.”

“Global investors will be looking for signals on China’s policy priorities and goals, and potential opportunities and risks.”

He believes that there are likely to be five sectors that could benefit from the latest policy agenda to be set out this weekend.

First, tech. “China’s focus on innovation and tech has been a major theme in previous NPC events. Beijing has committed to increasing investment in areas such as artificial intelligence, semiconductors, and 5G.

“Domestic and foreign companies involved in these sectors could receive increased government support,” affirms Nigel Green.

Second, infrastructure. “The NPC typically includes rhetoric about infrastructure investment, including plans for new roads, railways, amongst other public works projects.”

Third, healthcare. The deVere Group CEO notes that “China’s aging population has led to increased demand for healthcare services, and the government has made improving healthcare a priority, including further investment in areas such as medical research, new hospitals and pharmaceuticals.”

Fourth, renewable energy. “Beijing has set ambitious targets for slashing greenhouse gas emissions, and the NPC often includes highlights on how it aims to achieve these targets.”

Fifth, consumer goods. Nigel Green says: “As China’s middle class continues to grow, there’s increasing demand for quality consumer goods. Entities involved in areas such as retail, luxury goods, and e-commerce will benefit from increased consumer spending.”

Last week, President Xi encouraged bankers in China to ‘clean up’ their western lifestyles and be less ‘hedonistic.’

“This reflects his wider aim to promote traditional Chinese values, tackle corruption, and maintain social stability and a more modest way of life,” says the deVere CEO.

“The importance of this event for global investors, which will shape the world’s second-largest economy, cannot be overestimated,” he concludes.

About:

deVere Group is one of the world’s largest independent advisors of specialist global financial solutions to international, local mass affluent, and high-net-worth clients.  It has a network of more than 70 offices across the world, over 80,000 clients and $12bn under advisement.

The Analytical Overview of the Main Currency Pairs on 2023.03.02

By JustMarkets

The EUR/USD currency pair

Technical indicators of the currency pair:
  • Prev Open: 1.0575
  • Prev Close: 1.0668
  • % chg. over the last day: +0.87 %

A 0.5% rate hike is almost guaranteed at the ECB’s March meeting, and investors are focused on how the ECB will further shape monetary policy. This week’s negative inflation data from France, Spain, and Germany have prompted markets to assess a longer cycle of tightening monetary policy that will see the deposit rate peak at 4%. Bank of France Governor François Villeroy de Galhau said Wednesday in Paris that the final rate should be reached no later than September. Eurostat will publish Eurozone inflation data today. Analysts forecast that overall inflation will fall from 8.6% to 8.3%, while core inflation will remain at an annualized rate of 5.3%.

Trading recommendations
  • Support levels: 1.0644,1.0595, 1.0544
  • Resistance levels: 1.0704, 1.0804, 1.0906, 1.0926, 1.0967, 1.1017, 1.1077

The trend on the EUR/USD currency pair on the hourly time frame is bearish. But the price is approaching the priority change level. The MACD indicator has become positive, and buyers’ pressure is increasing. Under such market conditions, buy trades are best considered from the support level of 1.0644 or 1.0595, but with confirmation on the intraday time frames. Sell deals can be considered from the resistance level of 1.0704 under a false breakout or an impulse return of the price below the 1.0644 level.

Alternative scenario: if the price breaks down through the resistance level of 1.0704 and fixes above it, the uptrend will likely resume.

EUR/USD
News feed for 2023.03.02:
  • – Eurozone Consumer Price Index (m/m) at 12:00 (GMT+2);
  • – Eurozone Unemployment Rate (m/m) at 12:00 (GMT+2);
  • – Eurozone ECB Monetary Policy Statement (m/m) at 14:30 (GMT+2);
  • – US Initial Jobless Claims (w/w) at 15:30 (GMT+2);
  • – US FOMC member Waller Speaks at 23:00 (GMT+2).

The GBP/USD currency pair

Technical indicators of the currency pair:
  • Prev Open: 1.2018
  • Prev Close: 1.2026
  • % chg. over the last day: +0.07 %

Over the last month, the index of business activity in the UK manufacturing sector has slightly increased from 49.2 to 49.3. The dynamics of recovery can be traced for the whole quarter, but production is still in contraction territory for more than seven months. Bank of England Governor Andrew Bailey warned yesterday that there is “no easy way out” of the UK cost of living crisis, and further interest rate hikes may be needed to combat inflation. Bailey also added that the final decision on interest rates would depend on the latest inflation data.

Trading recommendations
  • Support levels: 1.1984, 1.1929, 1.1875
  • Resistance levels: 1.2087, 1.2147, 1.2200, 1.2267, 1.2311, 1.2416

From the technical point of view, the trend on the GBP/USD currency pair on the hourly time frame is bearish. At the moment, the price is trading below the moving averages. The MACD indicator has become negative. Within the day, sales prevail, but their pressure decreases. Under such market conditions, it is better to look for buy deals from the support level of 1.1984, but better with confirmation. It is better to look for sell deals from the resistance level of 1.2087 but with a confirmation in the form of a false breakout.

Alternative scenario: if the price breaks out through the 1.2147 resistance level and fixes above it, the uptrend will likely resume.

GBP/USD
There is no news feed for today.

The USD/JPY currency pair

Technical indicators of the currency pair:
  • Prev Open: 136.10
  • Prev Close: 136.18
  • % chg. over the last day: +0.06 %

Bank of Japan (BOJ) board spokeswoman Nakagawa said Wednesday that the central bank should maintain an ultra-soft monetary policy for now, as the economy has not yet reached a steady 2% inflation target. Ms. Nakagawa also added that more time is needed to assess whether the Bank of Japan’s December decision to extend the limits of its 10-year bond yield target will be enough to correct market distortions caused by active bond purchases. Investors are putting pressure on the Bank of Japan to lock in yield control, but so far, the situation remains unchanged.

Trading recommendations
  • Support levels: 135.04, 134.04, 133.47, 132.95, 131.43, 129.68, 129.98, 129.19
  • Resistance levels: 136.55, 137.48

From the technical point of view, the medium-term trend on the currency pair USD/JPY is bullish. But the price formed a false breakout area above the resistance level of 136.55. Now this area will act as an obstacle for the bulls. The MACD indicator is in the positive zone, but signs of divergence are still observed in several time frames. Under such market conditions, buy trades are best sought from the support level of 135.60 or 135.04, but only with confirmation. Sell deals can be sought from the 136.55 level, but with additional confirmation in the form of a reverse initiative on the lower time frames.

Alternative scenario: if the price fixes below the 134.04 support level, the downtrend will be resumed with a high probability.

USD/JPY
There is no news feed for today.

The USD/CAD currency pair

Technical indicators of the currency pair:
  • Prev Open: 1.3639
  • Prev Close: 1.3590
  • % chg. over the last day: -0.36 %

Oil prices rose on Wednesday as China’s January manufacturing activity data was above expectations and served as an indicator of energy demand from the world’s largest crude oil importer. The Canadian dollar is a commodity currency, so rising oil prices tend to accompany a strengthening Canadian. Other data showed that Canada’s Manufacturing Purchasing Managers’ Index (PMI) was 52.4 in February, up from 51.0 in January and the highest reading since last July. The report said the pace of growth in output and new orders is the fastest since last May as companies continue to add new jobs. This is another growth driver for the Canadian currency.

Trading recommendations
  • Support levels: 1.3582, 1.3513, 1.3471, 1.3441, 1.3390, 1.3347, 1.3295, 1.3212
  • Resistance levels: 1.3664, 1.3700

From the point of view of technical analysis, the trend on the USD/CAD currency pair is bullish. The price is trading at the level of the moving averages and forming a wide-volatile corridor, which makes it difficult to find good entry points. The MACD indicator has become inactive. Under such market conditions, it is worth looking for buy trades from the support level of 1.3582, but only with a confirmation in the form of a false breakdown. Sell trades may be sought from the resistance level of 1.3664 or 1.3700, but only with a confirmation of a false breakout and short targets. A false break is very important for the price reversal because there is liquidity grabbing behind the level.

Alternative scenario: if the price breaks down and consolidates below the support level of 1.3513, the downtrend will likely resume.

USD/CAD
There is no news feed for today.

By JustMarkets


This article reflects a personal opinion and should not be interpreted as an investment advice, and/or offer, and/or a persistent request for carrying out financial transactions, and/or a guarantee, and/or a forecast of future events.

Fed policymakers are again considering a rate hike to the 0.5% step. The ECB began to cut its balance sheet

By JustMarkets

According to ISM, the US Manufacturing Activity Index rose from 47.4 to 47.7 in February, slightly below expectations of 48.0. To understand what this index shows – any value above 50 signals growth in the sector, while values below this threshold indicate a contraction. The US manufacturing activity index has remained in falling territory for the fourth consecutive month, a sign that the economic outlook is challenging amid persistently high inflation and rapidly rising interest rates. While the manufacturing sector has been in recession since last November, the jump in prices suggests that inflation is likely to remain resilient in the coming months, raising the risk that the Fed could raise its final rate in its efforts to restore price stability. That could mean a 50 basis point interest rate hike at the March FOMC meeting, which would be a bullish catalyst for the US dollar and a bearish catalyst for stock indices.

As the stock market closed Tuesday, the Dow Jones Index (US30) increased by 0.02%, while the S&P 500 Index (US500) fell by 0.47%. The NASDAQ Technology Index (US100) closed negative by 0.66%.

Rafael Bostic, president of the Federal Reserve Bank of Atlanta, called for further interest rate hikes above 5% to get inflation back to the Central Bank’s target level. “I think we will need to raise the federal funds rate to 5-5.25% and leave it at that level until 2024,” Bostick said. Fed funds futures show that the final rate will reach the 5.5%-5.75% range by September 2023. Monthly labor market data and consumer price data in the coming days will help investors gauge the trajectory of rates ahead of the March 21-22 meeting.

Equity markets in Europe mostly fell yesterday. German DAX (DE30) decreased by 0.39%, French CAC 40 (FR40) fell by 0.46%, Spanish IBEX 35 (ES35) lost 0.82%, and British FTSE 100 (UK100) closed on the plus side by 0.49%.

The annual inflation rate in Germany remained at 8.7%, the same level as in January, according to the federal statistical agency Destatis. Pressure on prices also remains in other leading eurozone economies. Eurostat will release Eurozone inflation data today. Analysts forecast that overall inflation will fall from 8.6% to 8.3%, while core inflation will remain at an annualized rate of 5.3%.

Bank of France Governor François Villeroy de Galleau said Wednesday in Paris that the ECB’s final rate should be reached no later than September. At the moment, the ECB’s final rate is expected to be 4.0%. Since yesterday, the ECB has started to reduce its balance sheet by an average of 15 billion euros a month. At the same time, Bundesbank President Nagel called for accelerating the pace of balance sheet reduction in the second half of the year.

British Prime Minister Rishi Sunak reached an agreement with the European Union on the status of Northern Ireland, which is expected to open more trade after Brexit between the EU and the United Kingdom.

Oil rises as record US oil exports offset rising inventories. The US crude exports reached a record 5.629 million barrels, with crude inventories up 1.2 million barrels in the last week. Another factor that supported oil price sentiment was China’s production data, which came in above expectations for January and served as an indicator of energy demand from the world’s largest crude oil importer.

Asian markets were rising yesterday. Japan’s Nikkei 225 (JP225) gained 0.26% on the day, China’s FTSE China A50 (CHA50) gained 1.36%, Hong Kong’s Hang Seng (HK50) jumped by 4.21% on the day, India’s NIFTY 50 (IND50) added 0.85%, and Australia’s S&P/ASX 200 (AU200) was positive by 0.09%.

China’s industrial sectors, as well as the service sector, are showing steady growth, which gives hope that the significant lifting of Covid restrictions has seriously boosted China’s economic move.

S&P 500 (F) (US500) 3,951.39 −18.76 (−0.47%)

Dow Jones (US30)32,661.84 +5.14 (+0.016%)

DAX (DE40) 15,305.02 −60.12 (−0.39%)

FTSE 100 (UK100) 7,914.93 +38.65 (+0.49%)

USD Index 104.42 −0.45 (−0.43%)

Important events for today:
  • – Eurozone Consumer Price Index (m/m) at 12:00 (GMT+2);
  • – Eurozone Unemployment Rate (m/m) at 12:00 (GMT+2);
  • – Eurozone ECB Monetary Policy Statement (m/m) at 14:30 (GMT+2);
  • – US Initial Jobless Claims (w/w) at 15:30 (GMT+2);
  • – US Natural Gas Storage (w/w) at 17:30 (GMT+2);
  • – US FOMC member Waller Speaks at 23:00 (GMT+2).

By JustMarkets


This article reflects a personal opinion and should not be interpreted as an investment advice, and/or offer, and/or a persistent request for carrying out financial transactions, and/or a guarantee, and/or a forecast of future events.

Crude Oil Couldn’t Care Less About “Fundamentals”

Instead, here’s historic evidence it adheres to Elliott waves

By Elliott Wave International

If there’s one financial market that investors evaluate based on “market fundamentals,” it’s crude oil.

This Feb. 10 Reuters news item provides an example:

Oil may resume its rally in 2023 as Chinese demand recovers after COVID curbs were scrapped and lack of investment limits growth in supply, OPEC country officials told Reuters, with a growing number seeing a possible return to $100 a barrel.

Of course, whether the price of crude oil rises to $100 this year remains to be seen. The point is to show you a typical forecast based on “fundamentals.”

Yet, over the decades, there have been scores of crude oil forecasts based on “fundamentals” which have simply not panned out. Indeed, quite a few times, prices will move in the opposite direction from the consensus of the “fundamentalists.”

However, Elliott Wave International has observed that crude oil tends to follow Elliott wave patterns of investor psychology.

Let’s look at a historical example. Back in 2008, crude hit an all-time high of almost $150 a barrel. Predictably, the mainstream saw more upside; calls for $200 a barrel were common. But here’s a chart from our June 2008 Global Market Perspective with the “5” wave label (indicating an Elliott wave end to oil’s rise). The commentary from that issue is below the chart:

The fifth wave has carried to the upper line, which signals that the rally is nearing an end. Oftentimes, prices will “throw over” the upper channel for a brief period.

As you can see at the bottom of the chart, the Daily Sentiment Index (courtesy trade-futures.com) revealed that 90% of traders were expecting oil’s price to keep rising. Many energy observers were citing “fundamentals” as the reason why. Meanwhile, both Elliott waves and sentiment agreed: A major top was near.

Indeed, a dramatic “throw over” did occur as crude oil topped a little more than month later. Prices then plummeted 78% in just 5 months, as this chart shows:

Mind you, no analytical method can offer a guarantee about a financial market, and that includes the Elliott wave method.

That said, Elliott wave patterns are far preferrable to “fundamentals” as a way of anticipating crude oil’s turns and trends.

If you’d like to learn how the Elliott wave method can help you in your analysis of financial markets, read Elliott Wave Principle: Key to Market Behavior — the Wall Street classic by Frost & Prechter. Here’s a quote from the book:

Although it is the best forecasting tool in existence, the Wave Principle is not primarily a forecasting tool; it is a detailed description of how markets behave. Nevertheless, that description does impart an immense amount of knowledge about the market’s position within the behavioral continuum and therefore about its probable ensuing path. The primary value of the Wave Principle is that it provides a context for market analysis. This context provides both a basis for disciplined thinking and a perspective on the market’s general position and outlook. At times, its accuracy in identifying, and even anticipating, changes in direction is almost unbelievable.

If you’d like to read the entire online version of the book, you may do so for free once you join Club EWI, the world’s largest Elliott wave educational community. A Club EWI membership costs nothing, yet members enjoy complimentary access to a wealth of Elliott wave resources on investing and trading without any obligation.

Become a Club EWI member now and enjoy the benefits, including free access to Elliott Wave Principle: Key to Market Behavior (just follow this highlighted link to get started).

This article was syndicated by Elliott Wave International and was originally published under the headline Crude Oil Couldn’t Care Less About “Fundamentals”. EWI is the world’s largest market forecasting firm. Its staff of full-time analysts led by Chartered Market Technician Robert Prechter provides 24-hour-a-day market analysis to institutional and private investors around the world.

The Analytical Overview of the Main Currency Pairs on 2023.03.01

By JustMarkets

The EUR/USD currency pair

Technical indicators of the currency pair:
  • Prev Open: 1.0602
  • Prev Close: 1.0575
  • % chg. over the last day: -0.25 %

Important data on manufacturing activity will be released today in Europe and the US. The European PMI is expected to continue recovering but remain in restrictive territory below the 50 mark. With inflation remaining high across Europe, a rise in business activity will only add to the ECB’s confidence to raise interest rates. The ECB will likely raise rates by 0.5% not only in March but also in May.

Trading recommendations
  • Support levels: 1.0565, 1.0544
  • Resistance levels: 1.0644, 1.0704, 1.0804, 1.0906, 1.0926, 1.0967, 1.1017, 1.1077

The trend on the EUR/USD currency pair on the hourly time frame is bearish. At the moment, the price is trading at the level of moving averages. The MACD indicator has become inactive. Under such market conditions, buy trades are best considered from the support level of 1.0565 or 1.0544. Sell positions can be considered from the resistance level of 1.0644, but it is better with confirmation in the form of a reverse initiative on the lower time frames or a false breakout.

Alternative scenario: if the price breaks down through the resistance level of 1.0704 and fixes above it, the uptrend will likely resume.

EUR/USD
News feed for 2023.03.01:
  • – German Retail Sales (m/m) at 09:00 (GMT+2);
  • – German Manufacturing PMI (m/m) at 10:55 (GMT+2);
  • – German Unemployment Rate (m/m) at 10:55 (GMT+2);
  • – Eurozone Manufacturing PMI (m/m) at 11:00 (GMT+2);
  • – US ISM Manufacturing PMI (m/m) at 17:00 (GMT+2).

The GBP/USD currency pair

Technical indicators of the currency pair:
  • Prev Open: 1.2059
  • Prev Close: 1.2022
  • % chg. over the last day: -0.31 %

Based on the latest Gfk consumer report, pessimism about the UK economy seems to be easing a bit as UK citizens see their personal financial situation improving in recent months. The British pound may get some support in the coming days, along with growing optimism about the new version of the Northern Ireland Protocol (the deal regulating the flow of goods from England to Northern Ireland).

Trading recommendations
  • Support levels: 1.2014, 1.1984, 1.1929, 1.1875
  • Resistance levels: 1.2147, 1.2200, 1.2267, 1.2311, 1.2416

From the technical point of view, the trend on the GBP/USD currency pair on the hourly time frame is bearish. At the moment, the price is trading at the level of moving averages. The MACD indicator has become inactive. Under such market conditions, it is better to look for buy deals on intraday time frames from the support level of 1.2014 or 1.1984. Sell trades are best sought from the resistance level of 1.2147 but with a confirmation in the form of a false breakout and an impulse return below the level.

Alternative scenario: if the price breaks out through the 1.2200 resistance level and fixes above it, the uptrend will likely resume.

GBP/USD
News feed for 2023.03.01:
  • – UK Manufacturing PMI (m/m) at 11:30 (GMT+2);
  • – UK BoE Gov Bailey Speaks at 12:00 (GMT+2).

The USD/JPY currency pair

Technical indicators of the currency pair:
  • Prev Open: 136.15
  • Prev Close: 136.23
  • % chg. over the last day: +0.06 %

Current Deputy Governor of the Bank of Japan Masazumi Wakatabe said yesterday that the central bank of Japan must remain alert to the potential dangers of long-term stagnation and low inflation, as price increases caused by cost pressures are short-lived. These comments, along with those of current Bank of Japan governor candidate Kazuo Ueda, appear to have put an end to rumors that the new leadership will change BoJ policy. The Japanese yen remains under pressure versus the US dollar due to the interest rate differential.

Trading recommendations
  • Support levels: 135.06, 133.47, 132.95, 131.43, 129.68, 129.98, 129.19
  • Resistance levels: 136.49, 137.48

From the technical point of view, the medium-term trend on the currency pair USD/JPY is bullish. But the price formed a false breakout area above the resistance level of 136.49. As a rule, such a formation can lead to a temporary correction. The MACD indicator has become inactive, but signs of divergence are still observed in several time frames. Under such market conditions, buy trades are best sought from the support level of 135.06 or after an impulse breakout of the resistance level of 136.49. Sell deals can be sought from 136.49, but with additional confirmation in the form of a reverse initiative on the lower time frames.

Alternative scenario: if the price fixes below the 134.04 support level, the downtrend will be resumed with a high probability.

USD/JPY
News feed for 2023.03.01:
  • – Japan Manufacturing PMI (m/m) at 02:30 (GMT+2).

The USD/CAD currency pair

Technical indicators of the currency pair:
  • Prev Open: 1.3577
  • Prev Close: 1.3644
  • % chg. over the last day: +0.49 %

The Canadian dollar has been dominated by the dollar index lately as markets continue to hawk interest rate guidance for the Federal Reserve. The peak rate forecast for 2023 has now exceeded 5.4%, while money markets forecast no change in the Bank of Canada’s (BoC) upcoming decision. The divergence in interest rates could have a negative impact on Canadians. Over the past month, Canada’s GDP has fallen by 0.1%. This may increase fears of a recession in Canada, putting additional pressure on the Canadian dollar.

Trading recommendations
  • Support levels: 1.3577, 1.3513, 1.3470, 1.3440, 1.3390, 1.3347, 1.3295, 1.3212
  • Resistance levels: 1.3664, 1.3700

From the point of view of technical analysis, the trend on the USD/CAD currency pair is bullish. The price is trading above the moving averages, the MACD indicator is in the positive zone, and the buyers’ pressure remains. Under such market conditions, buy trades should be sought after a pullback to the 1.3577 support level. Sell deals may be sought from the resistance level of 1.3664 or 1.3700, but only with a confirmation in the form of a false breakdown and short targets.

Alternative scenario: if the price breaks down and consolidates below the support level of 1.3469, the downtrend will likely resume.

USD/CAD
News feed for 2023.03.01:
  • – Canada Manufacturing PMI (m/m) at 16:30 (GMT+2);
  • – US Crude Oil Reserves (w/w) at 17:30 (GMT+2).

By JustMarkets


This article reflects a personal opinion and should not be interpreted as an investment advice, and/or offer, and/or a persistent request for carrying out financial transactions, and/or a guarantee, and/or a forecast of future events.

The US stock indices remain under pressure. Inflation is on the rise in Europe

By JustMarkets

The US CB consumer confidence index declined for the second month in a row, a sign that Americans are becoming more pessimistic about economic prospects amid persistently high inflation and rapidly rising interest rates. Looking at the individual components of the report, the current situation index, based on business and labor market assessments, rose to 152.8 from 151.1. Still, the expectation indicator, which tracks short-term income prospects, the business environment, and job opportunities, fell sharply to 69.7 from 76.00. Over the past few weeks, markets have overestimated the Fed’s monetary policy outlook upward because of solid economic data, but expectations could soon change if falling confidence causes a significant decline in consumer spending.

As the stock market closed on Tuesday, the Dow Jones Index (US30) decreased by 0.71%, and the S&P 500 Index (US500) lost 0.30%. NASDAQ Technology Index (US100) closed negative by 0.10%. Economists say the US stock indices seem overvalued based on current rates. Therefore, the path of least resistance is likely to be further reductions. Monetary policy operates with a long and variable lag, so the outlook may continue to deteriorate as the Fed’s cumulative tightening affects the real economy.

Equity markets in Europe were mostly down yesterday. Germany’s DAX (DE30) decreased by 0.11%, France’s CAC 40 (FR40) lost 0.38%, Spain’s IBEX 35 (ES35) added 0.90%, Britain’s FTSE 100 (UK100) closed down by 0.74%.

The latest data showed that inflation in Europe is starting to accelerate again. In France, the consumer price index rose from 6% to 6.2% y/y. In Spain, CPI also jumped from 5.9% to 6.1% year-on-year. Inflationary pressures remain, which means the ECB will probably not slow down the pace of tightening. The main inflation figure for the Eurozone will be published tomorrow.

British Prime Minister Rishi Sunak expressed his optimism about the new version of the Northern Ireland Protocol. This deal will regulate the flow of goods from England to Northern Ireland. The new version proposes a green band for goods remaining in Northern Ireland and a red band for goods destined for Ireland, the EU, and the rest of the EU, which will naturally be subject to stricter inspections.

Despite the rise in gold in the last two days, analysts are confident that the jump in government bond yields will prevent gold and silver from showing a significant and lasting recovery. The precious metals are protective assets at a time of rising inflation but not at a time of monetary tightening.

In the oil market, the strong rebound in US inventories in the previous weeks continues to constrain the rise in oil prices. Investors are also worried about lower demand due to falling economic activity in the face of higher global interest rates imposed to fight inflation. On Tuesday, the US sold an additional 26 million barrels of crude oil from its Strategic Petroleum Reserve.

Asian markets traded flat yesterday. Japan’s Nikkei 225 (JP225) gained 0.08% on the day, China’s FTSE China A50 (CHA50) gained 0.39%, Hong Kong’s Hang Seng (HK50) ended the day down by 0.79%, India’s NIFTY 50 (IND50) fell by 0.51%, and Australia’s S&P/ASX 200 (AU200) was positive by 0.47%.

Recent comments from the new deputy governor of the Bank of Japan, Shinya Uchida, and the current candidate for governor of the Bank of Japan, Kazuo Ueda, set a “dovish” tone in the testimony before the upper house of the Japanese parliament. These comments put an end to rumors that the new BOJ management will change monetary policy in the near future. As for economic data from Japan: Industrial production showed its first decline in 3 months, with output falling by 4.9% m/m in January. Retail sales increased by 1.9% m/m, with clothing and automobiles making the largest contribution.

S&P 500 (F) (US500) 3,970.15 −12.09 (−0.30%)

Dow Jones (US30)32,656.70 −232.39 (−0.71%)

DAX (DE40) 15,365.14 −16.29 (−0.11%)

FTSE 100 (UK100) 7,876.28 −58.83 (−0.74%)

USD Index 104.95 +0.28 (+0.27%)

Important events for today:
  • – Australia GDP (q/q) at 02:30 (GMT+2);
  • – Australia Consumer Price Index (m/m) at 02:30 (GMT+2);
  • – Japan Manufacturing PMI (m/m) at 02:30 (GMT+2);
  • – China Manufacturing PMI (m/m) at 03:30 (GMT+2);
  • – China Non-Manufacturing PMI (m/m) at 03:30 (GMT+2);
  • – German Retail Sales (m/m) at 09:00 (GMT+2);
  • – Switzerland Retail Sales (m/m) at 09:30 (GMT+2);
  • – Switzerland Manufacturing PMI (m/m) at 10:30 (GMT+2);
  • – German Manufacturing PMI (m/m) at 10:55 (GMT+2);
  • – German Unemployment Rate (m/m) at 10:55 (GMT+2);
  • – Eurozone Manufacturing PMI (m/m) at 11:00 (GMT+2);
  • – UK Manufacturing PMI (m/m) at 11:30 (GMT+2);
  • – UK BoE Gov Bailey Speaks at 12:00 (GMT+2);
  • – Canada Manufacturing PMI (m/m) at 16:30 (GMT+2);
  • – US ISM Manufacturing PMI (m/m) at 17:00 (GMT+2);
  • – US Crude Oil Reserves (w/w) at 17:30 (GMT+2).

By JustMarkets


This article reflects a personal opinion and should not be interpreted as an investment advice, and/or offer, and/or a persistent request for carrying out financial transactions, and/or a guarantee, and/or a forecast of future events.

EURUSD rebound in progress

By ForexTime

In our latest Week Ahead article (posted on Fridays), we offered 3 reasons why EURUSD could see a rebound this week.

And that rebound is in progress, with EURUSD punching its way to a one-week high, at the time of writing.

Traders are apparently pricing in their expectations ahead of the February Eurozone consumer price index (CPI) data release due tomorrow (Thursday, March 2nd).

So far this week, Euro bulls (those hoping prices will go higher) have been treated to some hotter-than-expected inflation data out of some of the Eurozone’s major economies:

  • February 28th: France’s CPI registered at 6.2%.
    That’s higher than the market forecasts of 6.1% and also higher than January’s 6% print.
  • February 28th: Spain’s CPI registered at 6.1%.
    That’s higher than the market forecasts of 5.8% and also higher than January’s 5.9% print.
  • March 1st: The CPI for the German state of North Rhine-Westphalia (NRW) came in at 8.5%.
    That’s higher than January’s 8.3% print.
    Germany’s national CPI is due at 1:00PM GMT today.

Such CPI prints from member economies are setting things up for a higher-than-expected Eurozone inflation figures tomorrow.

And still-stubborn inflation implies that the European Central Bank will have to raise its benchmark rates even higher than previously anticipated.

Hence, the prospects of ECB rates moving even higher has translated into gains for the Euro currency.


From a technical perspective …

The EURUSD currency pair on the H4 time frame was in an unusually long downward trend that lasted until a lower bottom formed on 27 February at 1.05330.

A look at the Momentum Oscillator reveals positive divergence between points “a” and “b” when comparing the bottoms at 1.05362 and 1.05330.

This would have alerted technical traders that the bears might be losing momentum.

After the lower bottom at 1.05330, the bulls broke through the 15 and 34 Simple Moving Averages and the Momentum Oscillator followed by breaking through the 100 baseline into bullish country.

A resistance level formed on 28 February at 1.06454 and the bears moved in to take over again. The bulls would not allow them and a bottom formed on 1 March at 1.05654.

Later in the same session the price broke through the resistance level at 1.06454 and three possible price targets can be estimated from there.

Attaching the Fibonacci tool to the higher top 1.06454 and dragging it to the bottom of a support level near the 15 Simple Moving Average at 1.05654, the following targets can be established:

  • First target may be considered at 1.06948 (161.8%)
  • Second price target is possible at 1.07748 (261.8%) which is at a weekly resistance level so the bears might retest the bullish resolve there.  
  • Third and final target might be estimated at 1.09043 (423.6%).

If the support level at 1.05654 is breached, the bullish scenario is no longer valid and any open risk should be managed very tightly.

As long as the bulls keep building momentum and demand overcomes supply, the market sentiment for EURUSD on the H4 time frame will be upwards.


Forex-Time-LogoArticle by ForexTime

ForexTime Ltd (FXTM) is an award winning international online forex broker regulated by CySEC 185/12 www.forextime.com