
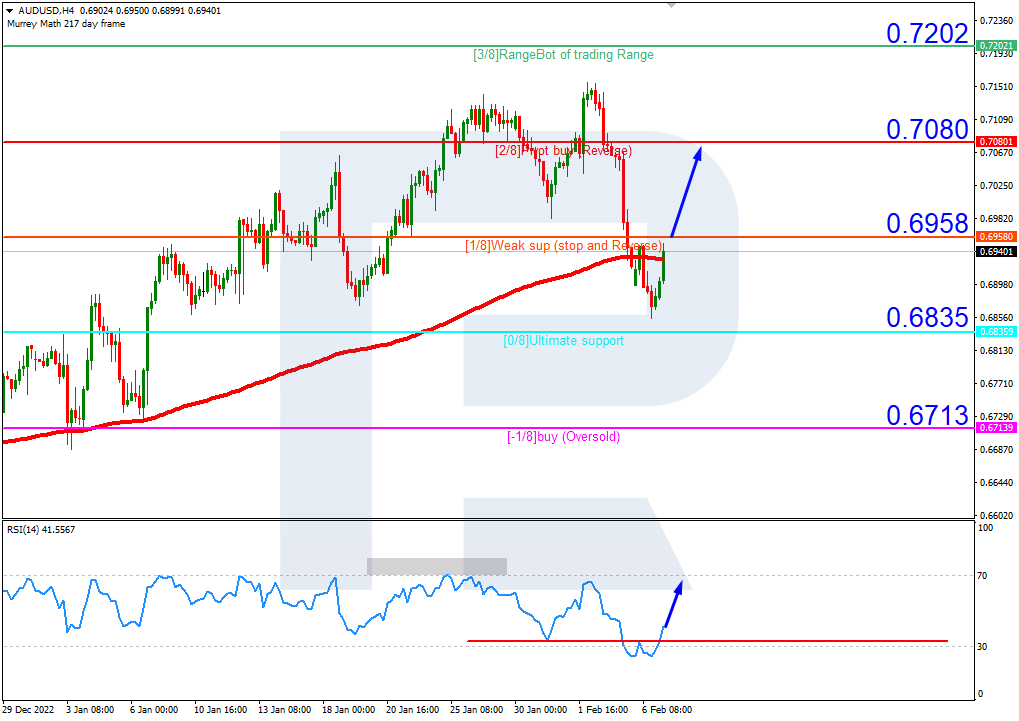
AUDUSD, “Australian Dollar vs US Dollar”
On H4, the quotes have broken through the 200-day Moving Average upwards, which indicates possible development of an uptrend. The RSI has broken through the resistance line. Hence, a breakaway of 1/8 (0.6958) upwards should be expected, followed by growth to the resistance level of 2/8 (0.7080). The scenario can be cancelled by a downward breakaway of the support level of 0/8 (0.6958). In this case, the pair may drop to -1/8 (0.6713).

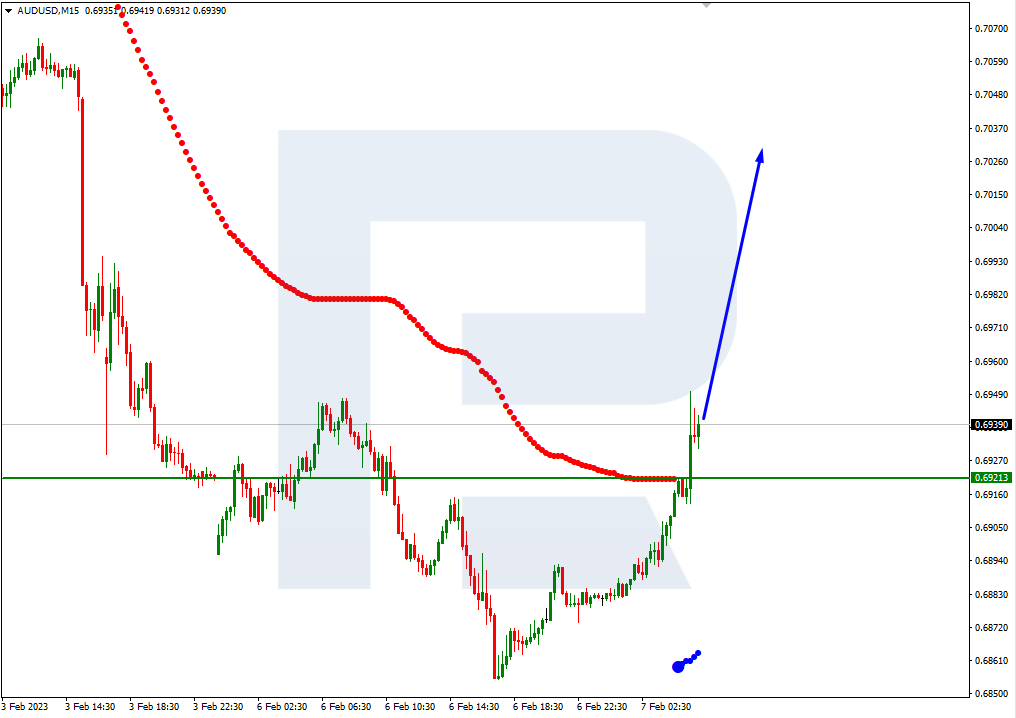
On M15, the upper border of VoltyChannel is broken away. This increases the probability of further price growth.
Free Reports:
 Get our Weekly Commitment of Traders Reports - See where the biggest traders (Hedge Funds and Commercial Hedgers) are positioned in the futures markets on a weekly basis.
 Sign Up for Our Stock Market Newsletter – Get updated on News, Charts & Rankings of Public Companies when you join our Stocks Newsletter
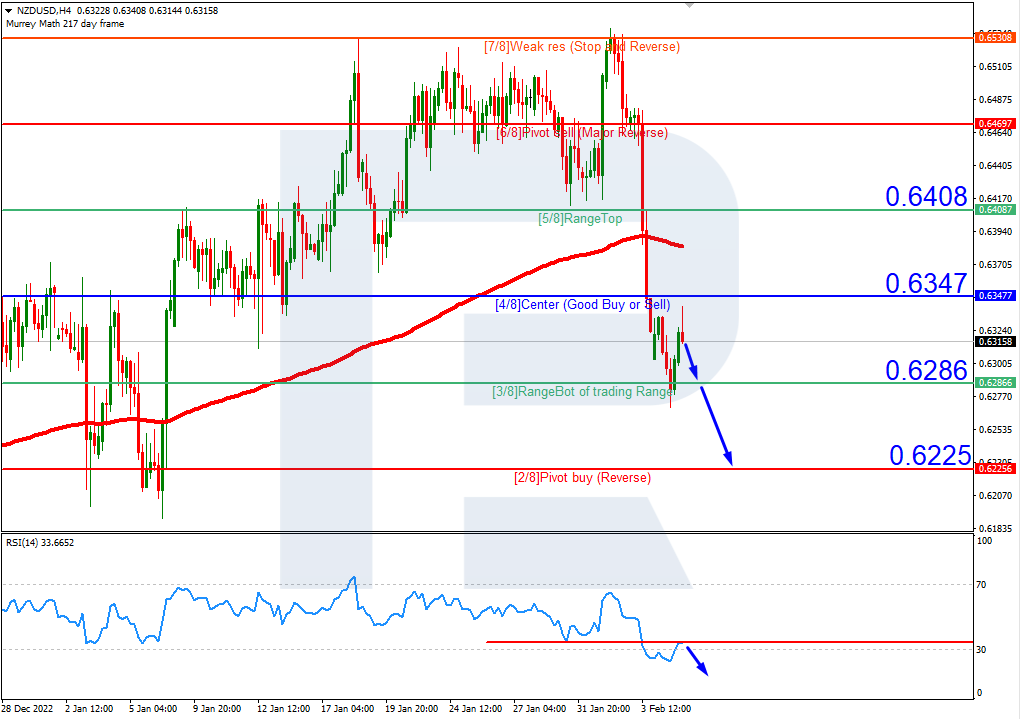
NZDUSD, “New Zealand Dollar vs US Dollar”
On H4, the quotes are under the 200-day Moving Average, which indicates prevalence of a downtrend. The RSI is testing the resistance line. As a result, a downward breakaway of 3/8 (0.6286) is expected, followed by falling to the support level of 2/8 (0.6225). The scenario can be cancelled by rising over the resistance level of 4/8 (0.6347). In this case, the pair may rise to 5/8 (0.6408).
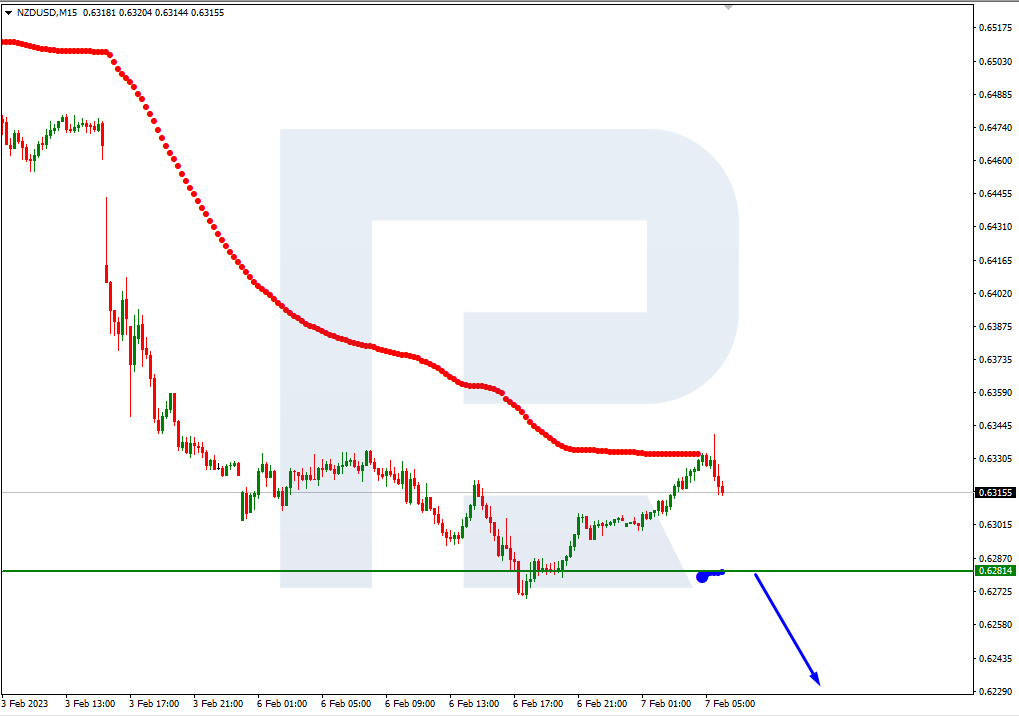
On M15, falling of the price can be additionally supported by a breakaway of the lower border of VoltyChannel.
Article By RoboForex.com
Attention!
Forecasts presented in this section only reflect the author’s private opinion and should not be considered as guidance for trading. RoboForex LP bears no responsibility for trading results based on trading recommendations described in these analytical reviews.

- COT Metals Charts: Weekly Speculator Bets see small gains for Silver & Gold Jul 12, 2026
- COT Bonds Charts: Speculator Bets led by SOFR 3-Months & 2-Year Bonds Jul 12, 2026
- COT Energy Charts: Weekly Speculator Changes led by Brent Oil Jul 12, 2026
- COT Soft Commodities Charts: Weekly Speculator Changes led by Sugar, Corn & Soybeans Jul 12, 2026
- The US and European stock indices are rising again amid renewed investor interest in the AI industry. Jul 10, 2026
- USD/JPY Falls as Yen Recovers Weekly Losses Jul 10, 2026
- Crude oil prices surged sharply by 7% in reaction to the rapid escalation of the conflict in the Middle East Jul 9, 2026
- Middle East Tensions Weigh on Gold Jul 9, 2026
- Pound Awaits Tighter Policy from Bank of England Jul 8, 2026
- The United States carried out airstrikes on Iran after Iran’s attacked tankers in the Strait of Hormuz. The RBNZ raised the interest rate to 2.5% Jul 8, 2026