By InvestMacro
Here are the latest charts and statistics for the Commitment of Traders (COT) data published by the Commodities Futures Trading Commission (CFTC).
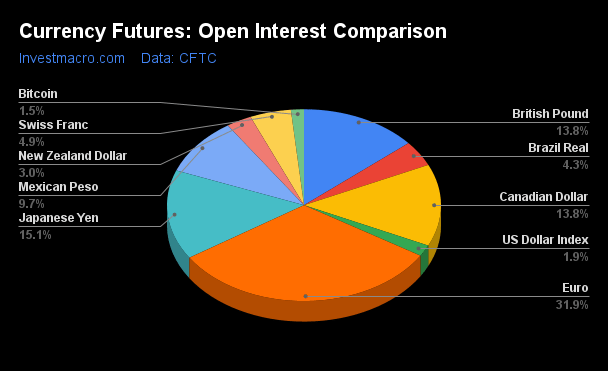
The latest COT data is updated through Tuesday July 16th and shows a quick view of how large market participants (for-profit speculators and commercial traders) were positioned in the futures markets. All currency positions are in direct relation to the US dollar where, for example, a bet for the euro is a bet that the euro will rise versus the dollar while a bet against the euro will be a bet that the euro will decline versus the dollar.
Weekly Speculator Bets led by British Pound & Japanese Yen
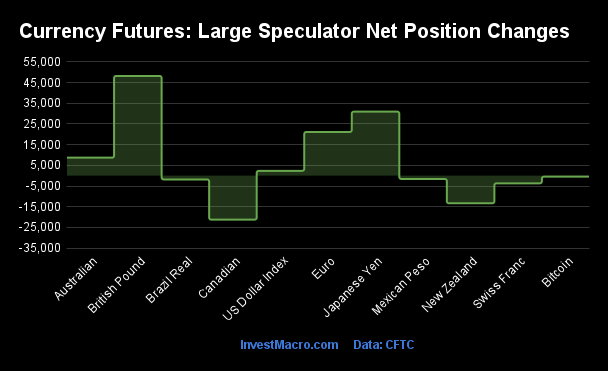
The COT currency market speculator bets were lower this week as five out of the eleven currency markets we cover had higher positioning while the other six markets had lower speculator contracts.
Leading the gains for the currency markets was the British Pound (48,212 contracts) with the Japanese Yen (30,961 contracts), the EuroFX (21,126 contracts), the Australian Dollar (8,700 contracts) and the US Dollar Index (2,342 contracts) also recording positive weeks.
The currencies seeing declines in speculator bets on the week were the Canadian Dollar (-21,261 contracts), the New Zealand Dollar (-13,351 contracts), the Swiss Franc (-3,705 contracts), the Mexican Peso (-1,613 contracts), the Brazilian Real (-1,842 contracts) and with Bitcoin (-461 contracts) also registering lower bets on the week.
Currency Speculators push British Pound bets to Record High
Highlighting the COT currency’s data is the new record high bullish sentiment in the speculator’s positioning of the British Pound Sterling.
Large speculative Sterling positions jumped this week by +48,212 contracts following last week’s rise by +22,649 contracts and the previous week’s (two weeks ago) gain by +17,993 contracts. This week’s rise by over +48,000 contracts is the largest one-week increase on record and pushed the overall net speculator standing to +132,902 contracts – a new all-time record bullish position. This new high level surpasses the previous record high of +98,366 contracts that was recorded on July 17th of 2007.
The GBP position has now gained by +152,977 contracts in just the past nine weeks, going from a bearish level of -20,075 contracts on May 14th to a new record high level this week to complete an incredible sentiment turnaround in a short period of time.
The Pound Sterling exchange rate (GBPUSD currency pair) against the US Dollar has been on the move higher and touched above the 1.3000 level this week for the first time in almost exactly a year. Helping the GBP strength is the outlook that the Bank of England will take longer to cut their interest rate due to sticky inflation while the US Federal Reserve is forecast-ed to start cutting rates this year and the Eurozone is possibly going to reduce their rate again in September.
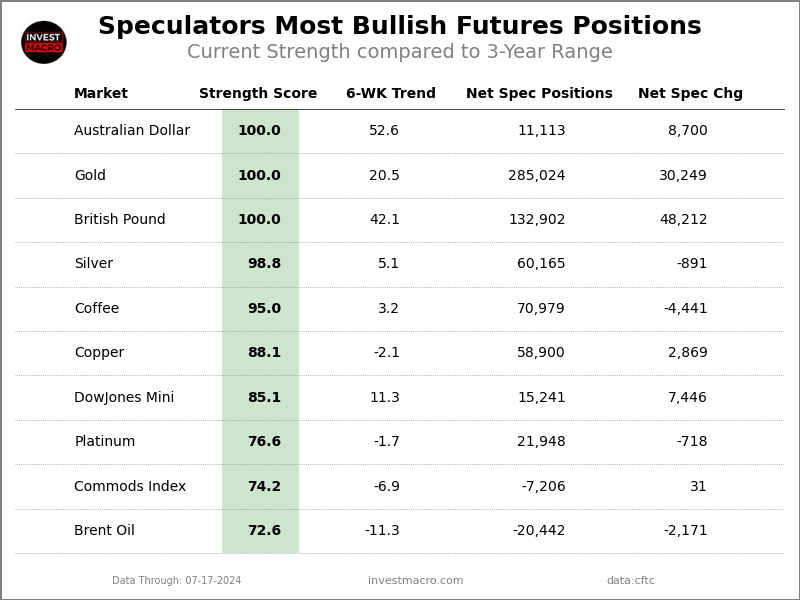
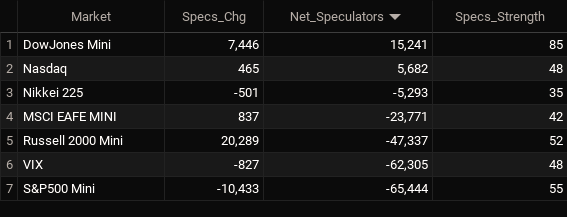
Currencies Net Speculators Leaderboard
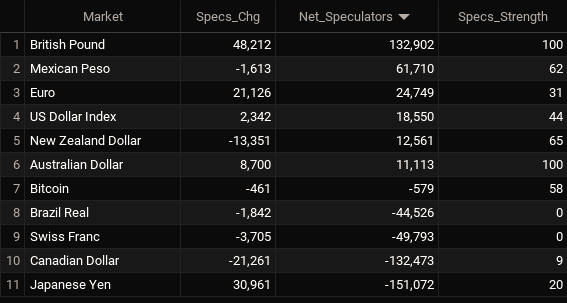
Legend: Weekly Speculators Change | Speculators Current Net Position | Speculators Strength Score compared to last 3-Years (0-100 range)
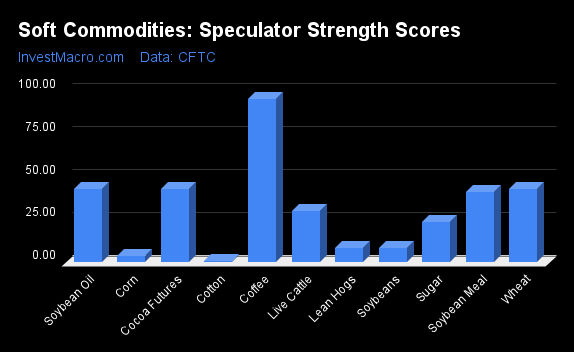
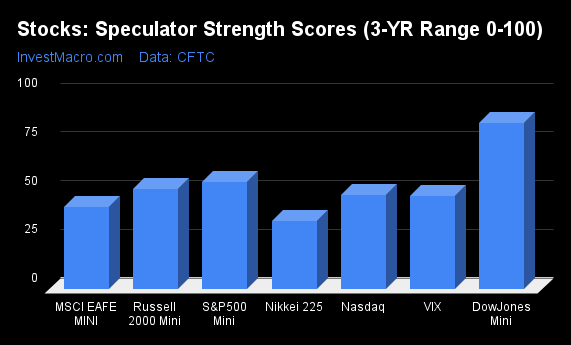
Strength Scores led by British Pound & Australian Dollar
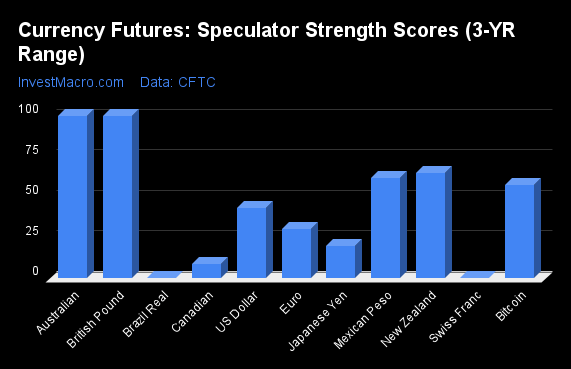
COT Strength Scores (a normalized measure of Speculator positions over a 3-Year range, from 0 to 100 where above 80 is Extreme-Bullish and below 20 is Extreme-Bearish) showed that the British Pound (100 percent) and the Australian Dollar (100 percent) lead the currency markets this week. The New Zealand Dollar (65 percent), Mexican Peso (62 percent) and Bitcoin (58 percent) come in as the next highest in the weekly strength scores.
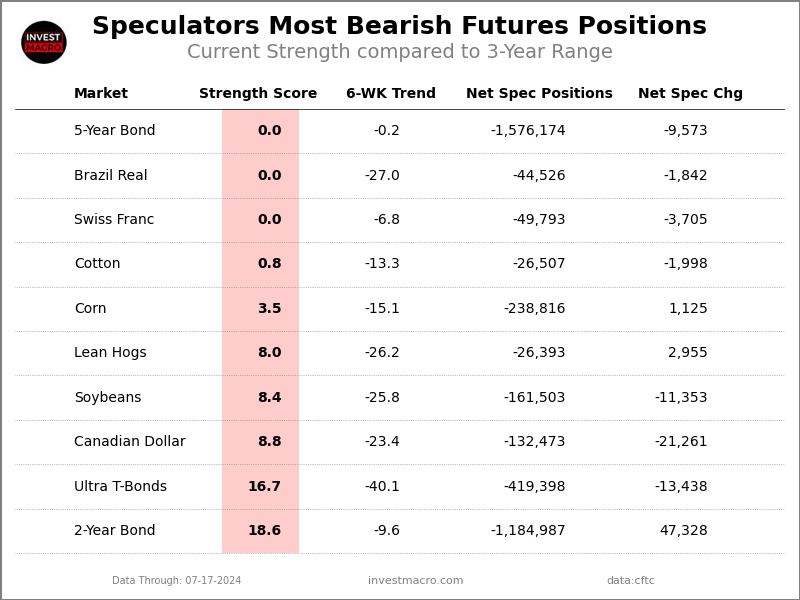
On the downside, the Brazilian Real (0 percent), the Swiss Franc (0 percent) and the Canadian Dollar (9 percent) come in at the lowest strength levels currently and are in Extreme-Bearish territory (below 20 percent).
Strength Statistics:
US Dollar Index (43.6 percent) vs US Dollar Index previous week (38.6 percent)
EuroFX (30.8 percent) vs EuroFX previous week (21.9 percent)
British Pound Sterling (100.0 percent) vs British Pound Sterling previous week (77.4 percent)
Japanese Yen (20.2 percent) vs Japanese Yen previous week (1.3 percent)
Swiss Franc (0.0 percent) vs Swiss Franc previous week (6.2 percent)
Canadian Dollar (8.8 percent) vs Canadian Dollar previous week (21.0 percent)
Australian Dollar (100.0 percent) vs Australian Dollar previous week (92.7 percent)
New Zealand Dollar (65.0 percent) vs New Zealand Dollar previous week (90.7 percent)
Mexican Peso (61.7 percent) vs Mexican Peso previous week (62.5 percent)
Brazilian Real (0.0 percent) vs Brazilian Real previous week (1.9 percent)
Bitcoin (57.7 percent) vs Bitcoin previous week (64.6 percent)
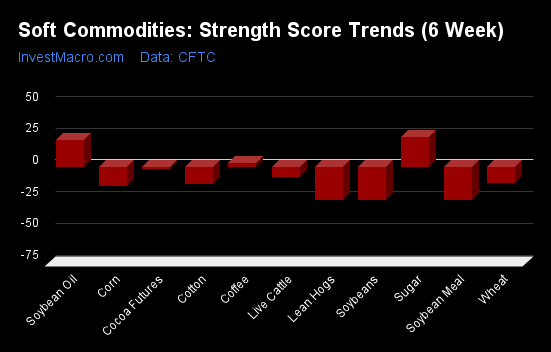
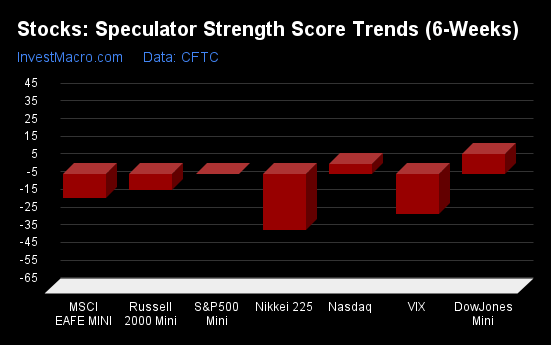
Australian Dollar & British Pound top the 6-Week Strength Trends
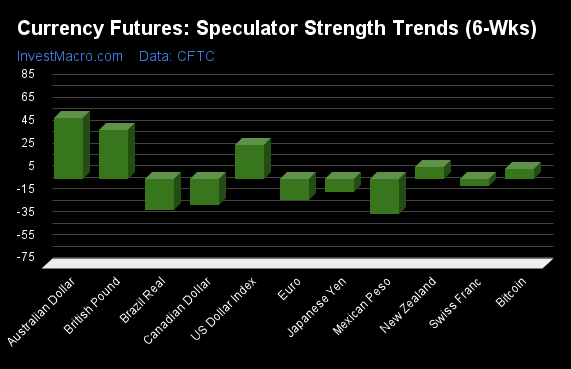
COT Strength Score Trends (or move index, calculates the 6-week changes in strength scores) showed that the Australian Dollar (53 percent) and the British Pound (42 percent) lead the past six weeks trends for the currencies. The US Dollar Index (29 percent), the New Zealand Dollar (10 percent) and Bitcoin (8 percent) are the next highest positive movers in the latest trends data.
The Mexican Peso (-31 percent) leads the downside trend scores currently with the Brazilian Real (-27 percent), Canadian Dollar (-23 percent) and the EuroFX (-18 percent) following next with lower trend scores.
Strength Trend Statistics:
US Dollar Index (29.1 percent) vs US Dollar Index previous week (25.7 percent)
EuroFX (-18.4 percent) vs EuroFX previous week (-23.0 percent)
British Pound Sterling (42.1 percent) vs British Pound Sterling previous week (27.8 percent)
Japanese Yen (-11.6 percent) vs Japanese Yen previous week (-15.8 percent)
Swiss Franc (-6.8 percent) vs Swiss Franc previous week (-2.9 percent)
Canadian Dollar (-23.4 percent) vs Canadian Dollar previous week (-14.1 percent)
Australian Dollar (52.6 percent) vs Australian Dollar previous week (44.1 percent)
New Zealand Dollar (10.3 percent) vs New Zealand Dollar previous week (45.9 percent)
Mexican Peso (-30.9 percent) vs Mexican Peso previous week (-28.3 percent)
Brazilian Real (-27.0 percent) vs Brazilian Real previous week (-6.4 percent)
Bitcoin (8.1 percent) vs Bitcoin previous week (9.6 percent)
Individual COT Forex Markets:
US Dollar Index Futures:
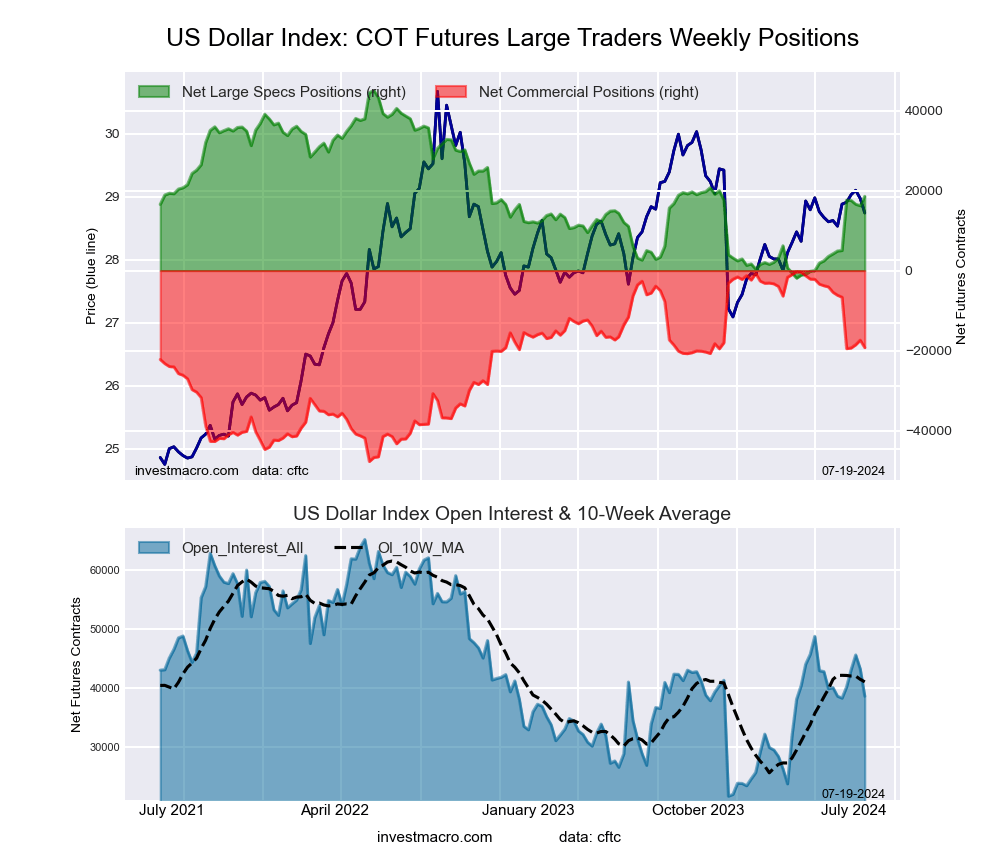 The US Dollar Index large speculator standing this week was a net position of 18,550 contracts in the data reported through Tuesday. This was a weekly rise of 2,342 contracts from the previous week which had a total of 16,208 net contracts.
This week’s current strength score (the trader positioning range over the past three years, measured from 0 to 100) shows the speculators are currently Bearish with a score of 43.6 percent. The commercials are Bullish with a score of 60.0 percent and the small traders (not shown in chart) are Bearish-Extreme with a score of 19.6 percent.
Price Trend-Following Model: Uptrend
Our weekly trend-following model classifies the current market price position as: Uptrend. The current action for the model is considered to be: Hold – Maintain Long Position.
| US DOLLAR INDEX Statistics | SPECULATORS | COMMERCIALS | SMALL TRADERS |
| – Percent of Open Interest Longs: | 78.5 | 9.6 | 8.1 |
| – Percent of Open Interest Shorts: | 30.5 | 59.4 | 6.2 |
| – Net Position: | 18,550 | -19,278 | 728 |
| – Gross Longs: | 30,327 | 3,695 | 3,141 |
| – Gross Shorts: | 11,777 | 22,973 | 2,413 |
| – Long to Short Ratio: | 2.6 to 1 | 0.2 to 1 | 1.3 to 1 |
| NET POSITION TREND: | |||
| – Strength Index Score (3 Year Range Pct): | 43.6 | 60.0 | 19.6 |
| – Strength Index Reading (3 Year Range): | Bearish | Bullish | Bearish-Extreme |
| NET POSITION MOVEMENT INDEX: | |||
| – 6-Week Change in Strength Index: | 29.1 | -27.6 | -6.6 |
Euro Currency Futures:
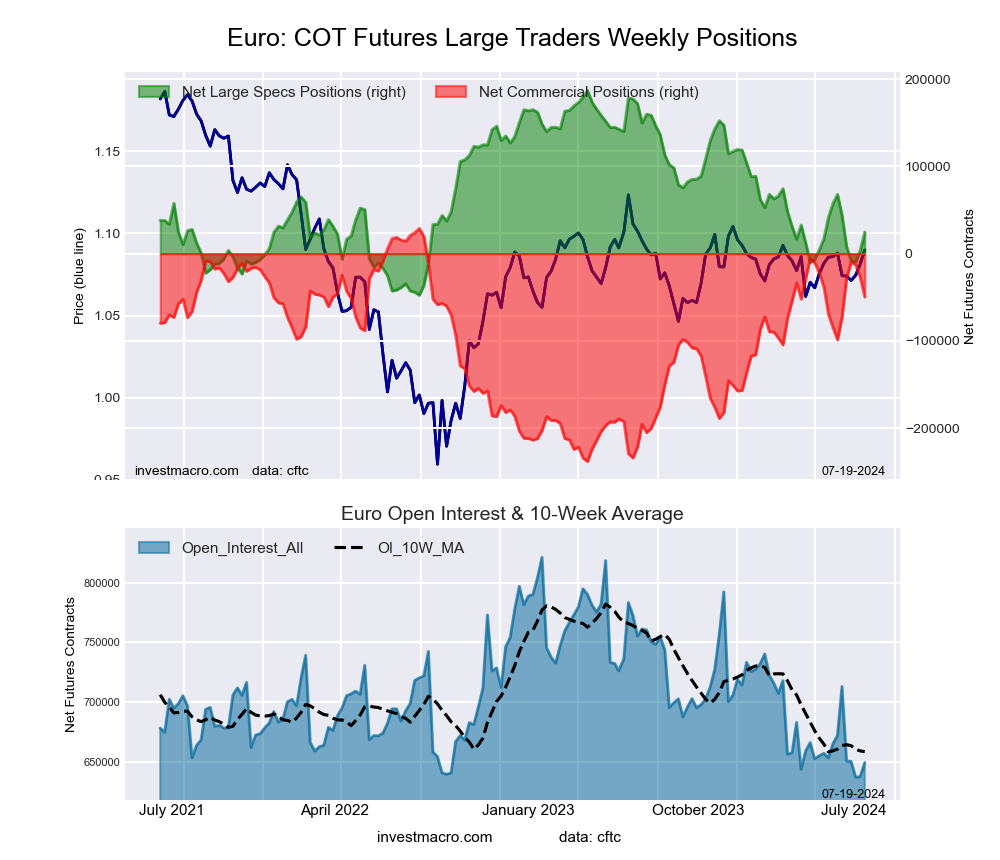 The Euro Currency large speculator standing this week was a net position of 24,749 contracts in the data reported through Tuesday. This was a weekly lift of 21,126 contracts from the previous week which had a total of 3,623 net contracts.
This week’s current strength score (the trader positioning range over the past three years, measured from 0 to 100) shows the speculators are currently Bearish with a score of 30.8 percent. The commercials are Bullish with a score of 70.7 percent and the small traders (not shown in chart) are Bearish with a score of 26.5 percent.
Price Trend-Following Model: Weak Downtrend
Our weekly trend-following model classifies the current market price position as: Weak Downtrend. The current action for the model is considered to be: Hold – Maintain Short Position.
| EURO Currency Statistics | SPECULATORS | COMMERCIALS | SMALL TRADERS |
| – Percent of Open Interest Longs: | 27.7 | 57.8 | 11.4 |
| – Percent of Open Interest Shorts: | 23.9 | 65.4 | 7.6 |
| – Net Position: | 24,749 | -49,549 | 24,800 |
| – Gross Longs: | 179,937 | 375,217 | 74,281 |
| – Gross Shorts: | 155,188 | 424,766 | 49,481 |
| – Long to Short Ratio: | 1.2 to 1 | 0.9 to 1 | 1.5 to 1 |
| NET POSITION TREND: | |||
| – Strength Index Score (3 Year Range Pct): | 30.8 | 70.7 | 26.5 |
| – Strength Index Reading (3 Year Range): | Bearish | Bullish | Bearish |
| NET POSITION MOVEMENT INDEX: | |||
| – 6-Week Change in Strength Index: | -18.4 | 18.4 | -13.9 |
British Pound Sterling Futures:
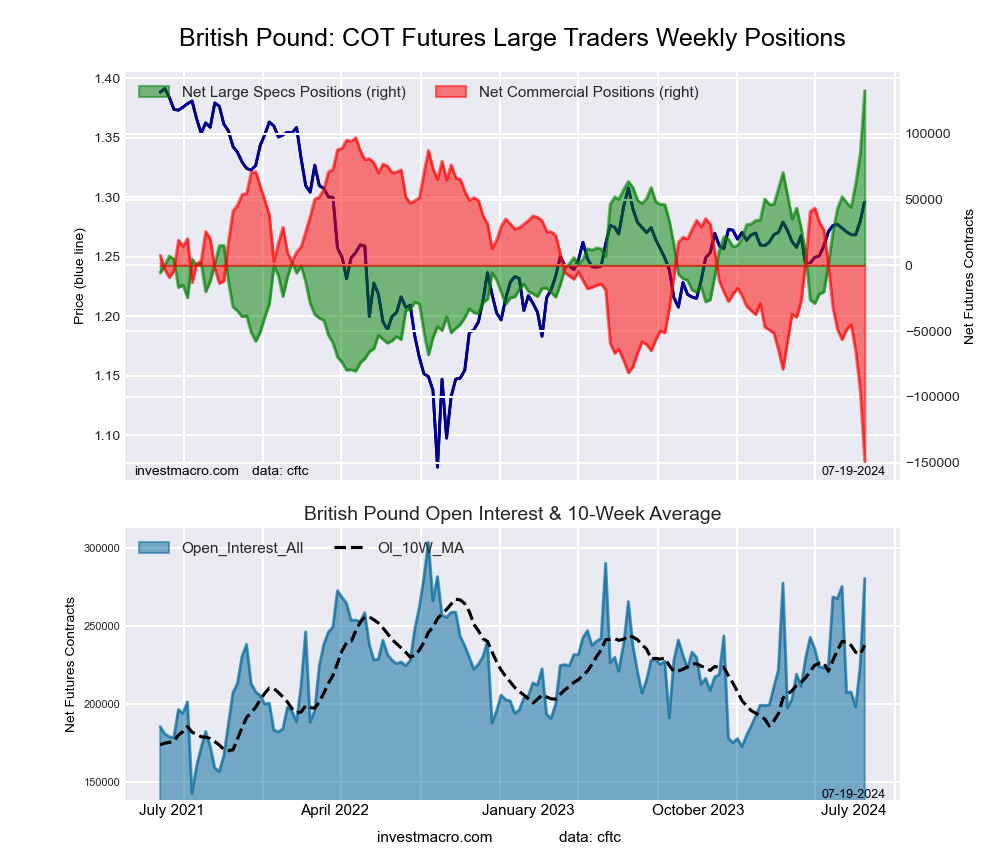 The British Pound Sterling large speculator standing this week was a net position of 132,902 contracts in the data reported through Tuesday. This was a weekly rise of 48,212 contracts from the previous week which had a total of 84,690 net contracts.
This week’s current strength score (the trader positioning range over the past three years, measured from 0 to 100) shows the speculators are currently Bullish-Extreme with a score of 100.0 percent. The commercials are Bearish-Extreme with a score of 0.0 percent and the small traders (not shown in chart) are Bullish-Extreme with a score of 96.3 percent.
Price Trend-Following Model: Strong Uptrend
Our weekly trend-following model classifies the current market price position as: Strong Uptrend. The current action for the model is considered to be: Hold – Maintain Long Position.
| BRITISH POUND Statistics | SPECULATORS | COMMERCIALS | SMALL TRADERS |
| – Percent of Open Interest Longs: | 65.3 | 18.1 | 14.3 |
| – Percent of Open Interest Shorts: | 18.0 | 71.2 | 8.5 |
| – Net Position: | 132,902 | -149,118 | 16,216 |
| – Gross Longs: | 183,287 | 50,803 | 40,067 |
| – Gross Shorts: | 50,385 | 199,921 | 23,851 |
| – Long to Short Ratio: | 3.6 to 1 | 0.3 to 1 | 1.7 to 1 |
| NET POSITION TREND: | |||
| – Strength Index Score (3 Year Range Pct): | 100.0 | 0.0 | 96.3 |
| – Strength Index Reading (3 Year Range): | Bullish-Extreme | Bearish-Extreme | Bullish-Extreme |
| NET POSITION MOVEMENT INDEX: | |||
| – 6-Week Change in Strength Index: | 42.1 | -40.8 | 22.4 |
Japanese Yen Futures:
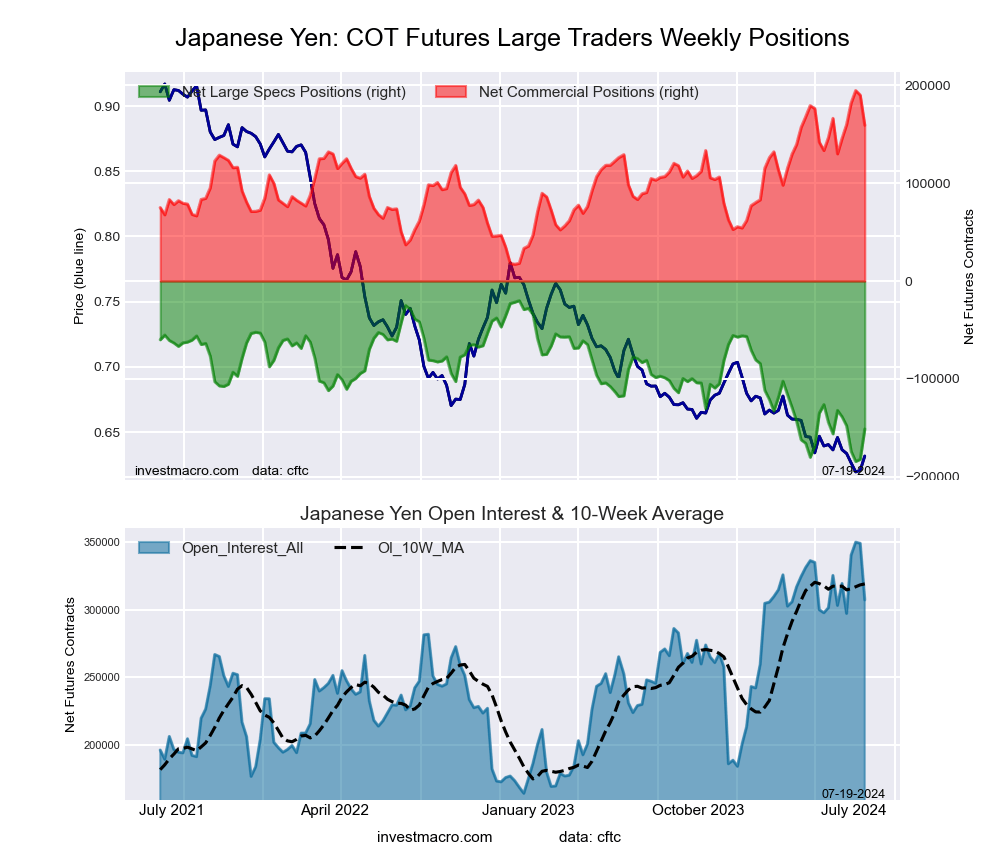 The Japanese Yen large speculator standing this week was a net position of -151,072 contracts in the data reported through Tuesday. This was a weekly gain of 30,961 contracts from the previous week which had a total of -182,033 net contracts.
This week’s current strength score (the trader positioning range over the past three years, measured from 0 to 100) shows the speculators are currently Bearish with a score of 20.2 percent. The commercials are Bullish-Extreme with a score of 80.0 percent and the small traders (not shown in chart) are Bullish with a score of 57.4 percent.
Price Trend-Following Model: Downtrend
Our weekly trend-following model classifies the current market price position as: Downtrend. The current action for the model is considered to be: Hold – Maintain Short Position.
| JAPANESE YEN Statistics | SPECULATORS | COMMERCIALS | SMALL TRADERS |
| – Percent of Open Interest Longs: | 15.4 | 70.3 | 12.2 |
| – Percent of Open Interest Shorts: | 64.6 | 18.5 | 14.9 |
| – Net Position: | -151,072 | 159,089 | -8,017 |
| – Gross Longs: | 47,356 | 216,042 | 37,613 |
| – Gross Shorts: | 198,428 | 56,953 | 45,630 |
| – Long to Short Ratio: | 0.2 to 1 | 3.8 to 1 | 0.8 to 1 |
| NET POSITION TREND: | |||
| – Strength Index Score (3 Year Range Pct): | 20.2 | 80.0 | 57.4 |
| – Strength Index Reading (3 Year Range): | Bearish | Bullish-Extreme | Bullish |
| NET POSITION MOVEMENT INDEX: | |||
| – 6-Week Change in Strength Index: | -11.6 | 16.5 | -32.1 |
Swiss Franc Futures:
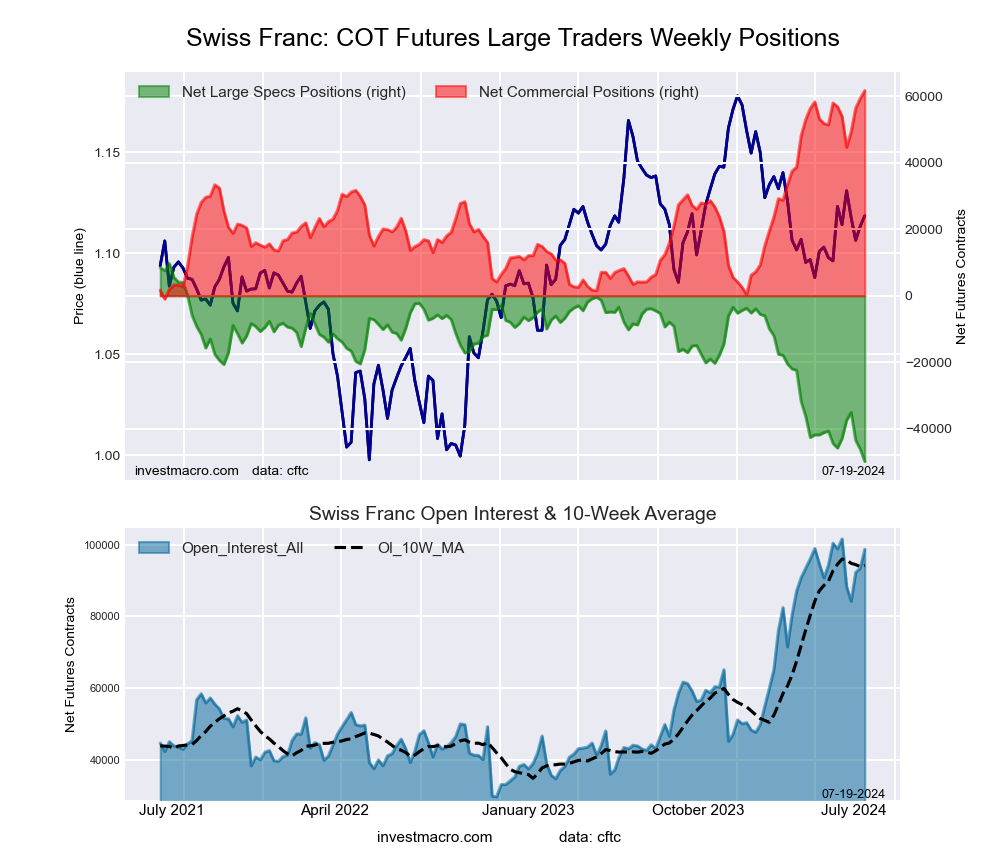 The Swiss Franc large speculator standing this week was a net position of -49,793 contracts in the data reported through Tuesday. This was a weekly reduction of -3,705 contracts from the previous week which had a total of -46,088 net contracts.
This week’s current strength score (the trader positioning range over the past three years, measured from 0 to 100) shows the speculators are currently Bearish-Extreme with a score of 0.0 percent. The commercials are Bullish-Extreme with a score of 100.0 percent and the small traders (not shown in chart) are Bearish with a score of 23.2 percent.
Price Trend-Following Model: Weak Downtrend
Our weekly trend-following model classifies the current market price position as: Weak Downtrend. The current action for the model is considered to be: Hold – Maintain Short Position.
| SWISS FRANC Statistics | SPECULATORS | COMMERCIALS | SMALL TRADERS |
| – Percent of Open Interest Longs: | 6.6 | 82.3 | 10.5 |
| – Percent of Open Interest Shorts: | 57.0 | 19.8 | 22.5 |
| – Net Position: | -49,793 | 61,672 | -11,879 |
| – Gross Longs: | 6,491 | 81,219 | 10,344 |
| – Gross Shorts: | 56,284 | 19,547 | 22,223 |
| – Long to Short Ratio: | 0.1 to 1 | 4.2 to 1 | 0.5 to 1 |
| NET POSITION TREND: | |||
| – Strength Index Score (3 Year Range Pct): | 0.0 | 100.0 | 23.2 |
| – Strength Index Reading (3 Year Range): | Bearish-Extreme | Bullish-Extreme | Bearish |
| NET POSITION MOVEMENT INDEX: | |||
| – 6-Week Change in Strength Index: | -6.8 | 7.7 | -3.7 |
Canadian Dollar Futures:
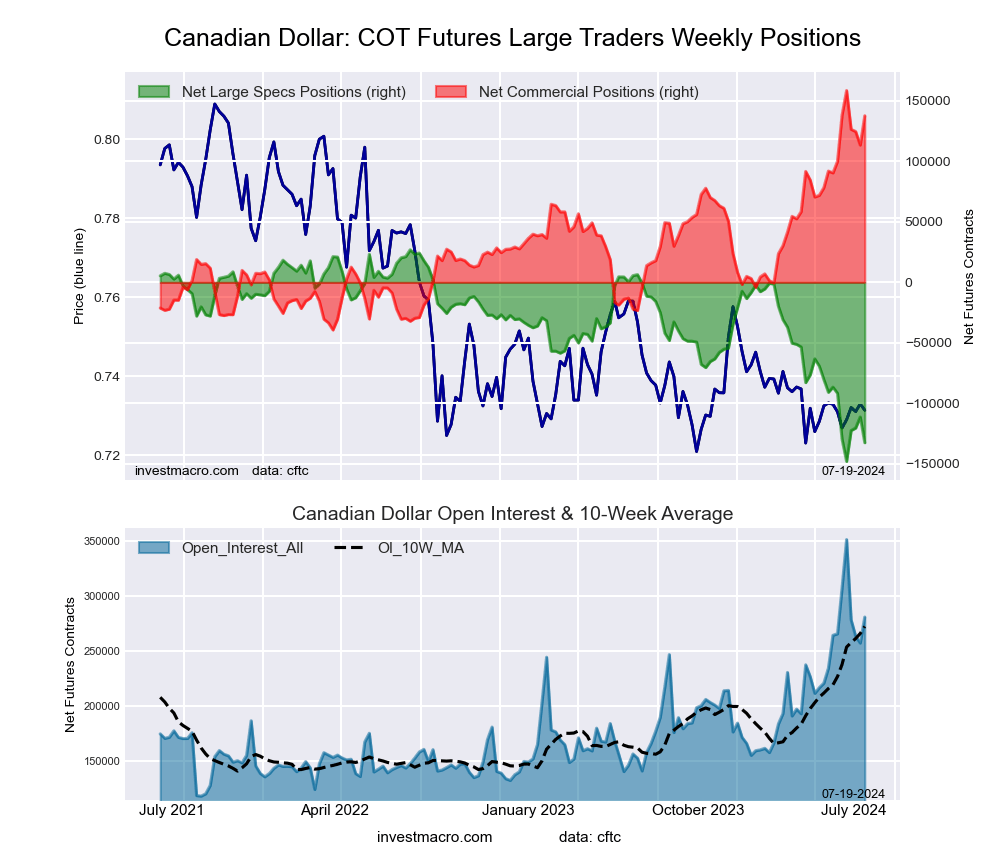 The Canadian Dollar large speculator standing this week was a net position of -132,473 contracts in the data reported through Tuesday. This was a weekly fall of -21,261 contracts from the previous week which had a total of -111,212 net contracts.
This week’s current strength score (the trader positioning range over the past three years, measured from 0 to 100) shows the speculators are currently Bearish-Extreme with a score of 8.8 percent. The commercials are Bullish-Extreme with a score of 89.5 percent and the small traders (not shown in chart) are Bearish-Extreme with a score of 15.7 percent.
Price Trend-Following Model: Strong Downtrend
Our weekly trend-following model classifies the current market price position as: Strong Downtrend. The current action for the model is considered to be: Hold – Maintain Short Position.
| CANADIAN DOLLAR Statistics | SPECULATORS | COMMERCIALS | SMALL TRADERS |
| – Percent of Open Interest Longs: | 8.8 | 78.0 | 10.3 |
| – Percent of Open Interest Shorts: | 56.0 | 29.0 | 12.1 |
| – Net Position: | -132,473 | 137,579 | -5,106 |
| – Gross Longs: | 24,734 | 219,027 | 29,000 |
| – Gross Shorts: | 157,207 | 81,448 | 34,106 |
| – Long to Short Ratio: | 0.2 to 1 | 2.7 to 1 | 0.9 to 1 |
| NET POSITION TREND: | |||
| – Strength Index Score (3 Year Range Pct): | 8.8 | 89.5 | 15.7 |
| – Strength Index Reading (3 Year Range): | Bearish-Extreme | Bullish-Extreme | Bearish-Extreme |
| NET POSITION MOVEMENT INDEX: | |||
| – 6-Week Change in Strength Index: | -23.4 | 19.1 | 9.3 |
Australian Dollar Futures:
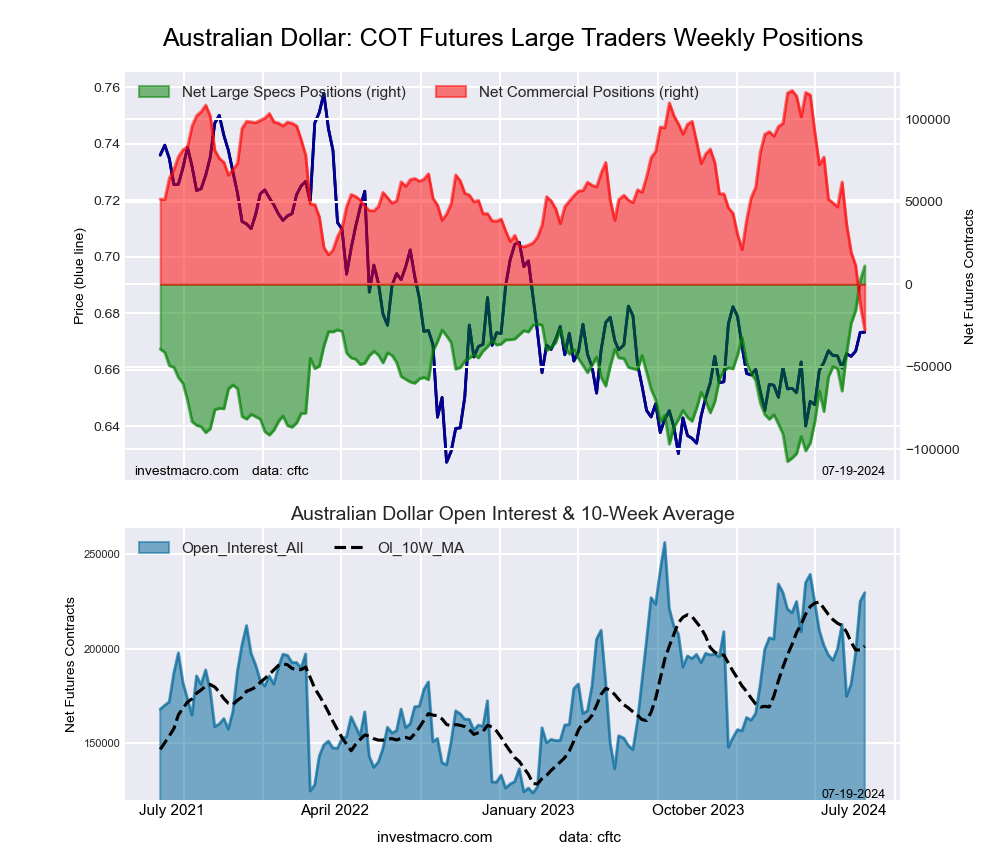 The Australian Dollar large speculator standing this week was a net position of 11,113 contracts in the data reported through Tuesday. This was a weekly gain of 8,700 contracts from the previous week which had a total of 2,413 net contracts.
This week’s current strength score (the trader positioning range over the past three years, measured from 0 to 100) shows the speculators are currently Bullish-Extreme with a score of 100.0 percent. The commercials are Bearish-Extreme with a score of 0.0 percent and the small traders (not shown in chart) are Bullish-Extreme with a score of 100.0 percent.
Price Trend-Following Model: Uptrend
Our weekly trend-following model classifies the current market price position as: Uptrend. The current action for the model is considered to be: Hold – Maintain Long Position.
| AUSTRALIAN DOLLAR Statistics | SPECULATORS | COMMERCIALS | SMALL TRADERS |
| – Percent of Open Interest Longs: | 46.3 | 36.8 | 14.9 |
| – Percent of Open Interest Shorts: | 41.5 | 48.9 | 7.6 |
| – Net Position: | 11,113 | -27,883 | 16,770 |
| – Gross Longs: | 106,312 | 84,403 | 34,164 |
| – Gross Shorts: | 95,199 | 112,286 | 17,394 |
| – Long to Short Ratio: | 1.1 to 1 | 0.8 to 1 | 2.0 to 1 |
| NET POSITION TREND: | |||
| – Strength Index Score (3 Year Range Pct): | 100.0 | 0.0 | 100.0 |
| – Strength Index Reading (3 Year Range): | Bullish-Extreme | Bearish-Extreme | Bullish-Extreme |
| NET POSITION MOVEMENT INDEX: | |||
| – 6-Week Change in Strength Index: | 52.6 | -51.4 | 32.4 |
New Zealand Dollar Futures:
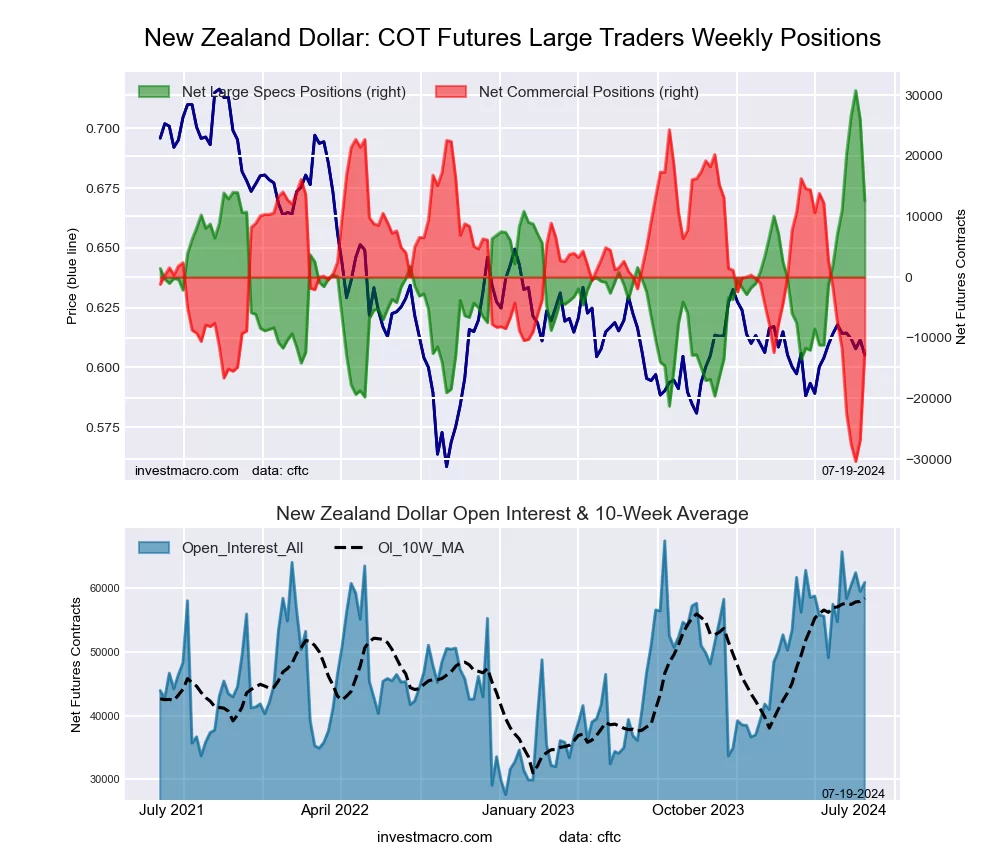 The New Zealand Dollar large speculator standing this week was a net position of 12,561 contracts in the data reported through Tuesday. This was a weekly decrease of -13,351 contracts from the previous week which had a total of 25,912 net contracts.
This week’s current strength score (the trader positioning range over the past three years, measured from 0 to 100) shows the speculators are currently Bullish with a score of 65.0 percent. The commercials are Bearish with a score of 33.4 percent and the small traders (not shown in chart) are Bullish with a score of 52.1 percent.
Price Trend-Following Model: Weak Uptrend
Our weekly trend-following model classifies the current market price position as: Weak Uptrend. The current action for the model is considered to be: Hold – Maintain Long Position.
| NEW ZEALAND DOLLAR Statistics | SPECULATORS | COMMERCIALS | SMALL TRADERS |
| – Percent of Open Interest Longs: | 56.6 | 32.0 | 7.6 |
| – Percent of Open Interest Shorts: | 35.9 | 51.8 | 8.4 |
| – Net Position: | 12,561 | -12,102 | -459 |
| – Gross Longs: | 34,473 | 19,484 | 4,648 |
| – Gross Shorts: | 21,912 | 31,586 | 5,107 |
| – Long to Short Ratio: | 1.6 to 1 | 0.6 to 1 | 0.9 to 1 |
| NET POSITION TREND: | |||
| – Strength Index Score (3 Year Range Pct): | 65.0 | 33.4 | 52.1 |
| – Strength Index Reading (3 Year Range): | Bullish | Bearish | Bullish |
| NET POSITION MOVEMENT INDEX: | |||
| – 6-Week Change in Strength Index: | 10.3 | -8.1 | -12.8 |
Mexican Peso Futures:
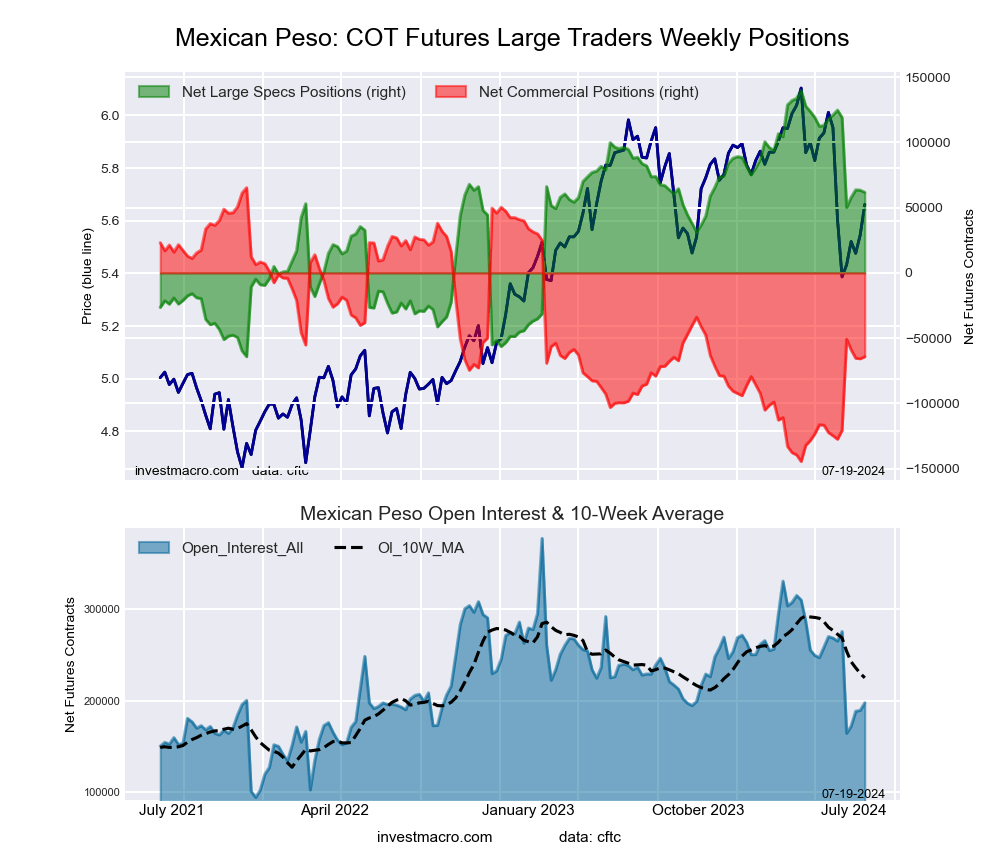 The Mexican Peso large speculator standing this week was a net position of 61,710 contracts in the data reported through Tuesday. This was a weekly reduction of -1,613 contracts from the previous week which had a total of 63,323 net contracts.
This week’s current strength score (the trader positioning range over the past three years, measured from 0 to 100) shows the speculators are currently Bullish with a score of 61.7 percent. The commercials are Bearish with a score of 38.3 percent and the small traders (not shown in chart) are Bearish with a score of 26.9 percent.
Price Trend-Following Model: Downtrend
Our weekly trend-following model classifies the current market price position as: Downtrend. The current action for the model is considered to be: Hold – Maintain Short Position.
| MEXICAN PESO Statistics | SPECULATORS | COMMERCIALS | SMALL TRADERS |
| – Percent of Open Interest Longs: | 49.9 | 46.5 | 2.9 |
| – Percent of Open Interest Shorts: | 18.6 | 79.0 | 1.7 |
| – Net Position: | 61,710 | -64,182 | 2,472 |
| – Gross Longs: | 98,495 | 91,866 | 5,742 |
| – Gross Shorts: | 36,785 | 156,048 | 3,270 |
| – Long to Short Ratio: | 2.7 to 1 | 0.6 to 1 | 1.8 to 1 |
| NET POSITION TREND: | |||
| – Strength Index Score (3 Year Range Pct): | 61.7 | 38.3 | 26.9 |
| – Strength Index Reading (3 Year Range): | Bullish | Bearish | Bearish |
| NET POSITION MOVEMENT INDEX: | |||
| – 6-Week Change in Strength Index: | -30.9 | 30.2 | -1.7 |
Brazilian Real Futures:
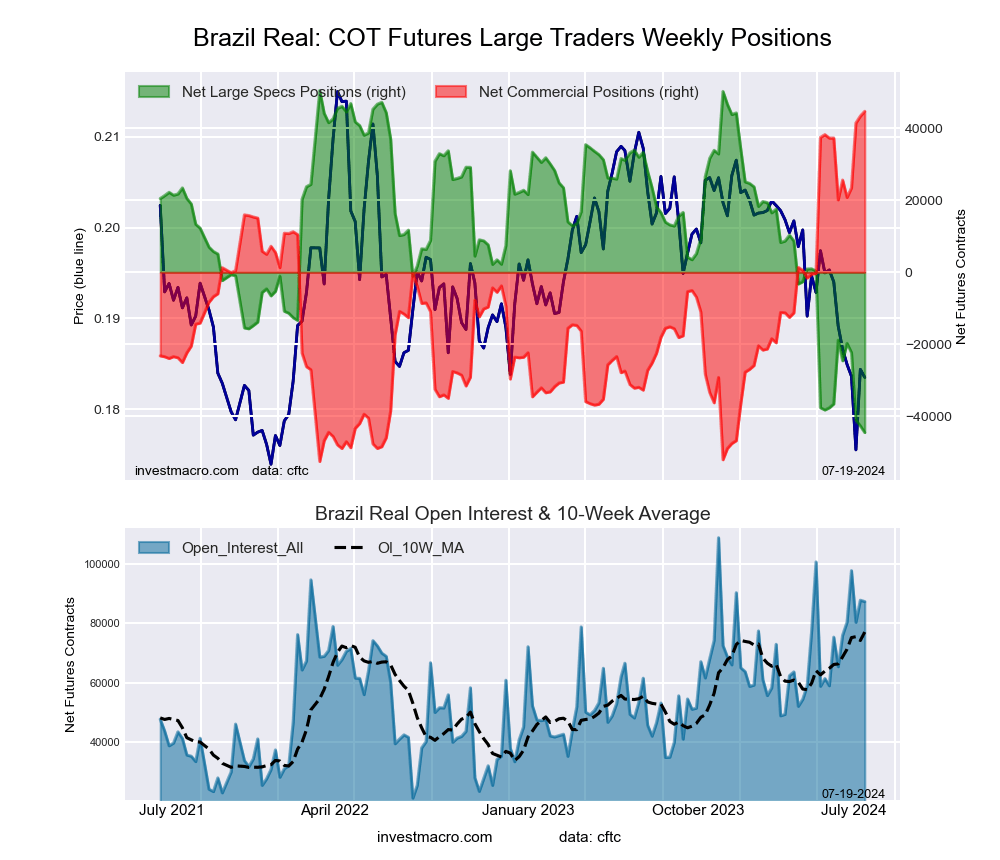 The Brazilian Real large speculator standing this week was a net position of -44,526 contracts in the data reported through Tuesday. This was a weekly lowering of -1,842 contracts from the previous week which had a total of -42,684 net contracts.
This week’s current strength score (the trader positioning range over the past three years, measured from 0 to 100) shows the speculators are currently Bearish-Extreme with a score of 0.0 percent. The commercials are Bullish-Extreme with a score of 100.0 percent and the small traders (not shown in chart) are Bearish with a score of 32.6 percent.
Price Trend-Following Model: Strong Downtrend
Our weekly trend-following model classifies the current market price position as: Strong Downtrend. The current action for the model is considered to be: Hold – Maintain Short Position.
| BRAZIL REAL Statistics | SPECULATORS | COMMERCIALS | SMALL TRADERS |
| – Percent of Open Interest Longs: | 24.2 | 72.5 | 2.6 |
| – Percent of Open Interest Shorts: | 75.2 | 21.3 | 2.8 |
| – Net Position: | -44,526 | 44,720 | -194 |
| – Gross Longs: | 21,140 | 63,287 | 2,240 |
| – Gross Shorts: | 65,666 | 18,567 | 2,434 |
| – Long to Short Ratio: | 0.3 to 1 | 3.4 to 1 | 0.9 to 1 |
| NET POSITION TREND: | |||
| – Strength Index Score (3 Year Range Pct): | 0.0 | 100.0 | 32.6 |
| – Strength Index Reading (3 Year Range): | Bearish-Extreme | Bullish-Extreme | Bearish |
| NET POSITION MOVEMENT INDEX: | |||
| – 6-Week Change in Strength Index: | -27.0 | 25.3 | 10.0 |
Bitcoin Futures:
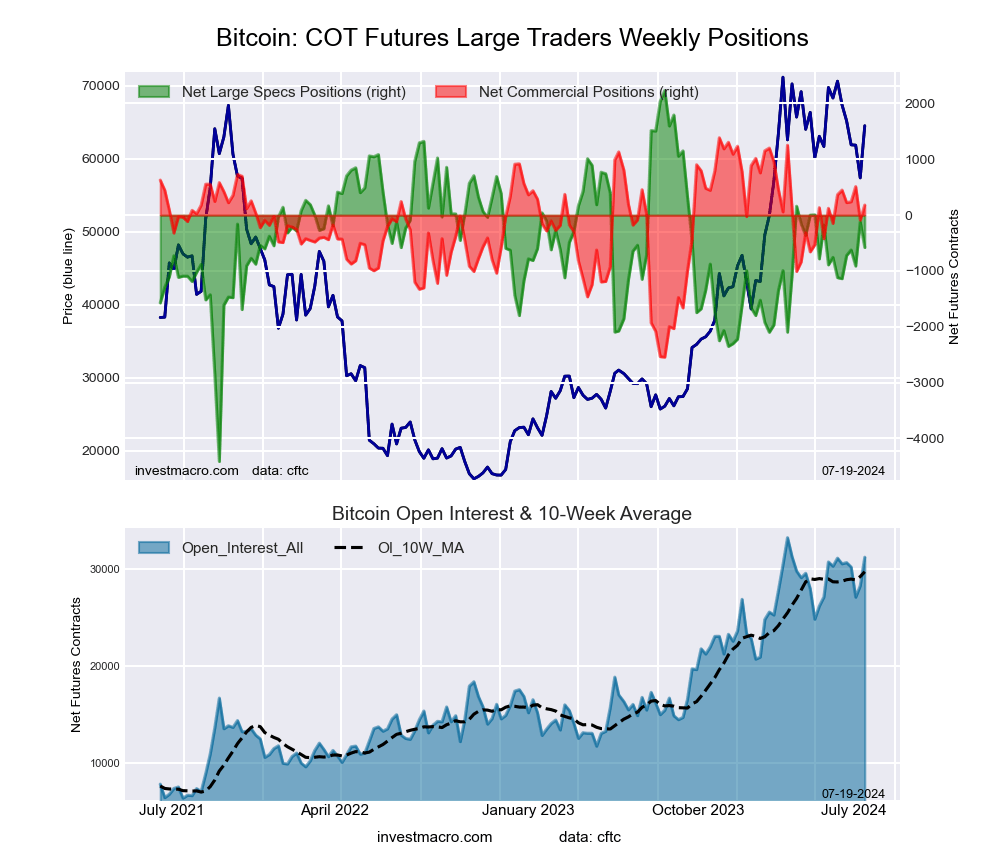 The Bitcoin large speculator standing this week was a net position of -579 contracts in the data reported through Tuesday. This was a weekly decrease of -461 contracts from the previous week which had a total of -118 net contracts.
This week’s current strength score (the trader positioning range over the past three years, measured from 0 to 100) shows the speculators are currently Bullish with a score of 57.7 percent. The commercials are Bullish with a score of 69.3 percent and the small traders (not shown in chart) are Bearish with a score of 22.0 percent.
Price Trend-Following Model: Weak Downtrend
Our weekly trend-following model classifies the current market price position as: Weak Downtrend. The current action for the model is considered to be: Hold – Maintain Short Position.
| BITCOIN Statistics | SPECULATORS | COMMERCIALS | SMALL TRADERS |
| – Percent of Open Interest Longs: | 79.2 | 3.5 | 4.7 |
| – Percent of Open Interest Shorts: | 81.1 | 2.9 | 3.4 |
| – Net Position: | -579 | 181 | 398 |
| – Gross Longs: | 24,710 | 1,091 | 1,463 |
| – Gross Shorts: | 25,289 | 910 | 1,065 |
| – Long to Short Ratio: | 1.0 to 1 | 1.2 to 1 | 1.4 to 1 |
| NET POSITION TREND: | |||
| – Strength Index Score (3 Year Range Pct): | 57.7 | 69.3 | 22.0 |
| – Strength Index Reading (3 Year Range): | Bullish | Bullish | Bearish |
| NET POSITION MOVEMENT INDEX: | |||
| – 6-Week Change in Strength Index: | 8.1 | -4.7 | -8.1 |
Article By InvestMacro – Receive our weekly COT Newsletter
*COT Report: The COT data, released weekly to the public each Friday, is updated through the most recent Tuesday (data is 3 days old) and shows a quick view of how large speculators or non-commercials (for-profit traders) were positioned in the futures markets.
The CFTC categorizes trader positions according to commercial hedgers (traders who use futures contracts for hedging as part of the business), non-commercials (large traders who speculate to realize trading profits) and nonreportable traders (usually small traders/speculators) as well as their open interest (contracts open in the market at time of reporting). See CFTC criteria here.