By JustMarkets
At the end of Tuesday, the Dow Jones Index (US30) decreased by 1.25%, while the S&P 500 Index (US500) was down 2.31%. The NASDAQ Technology Index (US100) closed negative 3.64%. Stocks fell yesterday amid disappointing earnings from Tesla and Google and weakness in chip maker stocks. Next week, companies such as Microsoft (MSFT) will report on Tuesday, Meta (META) on Wednesday, and Apple (AAPL) and Amazon (AMZN) on Thursday. Nvidia (NVDA) is expected to report earnings on August 28. The stock market is also concerned about the outlook for corporate earnings after the election. Vice President Kamala Harris performs better than President Biden and appears to have a better chance of defeating Donald Trump.
The market consensus expects second-quarter earnings for S&P 500 companies to rise 9% YoY. About a quarter of the companies in the S&P 500 have already reported, and most of them beat earnings forecasts.
The US economic reports released on Wednesday were weak and negative for the US economy, although they were at least dovish for Fed policy. S&P’s preliminary US manufacturing PMI for July fell 2.1 points to 49.5, much weaker than expectations of an unchanged 51.6. The US manufacturing PMI fell below the 50.0 level for the first time since December 2023, indicating weakness in the US manufacturing sector.
As some of the markets expected, the Bank of Canada (BoC) cut its key interest rate by 25 bps to 4.5% at its July 2024 meeting, extending the 25 bps rate cut from the June meeting. The Bank of Canada’s Board of Governors noted that oversupply in the Canadian economy has helped slow inflation in recent months, justifying a looser monetary policy. The central bank also noted that, combined with indicators suggesting excess supply, lower interest rates could help slow mortgage and housing cost growth, contributing most to inflation.
Equity markets in Europe were declining yesterday. Germany’s DAX (DE40) fell 0.92%, France’s CAC 40 (FR40) closed down 1.12%, Spain’s IBEX 35 (ES35) lost 0.02%, and the UK’s FTSE 100 (UK100) closed negative 0.17% on Wednesday. European equity markets opened lower on Thursday, following a global equity sell-off as disappointing earnings reports from mega-large tech companies in the US triggered massive sell-offs. On the corporate front, earnings are expected from Nestle, Roche, AstraZeneca, Sanofi, and Stellantis, among others.
The preliminary Eurozone manufacturing PMI for July fell 0.2 points to 45.6, weaker than expectations for a 0.3 point increase to 46.1. The preliminary Eurozone Services PMI for July fell 0.9 points to 51.9, weaker than expectations for a 0.1 point increase to 52.9.
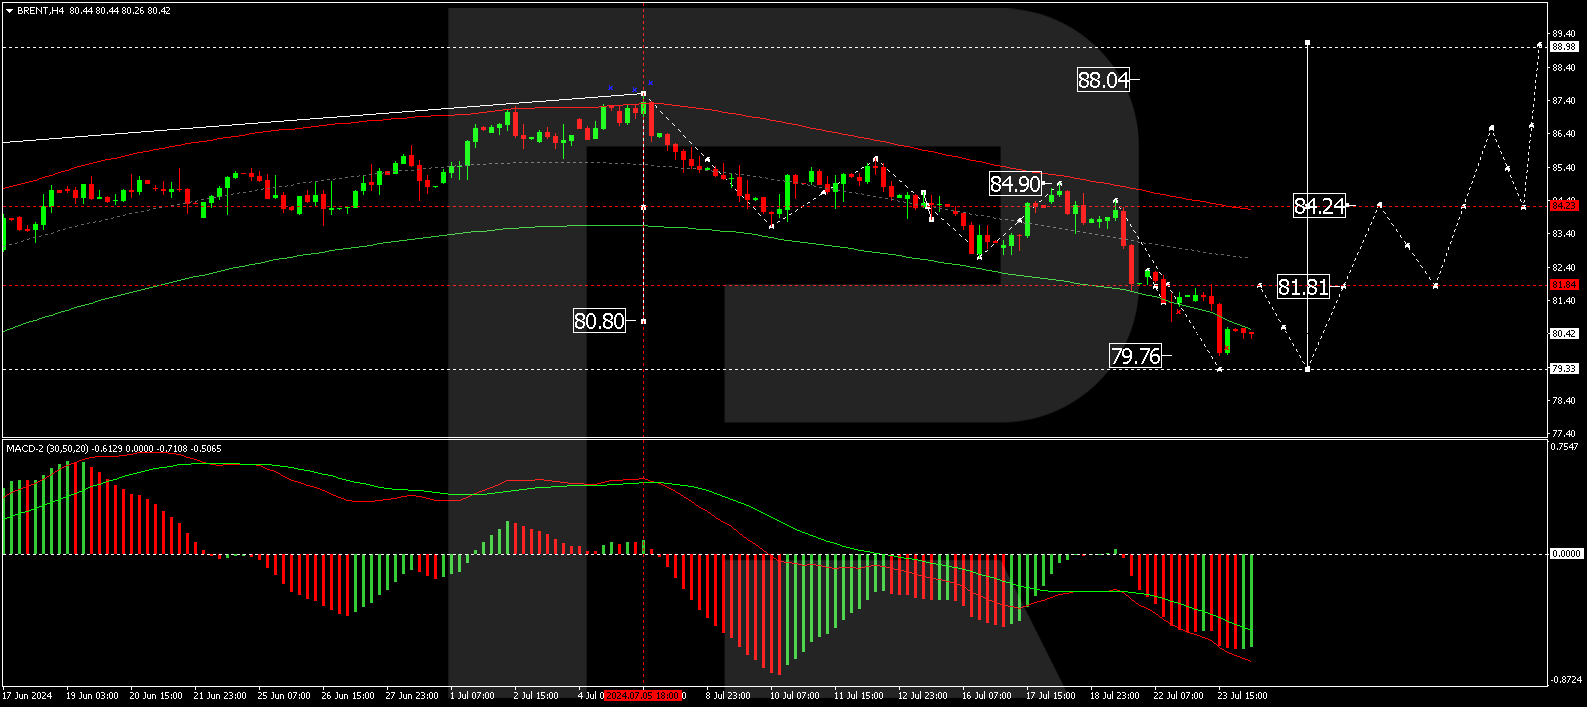
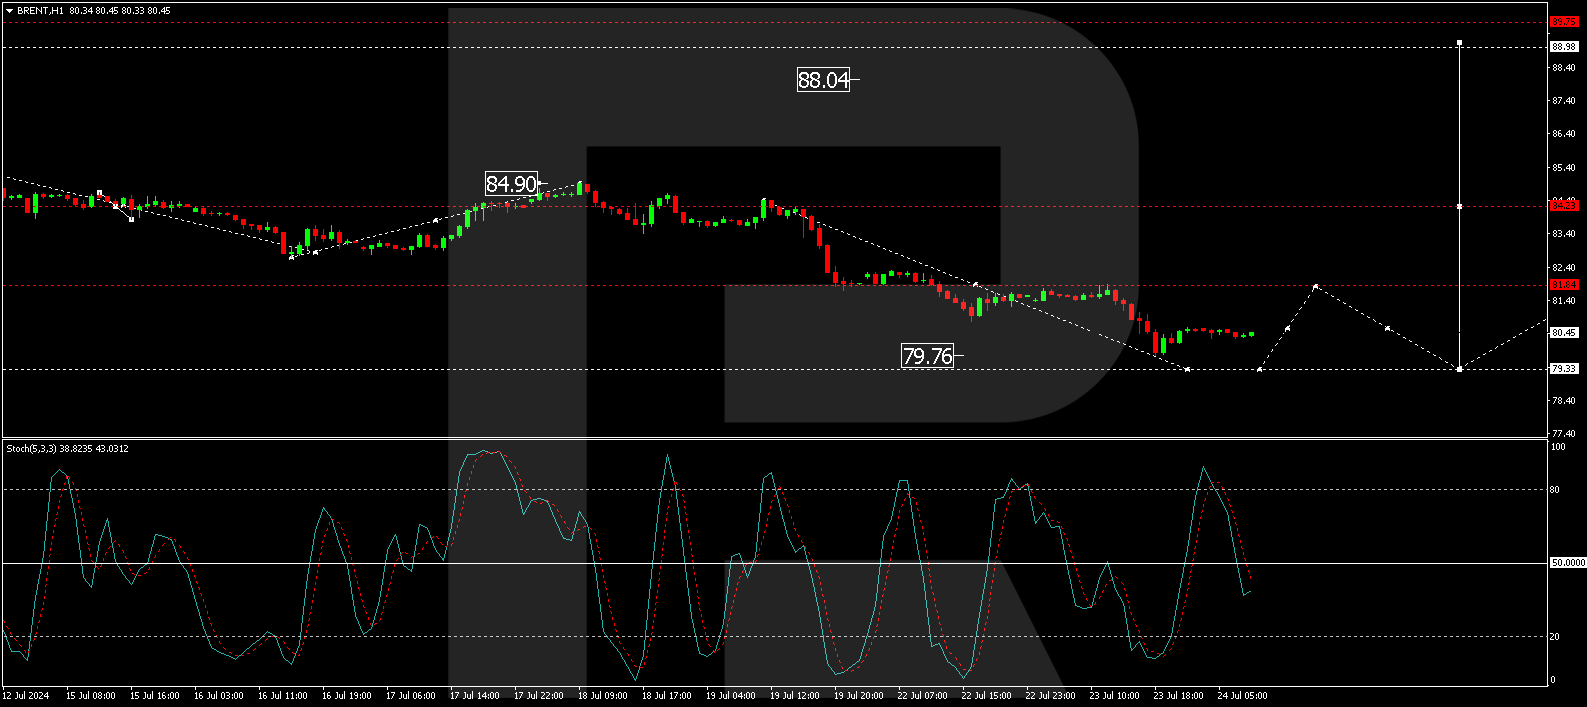
WTI crude oil prices fell to $77 per barrel on Thursday, hitting their lowest since early June, as the prevailing negative sentiment in global stock markets put pressure on risk assets. In addition, the prospects of an impending ceasefire agreement between Israel and Hamas brokered by Egypt, Qatar, and the US put downward pressure on oil prices. Meanwhile, EIA data showed a 3.74 million barrel decline in inventories last week, the fourth consecutive decline, exceeding forecasts for a 2.05 million barrel drop.
Asian markets were predominantly down yesterday. Japan’s Nikkei 225 (JP225) fell 1.11%, China’s FTSE China A50 (CHA50) declined 0.32%, Hong Kong’s Hang Seng (HK50) lost 0.91%, and Australia’s ASX 200 (AU200) was negative 0.09%. Asian equity markets fell sharply on Thursday, following losses on Wall Street overnight, as disappointing earnings from mega-large companies triggered a sell-off in technology and artificial intelligence stocks. Japanese stocks led the decline in regional markets, which were also pressured by a rising yen amid bets of a Bank of Japan rate hike next week.
The People’s Bank of China (PBOC) unexpectedly cut its one-year lending rate, known as the medium-term lending facility (MLF), by 20 bps to 2.3% from 2.5% on July 25. It was the first cut in almost a year and the biggest since April 2020. The central bank stepped up support for the weakening economy following the Third Plenum in mid-July, weaker-than-expected second-quarter GDP data, and mixed economic data in June just days after cutting the key short-term rate.
S&P 500 (US500) 5,427.13 −128.61 (−2.31%)
Dow Jones (US30) 39,853.87 −504.22 (−1.25%)
DAX (DE40) 18,387.46 −170.24 (−0.92%)
FTSE 100 (UK100) 8,153.69 −13.68 (−0.17%)
USD Index 104.33 -0.12 (-0.12%)
Important events today:
- – German Ifo Business Climate (m/m) at 11:00 (GMT+3);
- – US Core Durable Goods Orders (m/m) at 15:30 (GMT+3);
- – US GDP (q/q) at 15:30 (GMT+3);
- – US Initial Jobless Claims (w/w) at 15:30 (GMT+3);
- – US Natural Gas Storage (w/w) at 17:30 (GMT+3);
- – Eurozone ECB President Lagarde Speaks at 18:00 (GMT+3).
By JustMarkets
This article reflects a personal opinion and should not be interpreted as an investment advice, and/or offer, and/or a persistent request for carrying out financial transactions, and/or a guarantee, and/or a forecast of future events.