By InvestMacro
Here are the latest charts and statistics for the Commitment of Traders (COT) reports data published by the Commodities Futures Trading Commission (CFTC).
The latest COT data is updated through Tuesday August 20th and shows a quick view of how large traders (for-profit speculators and commercial hedgers) were positioned in the futures markets.
Weekly Speculator Changes led by Ultra Treasury Bonds & Ultra 10-Year Bonds
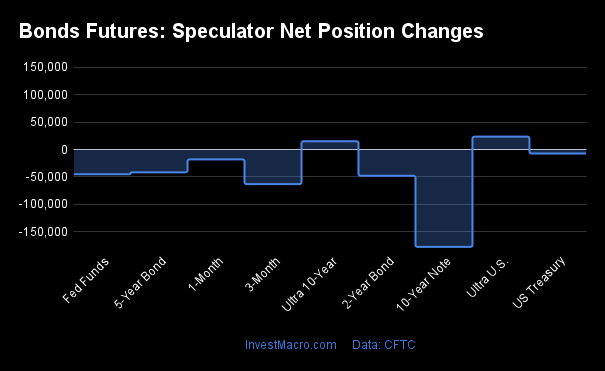
The COT bond market speculator bets were lower this week as just two out of the eight bond markets we cover had higher positioning while the other six markets had lower speculator contracts.
Leading the gains for the bond markets was the Ultra Treasury Bonds (23,519 contracts) with the Ultra 10-Year Bonds (15,073 contracts) also showing a positive week.
The bond markets with declines in speculator bets for the week were the 10-Year Bonds (-177,869 contracts), the SOFR 3-Months (-63,211 contracts), the 2-Year Bonds (-47,974 contracts), the Fed Funds (-45,221 contracts), the 5-Year Bonds (-41,738 contracts) and with the US Treasury Bonds (-7,165 contracts) also registering lower bets on the week.
Bonds Net Speculators Leaderboard
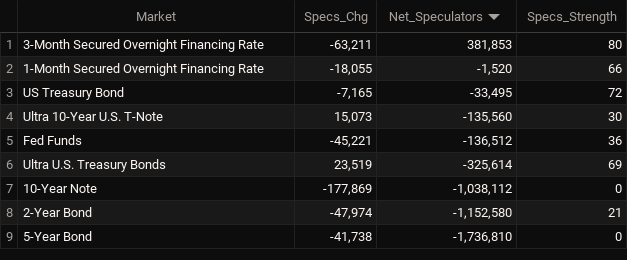
Legend: Weekly Speculators Change | Speculators Current Net Position | Speculators Strength Score compared to last 3-Years (0-100 range)
Strength Scores led by SOFR 3-Months & US Treasury Bonds
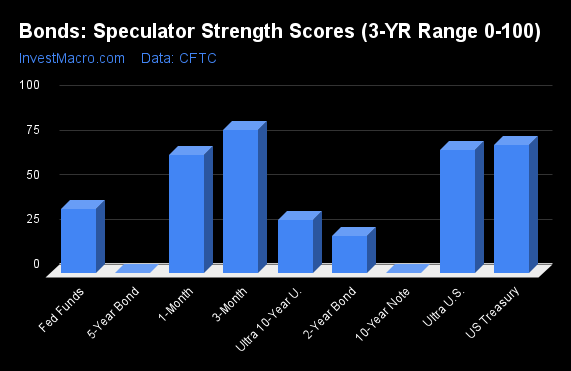
COT Strength Scores (a normalized measure of Speculator positions over a 3-Year range, from 0 to 100 where above 80 is Extreme-Bullish and below 20 is Extreme-Bearish) showed that the SOFR 3-Months (80 percent) and the US Treasury Bonds (72 percent) lead the bond markets this week. The Ultra Treasury Bonds (69 percent) comes in as the next highest in the weekly strength scores.
On the downside, the 5-Year Bonds (0 percent) and the 10-Year Bonds (0 percent) come in at the lowest strength level currently and are in Extreme-Bearish territory (below 20 percent). The next lowest strength scores were the 2-Year Bonds (21 percent) and the Ultra 10-Year Bonds (30 percent).
Strength Statistics:
Fed Funds (35.9 percent) vs Fed Funds previous week (46.2 percent)
2-Year Bond (20.7 percent) vs 2-Year Bond previous week (23.8 percent)
5-Year Bond (0.0 percent) vs 5-Year Bond previous week (2.4 percent)
10-Year Bond (0.0 percent) vs 10-Year Bond previous week (14.6 percent)
Ultra 10-Year Bond (29.7 percent) vs Ultra 10-Year Bond previous week (26.5 percent)
US Treasury Bond (71.8 percent) vs US Treasury Bond previous week (74.3 percent)
Ultra US Treasury Bond (68.8 percent) vs Ultra US Treasury Bond previous week (56.4 percent)
SOFR 3-Months (80.0 percent) vs SOFR 3-Months previous week (83.3 percent)
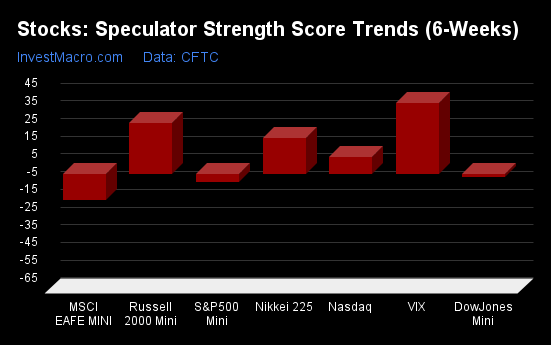
Ultra Treasury Bonds & SOFR 3-Months top the 6-Week Strength Trends
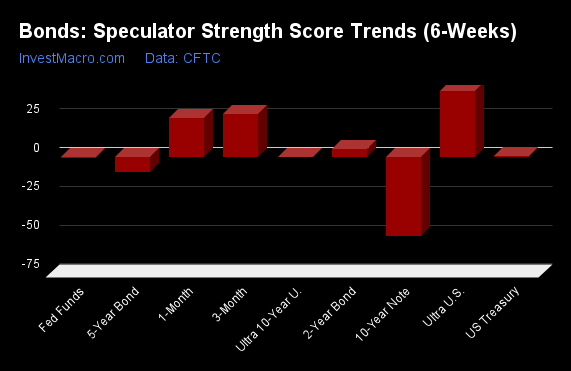
COT Strength Score Trends (or move index, calculates the 6-week changes in strength scores) showed that the Ultra Treasury Bonds (42 percent) and the SOFR 3-Months (27 percent) lead the past six weeks trends for bonds. The 2-Year Bonds (5 percent) and the are the next highest positive movers in the latest trends data.
The 10-Year Bonds (-51 percent) leads the downside trend scores currently with the 5-Year Bonds (-10 percent) and the Fed Funds (-1 percent) following next with lower trend scores.
Strength Trend Statistics:
Fed Funds (-0.7 percent) vs Fed Funds previous week (15.5 percent)
2-Year Bond (5.1 percent) vs 2-Year Bond previous week (7.4 percent)
5-Year Bond (-9.9 percent) vs 5-Year Bond previous week (-9.2 percent)
10-Year Bond (-50.9 percent) vs 10-Year Bond previous week (-42.2 percent)
Ultra 10-Year Bond (-0.5 percent) vs Ultra 10-Year Bond previous week (0.3 percent)
US Treasury Bond (0.3 percent) vs US Treasury Bond previous week (-1.6 percent)
Ultra US Treasury Bond (42.2 percent) vs Ultra US Treasury Bond previous week (23.2 percent)
SOFR 3-Months (27.5 percent) vs SOFR 3-Months previous week (36.5 percent)
Secured Overnight Financing Rate (3-Month) Futures:
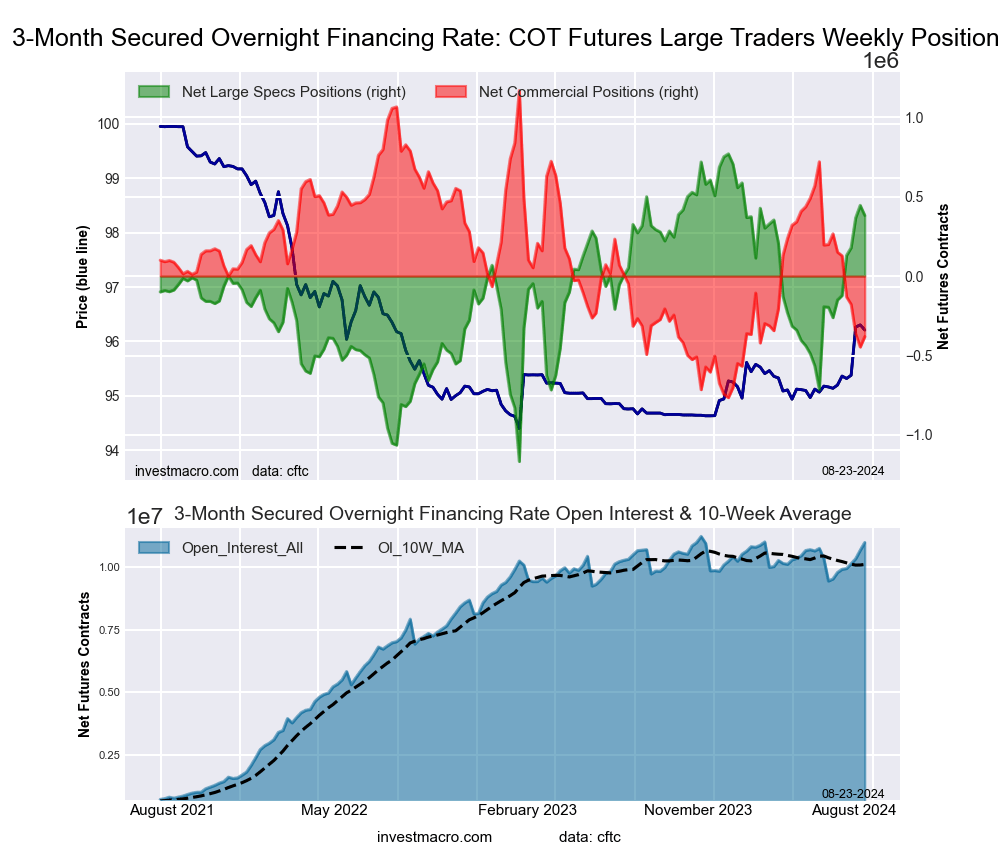 The Secured Overnight Financing Rate (3-Month) large speculator standing this week was a net position of 381,853 contracts in the data reported through Tuesday. This was a weekly reduction of -63,211 contracts from the previous week which had a total of 445,064 net contracts.
This week’s current strength score (the trader positioning range over the past three years, measured from 0 to 100) shows the speculators are currently Bullish with a score of 80.0 percent. The commercials are Bearish-Extreme with a score of 19.9 percent and the small traders (not shown in chart) are Bullish-Extreme with a score of 87.2 percent.
Price Trend-Following Model: Weak Uptrend
Our weekly trend-following model classifies the current market price position as: Weak Uptrend. The current action for the model is considered to be: Hold – Maintain Long Position.
| SOFR 3-Months Statistics | SPECULATORS | COMMERCIALS | SMALL TRADERS |
| – Percent of Open Interest Longs: | 15.4 | 55.2 | 0.4 |
| – Percent of Open Interest Shorts: | 11.9 | 58.7 | 0.4 |
| – Net Position: | 381,853 | -380,583 | -1,270 |
| – Gross Longs: | 1,686,980 | 6,061,551 | 38,761 |
| – Gross Shorts: | 1,305,127 | 6,442,134 | 40,031 |
| – Long to Short Ratio: | 1.3 to 1 | 0.9 to 1 | 1.0 to 1 |
| NET POSITION TREND: | |||
| – Strength Index Score (3 Year Range Pct): | 80.0 | 19.9 | 87.2 |
| – Strength Index Reading (3 Year Range): | Bullish | Bearish-Extreme | Bullish-Extreme |
| NET POSITION MOVEMENT INDEX: | |||
| – 6-Week Change in Strength Index: | 27.5 | -27.5 | -0.6 |
30-Day Federal Funds Futures:
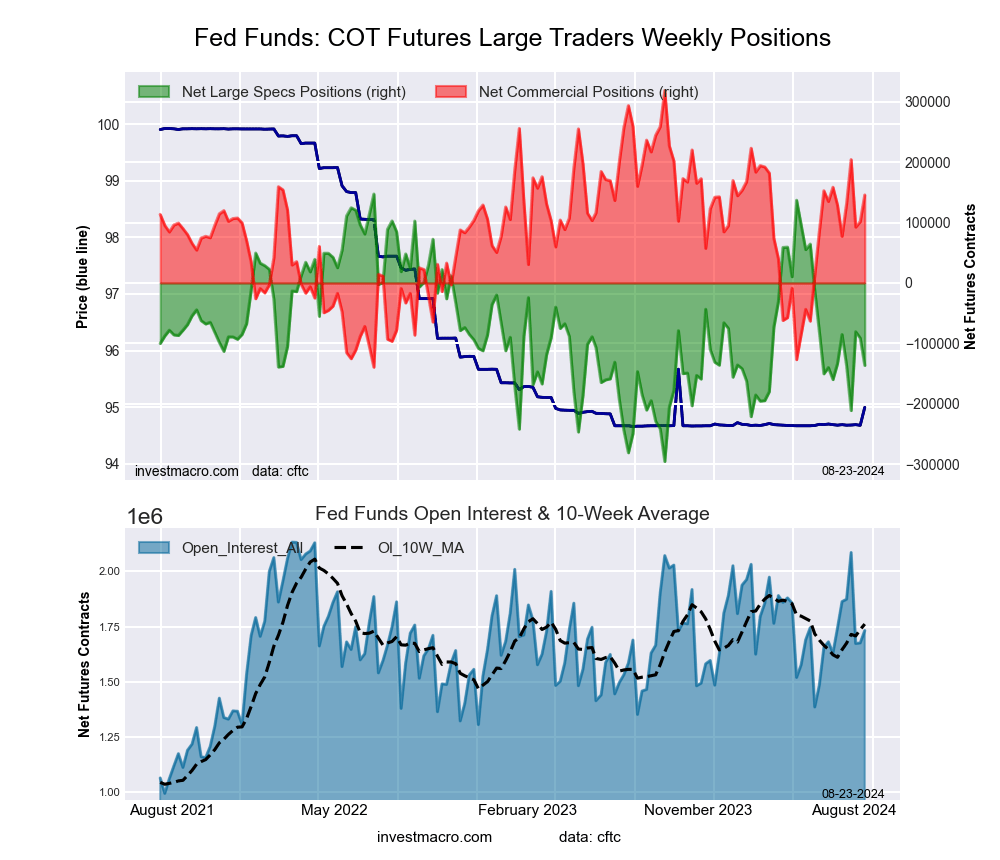 The 30-Day Federal Funds large speculator standing this week was a net position of -136,512 contracts in the data reported through Tuesday. This was a weekly decline of -45,221 contracts from the previous week which had a total of -91,291 net contracts.
This week’s current strength score (the trader positioning range over the past three years, measured from 0 to 100) shows the speculators are currently Bearish with a score of 35.9 percent. The commercials are Bullish with a score of 62.2 percent and the small traders (not shown in chart) are Bullish with a score of 68.4 percent.
Price Trend-Following Model: Downtrend
Our weekly trend-following model classifies the current market price position as: Downtrend. The current action for the model is considered to be: Hold – Maintain Short Position.
| 30-Day Federal Funds Statistics | SPECULATORS | COMMERCIALS | SMALL TRADERS |
| – Percent of Open Interest Longs: | 8.5 | 75.3 | 1.7 |
| – Percent of Open Interest Shorts: | 16.4 | 66.9 | 2.2 |
| – Net Position: | -136,512 | 145,612 | -9,100 |
| – Gross Longs: | 147,009 | 1,304,235 | 28,950 |
| – Gross Shorts: | 283,521 | 1,158,623 | 38,050 |
| – Long to Short Ratio: | 0.5 to 1 | 1.1 to 1 | 0.8 to 1 |
| NET POSITION TREND: | |||
| – Strength Index Score (3 Year Range Pct): | 35.9 | 62.2 | 68.4 |
| – Strength Index Reading (3 Year Range): | Bearish | Bullish | Bullish |
| NET POSITION MOVEMENT INDEX: | |||
| – 6-Week Change in Strength Index: | -0.7 | 3.7 | -25.6 |
2-Year Treasury Note Futures:
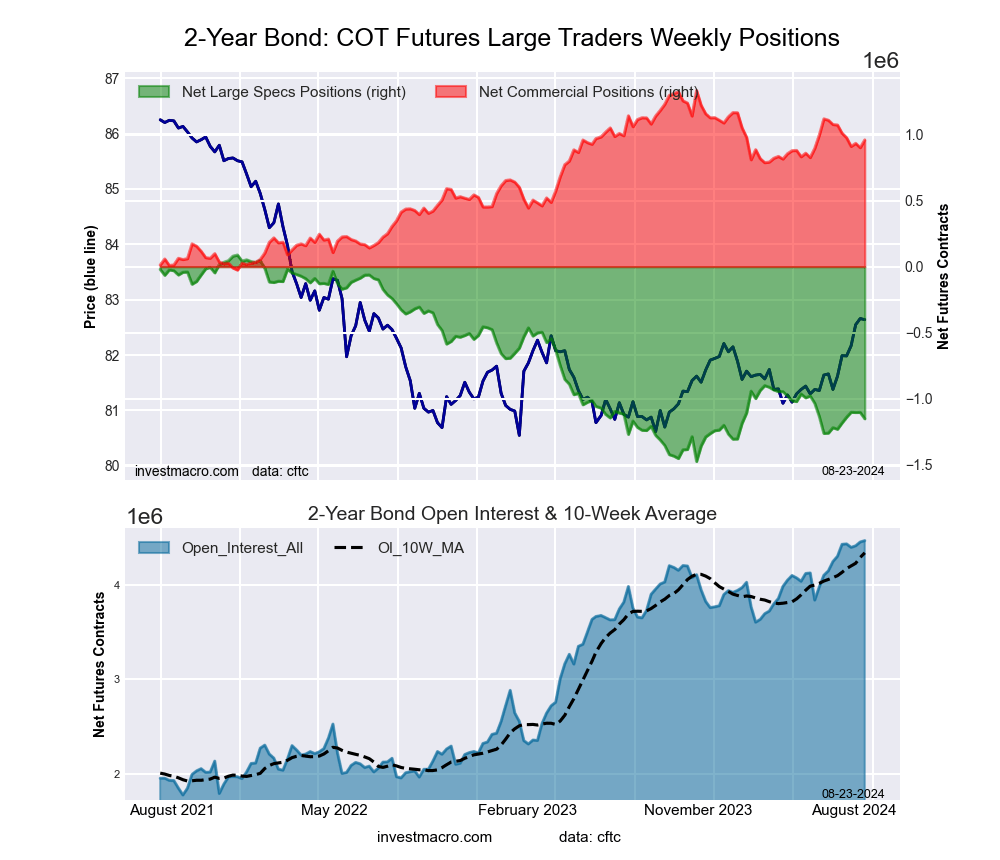 The 2-Year Treasury Note large speculator standing this week was a net position of -1,152,580 contracts in the data reported through Tuesday. This was a weekly fall of -47,974 contracts from the previous week which had a total of -1,104,606 net contracts.
This week’s current strength score (the trader positioning range over the past three years, measured from 0 to 100) shows the speculators are currently Bearish with a score of 20.7 percent. The commercials are Bullish with a score of 72.5 percent and the small traders (not shown in chart) are Bullish-Extreme with a score of 96.7 percent.
Price Trend-Following Model: Strong Uptrend
Our weekly trend-following model classifies the current market price position as: Strong Uptrend. The current action for the model is considered to be: Hold – Maintain Long Position.
| 2-Year Treasury Note Statistics | SPECULATORS | COMMERCIALS | SMALL TRADERS |
| – Percent of Open Interest Longs: | 14.5 | 76.8 | 6.9 |
| – Percent of Open Interest Shorts: | 40.3 | 55.4 | 2.6 |
| – Net Position: | -1,152,580 | 960,037 | 192,543 |
| – Gross Longs: | 648,767 | 3,436,139 | 307,340 |
| – Gross Shorts: | 1,801,347 | 2,476,102 | 114,797 |
| – Long to Short Ratio: | 0.4 to 1 | 1.4 to 1 | 2.7 to 1 |
| NET POSITION TREND: | |||
| – Strength Index Score (3 Year Range Pct): | 20.7 | 72.5 | 96.7 |
| – Strength Index Reading (3 Year Range): | Bearish | Bullish | Bullish-Extreme |
| NET POSITION MOVEMENT INDEX: | |||
| – 6-Week Change in Strength Index: | 5.1 | -8.3 | 10.6 |
5-Year Treasury Note Futures:
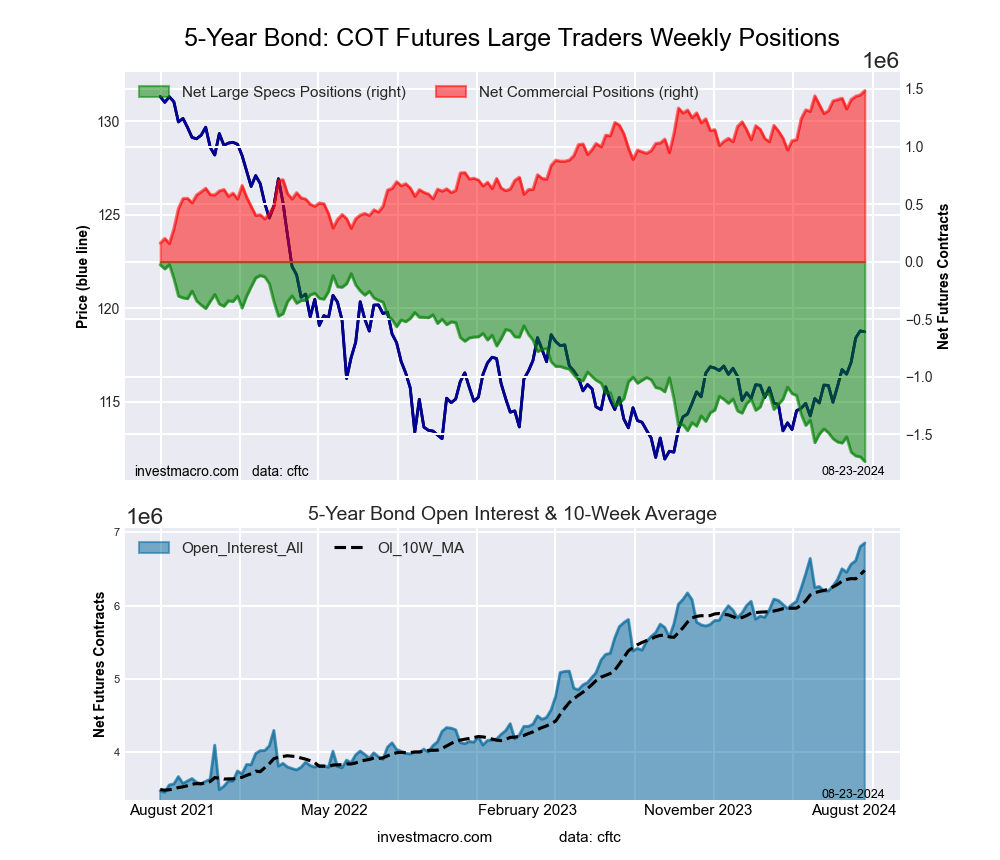 The 5-Year Treasury Note large speculator standing this week was a net position of -1,736,810 contracts in the data reported through Tuesday. This was a weekly fall of -41,738 contracts from the previous week which had a total of -1,695,072 net contracts.
This week’s current strength score (the trader positioning range over the past three years, measured from 0 to 100) shows the speculators are currently Bearish-Extreme with a score of 0.0 percent. The commercials are Bullish-Extreme with a score of 100.0 percent and the small traders (not shown in chart) are Bullish-Extreme with a score of 99.9 percent.
Price Trend-Following Model: Strong Uptrend
Our weekly trend-following model classifies the current market price position as: Strong Uptrend. The current action for the model is considered to be: Hold – Maintain Long Position.
| 5-Year Treasury Note Statistics | SPECULATORS | COMMERCIALS | SMALL TRADERS |
| – Percent of Open Interest Longs: | 8.5 | 82.1 | 7.1 |
| – Percent of Open Interest Shorts: | 33.9 | 60.4 | 3.5 |
| – Net Position: | -1,736,810 | 1,486,515 | 250,295 |
| – Gross Longs: | 586,030 | 5,625,205 | 488,422 |
| – Gross Shorts: | 2,322,840 | 4,138,690 | 238,127 |
| – Long to Short Ratio: | 0.3 to 1 | 1.4 to 1 | 2.1 to 1 |
| NET POSITION TREND: | |||
| – Strength Index Score (3 Year Range Pct): | 0.0 | 100.0 | 99.9 |
| – Strength Index Reading (3 Year Range): | Bearish-Extreme | Bullish-Extreme | Bullish-Extreme |
| NET POSITION MOVEMENT INDEX: | |||
| – 6-Week Change in Strength Index: | -9.9 | 5.9 | 16.8 |
10-Year Treasury Note Futures:
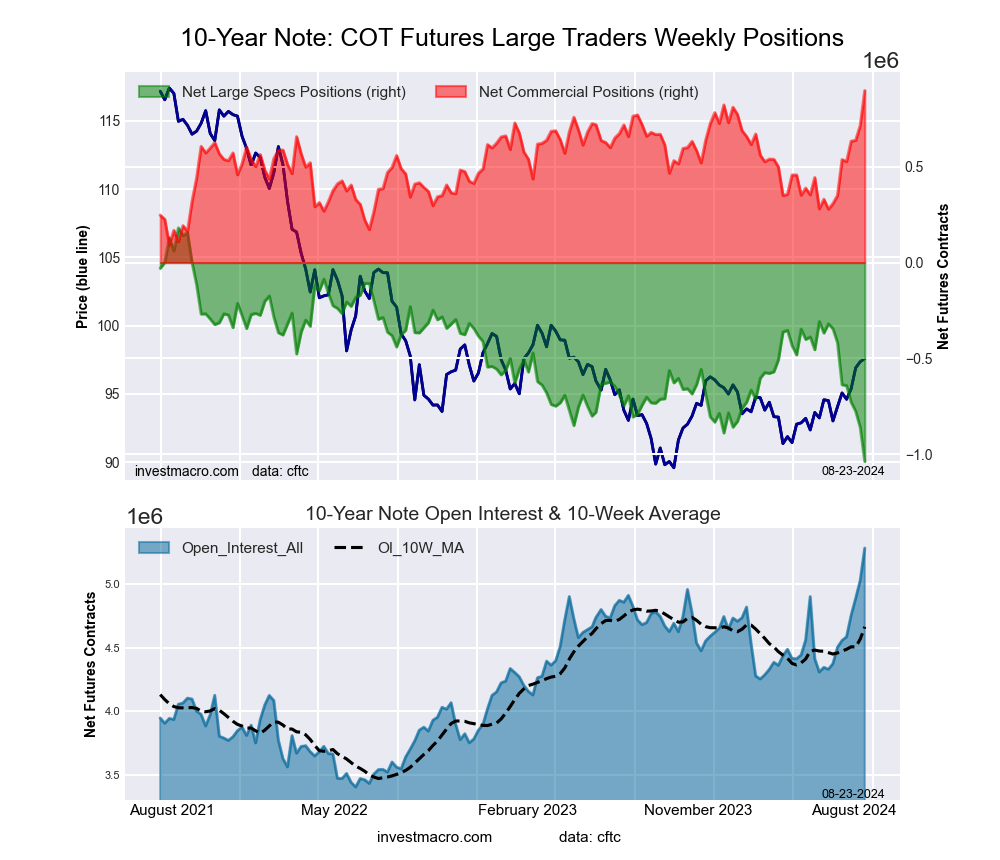 The 10-Year Treasury Note large speculator standing this week was a net position of -1,038,112 contracts in the data reported through Tuesday. This was a weekly decrease of -177,869 contracts from the previous week which had a total of -860,243 net contracts.
This week’s current strength score (the trader positioning range over the past three years, measured from 0 to 100) shows the speculators are currently Bearish-Extreme with a score of 0.0 percent. The commercials are Bullish-Extreme with a score of 100.0 percent and the small traders (not shown in chart) are Bullish-Extreme with a score of 99.0 percent.
Price Trend-Following Model: Strong Uptrend
Our weekly trend-following model classifies the current market price position as: Strong Uptrend. The current action for the model is considered to be: Hold – Maintain Long Position.
| 10-Year Treasury Note Statistics | SPECULATORS | COMMERCIALS | SMALL TRADERS |
| – Percent of Open Interest Longs: | 7.8 | 78.3 | 9.3 |
| – Percent of Open Interest Shorts: | 27.4 | 61.3 | 6.7 |
| – Net Position: | -1,038,112 | 898,127 | 139,985 |
| – Gross Longs: | 411,629 | 4,134,790 | 493,072 |
| – Gross Shorts: | 1,449,741 | 3,236,663 | 353,087 |
| – Long to Short Ratio: | 0.3 to 1 | 1.3 to 1 | 1.4 to 1 |
| NET POSITION TREND: | |||
| – Strength Index Score (3 Year Range Pct): | 0.0 | 100.0 | 99.0 |
| – Strength Index Reading (3 Year Range): | Bearish-Extreme | Bullish-Extreme | Bullish-Extreme |
| NET POSITION MOVEMENT INDEX: | |||
| – 6-Week Change in Strength Index: | -50.9 | 67.9 | 15.0 |
Ultra 10-Year Notes Futures:
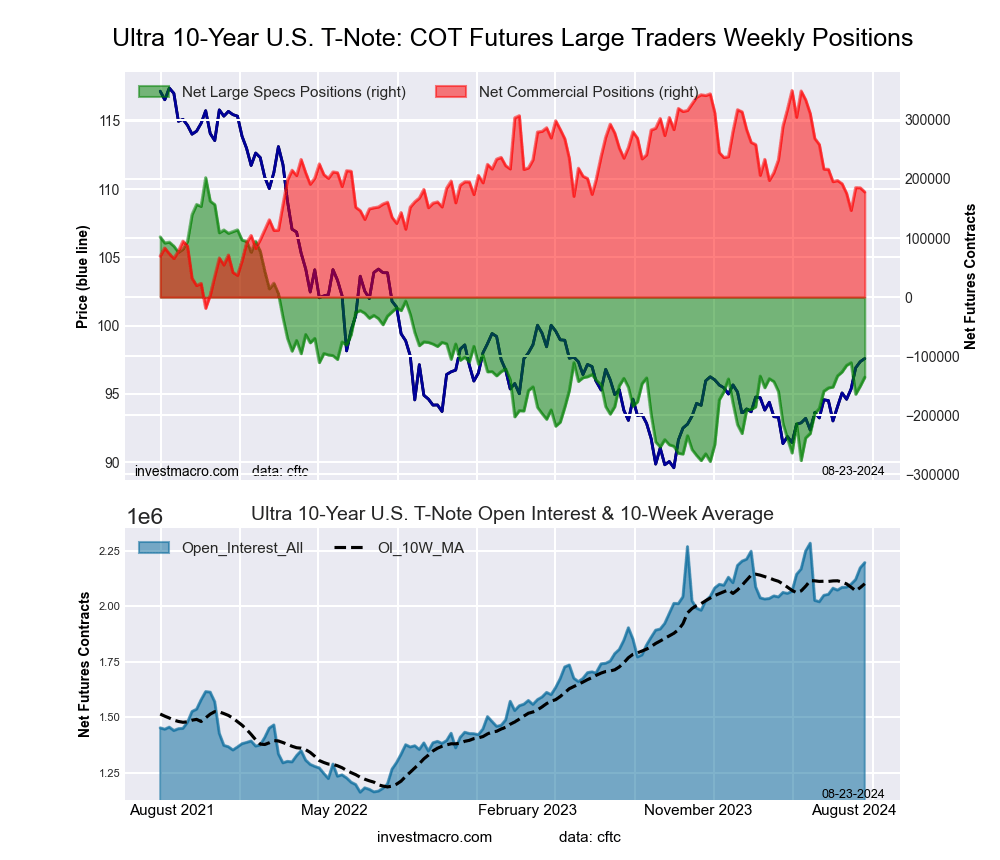 The Ultra 10-Year Notes large speculator standing this week was a net position of -135,560 contracts in the data reported through Tuesday. This was a weekly gain of 15,073 contracts from the previous week which had a total of -150,633 net contracts.
This week’s current strength score (the trader positioning range over the past three years, measured from 0 to 100) shows the speculators are currently Bearish with a score of 29.7 percent. The commercials are Bullish with a score of 53.4 percent and the small traders (not shown in chart) are Bullish-Extreme with a score of 87.6 percent.
Price Trend-Following Model: Weak Uptrend
Our weekly trend-following model classifies the current market price position as: Weak Uptrend. The current action for the model is considered to be: Hold – Maintain Long Position.
| Ultra 10-Year Notes Statistics | SPECULATORS | COMMERCIALS | SMALL TRADERS |
| – Percent of Open Interest Longs: | 13.3 | 74.4 | 10.3 |
| – Percent of Open Interest Shorts: | 19.4 | 66.3 | 12.2 |
| – Net Position: | -135,560 | 177,795 | -42,235 |
| – Gross Longs: | 291,156 | 1,634,861 | 225,405 |
| – Gross Shorts: | 426,716 | 1,457,066 | 267,640 |
| – Long to Short Ratio: | 0.7 to 1 | 1.1 to 1 | 0.8 to 1 |
| NET POSITION TREND: | |||
| – Strength Index Score (3 Year Range Pct): | 29.7 | 53.4 | 87.6 |
| – Strength Index Reading (3 Year Range): | Bearish | Bullish | Bullish-Extreme |
| NET POSITION MOVEMENT INDEX: | |||
| – 6-Week Change in Strength Index: | -0.5 | -5.3 | 12.7 |
US Treasury Bonds Futures:
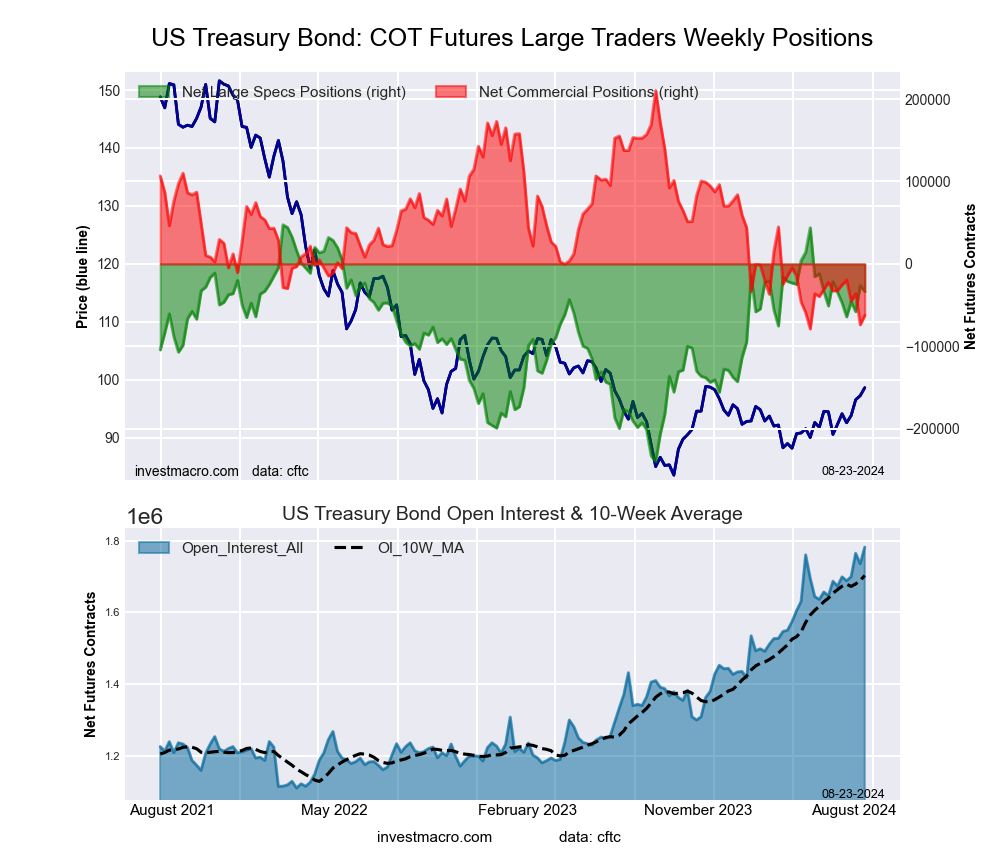 The US Treasury Bonds large speculator standing this week was a net position of -33,495 contracts in the data reported through Tuesday. This was a weekly decrease of -7,165 contracts from the previous week which had a total of -26,330 net contracts.
This week’s current strength score (the trader positioning range over the past three years, measured from 0 to 100) shows the speculators are currently Bullish with a score of 71.8 percent. The commercials are Bearish-Extreme with a score of 5.7 percent and the small traders (not shown in chart) are Bullish-Extreme with a score of 96.7 percent.
Price Trend-Following Model: Strong Uptrend
Our weekly trend-following model classifies the current market price position as: Strong Uptrend. The current action for the model is considered to be: Hold – Maintain Long Position.
| US Treasury Bonds Statistics | SPECULATORS | COMMERCIALS | SMALL TRADERS |
| – Percent of Open Interest Longs: | 19.6 | 63.1 | 12.9 |
| – Percent of Open Interest Shorts: | 21.5 | 66.6 | 7.6 |
| – Net Position: | -33,495 | -62,345 | 95,840 |
| – Gross Longs: | 349,758 | 1,123,590 | 230,592 |
| – Gross Shorts: | 383,253 | 1,185,935 | 134,752 |
| – Long to Short Ratio: | 0.9 to 1 | 0.9 to 1 | 1.7 to 1 |
| NET POSITION TREND: | |||
| – Strength Index Score (3 Year Range Pct): | 71.8 | 5.7 | 96.7 |
| – Strength Index Reading (3 Year Range): | Bullish | Bearish-Extreme | Bullish-Extreme |
| NET POSITION MOVEMENT INDEX: | |||
| – 6-Week Change in Strength Index: | 0.3 | -10.4 | 22.6 |
Ultra US Treasury Bonds Futures:
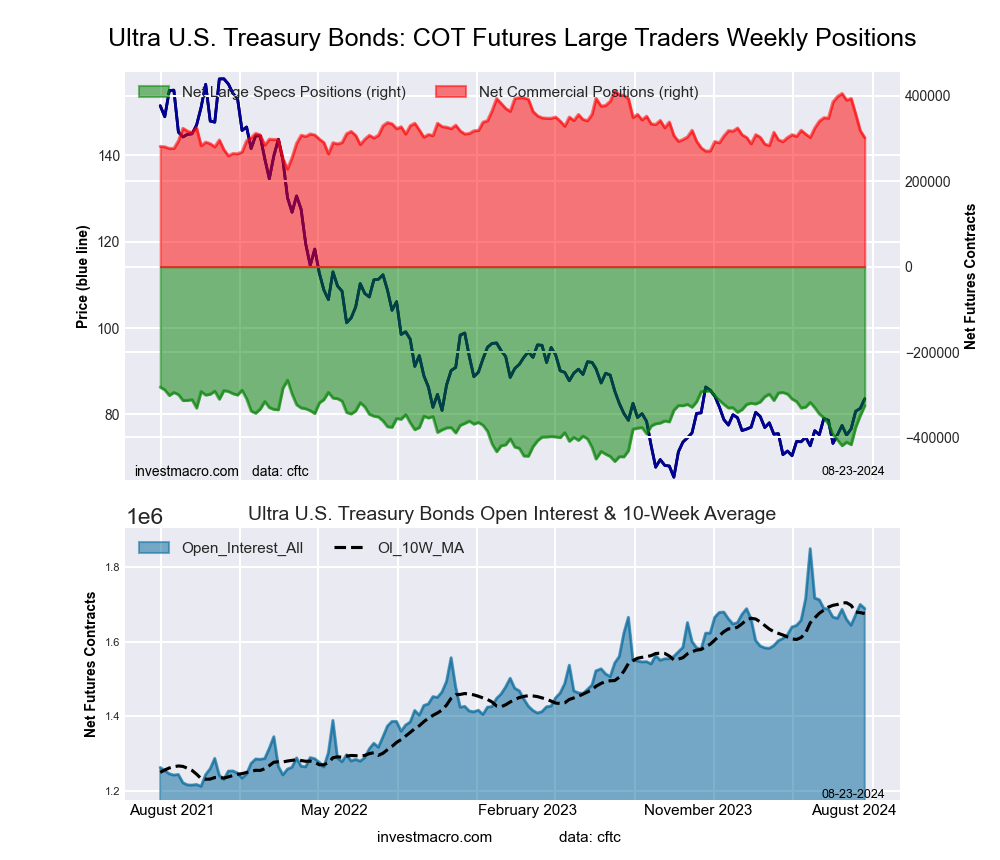 The Ultra US Treasury Bonds large speculator standing this week was a net position of -325,614 contracts in the data reported through Tuesday. This was a weekly rise of 23,519 contracts from the previous week which had a total of -349,133 net contracts.
This week’s current strength score (the trader positioning range over the past three years, measured from 0 to 100) shows the speculators are currently Bullish with a score of 68.8 percent. The commercials are Bearish with a score of 39.8 percent and the small traders (not shown in chart) are Bearish with a score of 44.4 percent.
Price Trend-Following Model: Strong Uptrend
Our weekly trend-following model classifies the current market price position as: Strong Uptrend. The current action for the model is considered to be: Hold – Maintain Long Position.
| Ultra US Treasury Bonds Statistics | SPECULATORS | COMMERCIALS | SMALL TRADERS |
| – Percent of Open Interest Longs: | 8.9 | 77.3 | 10.9 |
| – Percent of Open Interest Shorts: | 28.2 | 59.4 | 9.5 |
| – Net Position: | -325,614 | 301,909 | 23,705 |
| – Gross Longs: | 150,286 | 1,305,478 | 184,173 |
| – Gross Shorts: | 475,900 | 1,003,569 | 160,468 |
| – Long to Short Ratio: | 0.3 to 1 | 1.3 to 1 | 1.1 to 1 |
| NET POSITION TREND: | |||
| – Strength Index Score (3 Year Range Pct): | 68.8 | 39.8 | 44.4 |
| – Strength Index Reading (3 Year Range): | Bullish | Bearish | Bearish |
| NET POSITION MOVEMENT INDEX: | |||
| – 6-Week Change in Strength Index: | 42.2 | -52.6 | 21.2 |
Article By InvestMacro – Receive our weekly COT Newsletter
*COT Report: The COT data, released weekly to the public each Friday, is updated through the most recent Tuesday (data is 3 days old) and shows a quick view of how large speculators or non-commercials (for-profit traders) were positioned in the futures markets.
The CFTC categorizes trader positions according to commercial hedgers (traders who use futures contracts for hedging as part of the business), non-commercials (large traders who speculate to realize trading profits) and nonreportable traders (usually small traders/speculators) as well as their open interest (contracts open in the market at time of reporting). See CFTC criteria here.