By InvestMacro
Here are the latest charts and statistics for the Commitment of Traders (COT) data published by the Commodities Futures Trading Commission (CFTC).
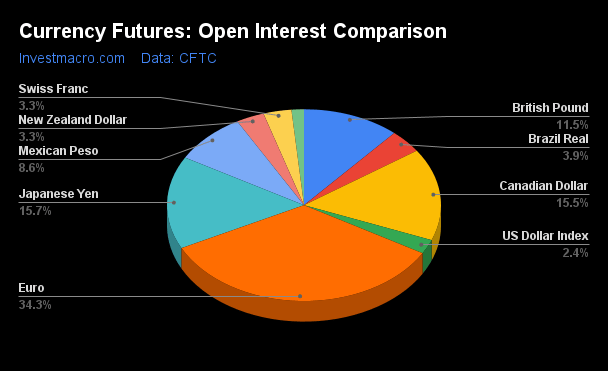
The latest COT data is updated through Tuesday August 20th and shows a quick view of how large market participants (for-profit speculators and commercial traders) were positioned in the futures markets. All currency positions are in direct relation to the US dollar where, for example, a bet for the euro is a bet that the euro will rise versus the dollar while a bet against the euro will be a bet that the euro will decline versus the dollar.
Weekly Speculator Changes led by Euro & British Pound
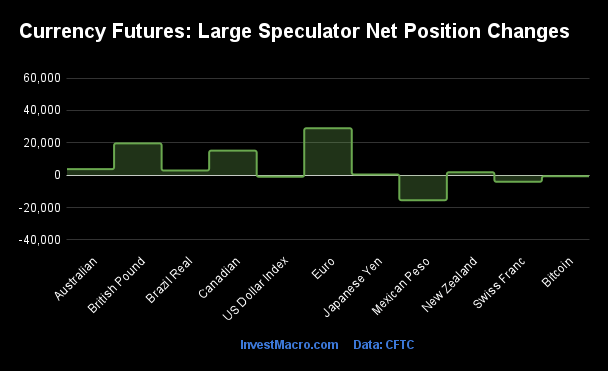
The COT currency market speculator bets were higher this week as seven out of the eleven currency markets we cover had higher positioning while the other four markets had lower speculator contracts.
Leading the gains for the currency markets was the EuroFX (29,034 contracts) with the British Pound (19,699 contracts), the Canadian Dollar (15,201 contracts), the Australian Dollar (3,731 contracts), the Brazilian Real (2,887 contracts), the New Zealand Dollar (1,855 contracts) and the Japanese Yen (481 contracts) also showing positive weeks.
The currencies seeing declines in speculator bets on the week were the Mexican Peso (-15,448 contracts), the Swiss Franc (-4,050 contracts), the US Dollar Index (-945 contracts) and with Bitcoin (-638 contracts) also registering lower bets on the week.
Currency Speculators sharply raise Euro, British Pound & Canadian Dollar bets
This week’s COT currency’s data saw improvement in many of the non-dollar currencies this week. The US Dollar Index fell by over 1 percent this week as the American currency faces pressure from moderating inflation and expected interest rate cuts from the US Federal Reserve starting in September.
Here is this week’s COT currency roundup:
The Euro speculator positioning jumped by +29,034 contracts this week and rose for the fifth time out of the past seven weeks. This week’s gain was the highest weekly rise in over a year and brought the overall bullish position to an 11-week high. Euro positions have now been in bullish territory for seven straight weeks after a brief fall onto the bearish side for two weeks in late-June and early-July. The Euro exchange rate versus the dollar closed this week above it’s 200-week moving average and right below the 1.1200 exchange rate — the highest weekly close since July of 2023.
The British pound sterling speculator contracts rose strongly this week (+19,699 contracts) following sharp declines over the past three weeks that had taken a total of -94,371 contracts off of the speculator’s bullish standing. The GBP speculator position had surged to an all-time record high on July 23rd at a total of +142,183 contracts before embarking on a three-week slide. The previous record high speculator position had been prior (July 17th 2007 at +98,366 contracts) to the start of the Great Financial Crisis. This week’s rebound brings the speculator standing back up to a total of +67,511 contracts. The GBPUSD exchange rate this week has touched its highest level since March of 2022 against the US dollar and closed over 1.3200 to end the week.
The Canadian dollar has been on the other side of the spectrum than that of the British pound as it recently fell to an all-time record bearish speculator level. The CAD spec bets had dropped to -196,263 contracts on July 30th but have now rebounded for three straight weeks including this week’s gain by over +15,000 contracts. The CAD position settled this week at a standing of -164,410 contracts (the 4th most bearish level on record) and, overall, has now been in a bearish position for fifty-five straight weeks, dating back to August 1st of 2023. The Canadian dollar exchange rate had a strong week versus the US dollar and rose over 1 percent as the CAD futures price closed over the 0.7400 threshold and up against the top of its weekly down-trending channel that started in May/June of 2021.
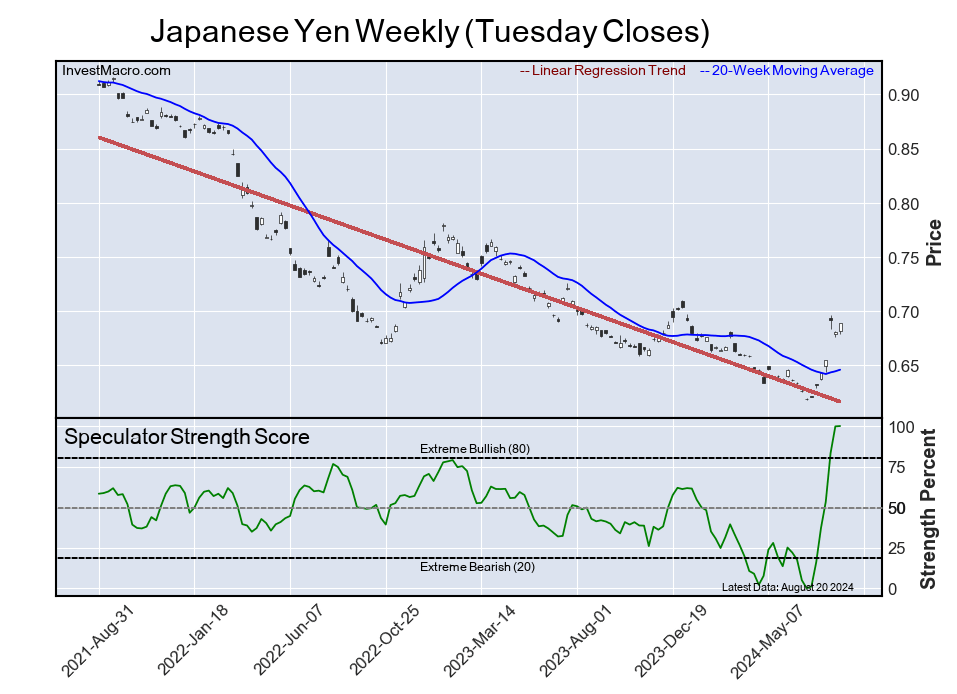
Finally, the Japanese yen speculator bets continued to gain for a seventh straight week this week after dropping to the second lowest level on record at -184,223 contracts on July 2nd. The seven-week improvement has totaled +207,808 contracts and has taken the speculator position from -184,223 contracts on July 2nd to this week’s total of +23,585 contracts. Traders have been quick to reverse their positions on central bank policy changes (and currency intervention) with the US Federal Reserve ready to reduce interest rates while the Bank of Japan is possibly looking to raise their rates. The yen exchange rate versus the dollar rose strongly this week with a 5-day gain over 2 percent. The Japanese yen strength brought the USDJPY currency pair to the 144.39 exchange rate, the best weekly close for the yen since January.
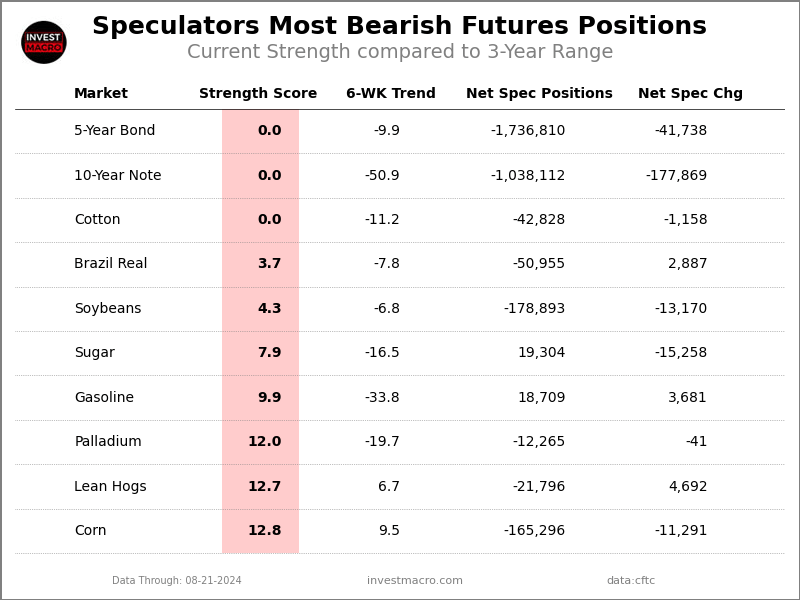
Currencies Net Speculators Leaderboard
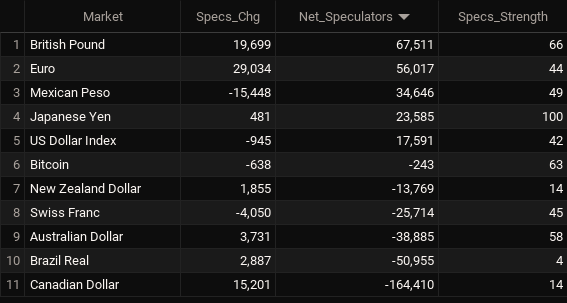
Legend: Weekly Speculators Change | Speculators Current Net Position | Speculators Strength Score compared to last 3-Years (0-100 range)
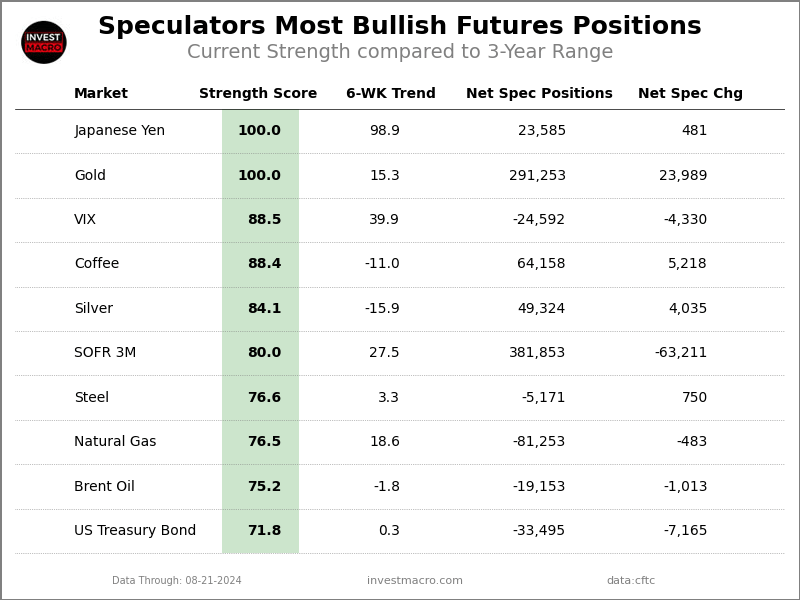
Strength Scores led by Japanese Yen
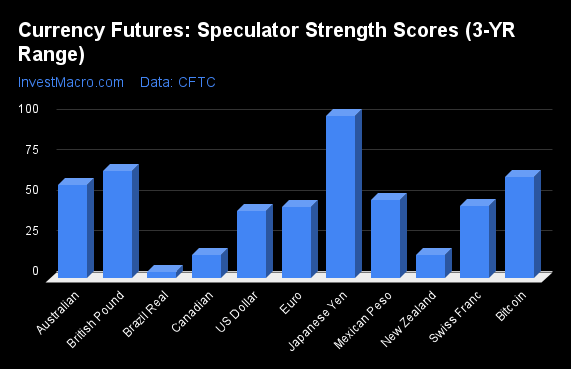
COT Strength Scores (a normalized measure of Speculator positions over a 3-Year range, from 0 to 100 where above 80 is Extreme-Bullish and below 20 is Extreme-Bearish) showed that the Japanese Yen (100 percent) leads the currency markets this week. The the British Pound (66 percent), Bitcoin (63 percent) and the Australian Dollar (58 percent) come in as the next highest in the weekly strength scores.
On the downside, the Brazilian Real (4 percent), the New Zealand Dollar (14 percent) and the Canadian Dollar (14 percent) come in at the lowest strength levels currently and are in Extreme-Bearish territory (below 20 percent).
Strength Statistics:
US Dollar Index (41.5 percent) vs US Dollar Index previous week (43.6 percent)
EuroFX (44.2 percent) vs EuroFX previous week (31.8 percent)
British Pound Sterling (66.4 percent) vs British Pound Sterling previous week (57.6 percent)
Japanese Yen (100.0 percent) vs Japanese Yen previous week (99.8 percent)
Swiss Franc (44.8 percent) vs Swiss Franc previous week (52.3 percent)
Canadian Dollar (14.3 percent) vs Canadian Dollar previous week (7.5 percent)
Australian Dollar (57.9 percent) vs Australian Dollar previous week (54.7 percent)
New Zealand Dollar (14.4 percent) vs New Zealand Dollar previous week (10.9 percent)
Mexican Peso (48.5 percent) vs Mexican Peso previous week (56.0 percent)
Brazilian Real (3.7 percent) vs Brazilian Real previous week (1.0 percent)
Bitcoin (62.7 percent) vs Bitcoin previous week (72.4 percent)
Japanese Yen & Swiss Franc top the 6-Week Strength Trends
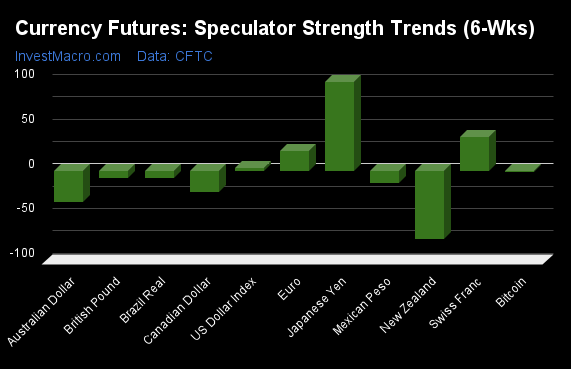
COT Strength Score Trends (or move index, calculates the 6-week changes in strength scores) showed that the Japanese Yen (99 percent) and the Swiss Franc (38 percent) lead the past six weeks trends for the currencies. The EuroFX (22 percent) and the US Dollar Index (3 percent) are the next highest positive movers in the latest trends data.
The New Zealand Dollar (-76 percent) leads the downside trend scores currently with the Australian Dollar (-35 percent), Canadian Dollar (-24 percent) and the Mexican Peso (-14 percent) following next with lower trend scores.
Strength Trend Statistics:
US Dollar Index (2.9 percent) vs US Dollar Index previous week (4.2 percent)
EuroFX (22.3 percent) vs EuroFX previous week (15.5 percent)
British Pound Sterling (-7.7 percent) vs British Pound Sterling previous week (-6.4 percent)
Japanese Yen (98.9 percent) vs Japanese Yen previous week (99.8 percent)
Swiss Franc (37.9 percent) vs Swiss Franc previous week (40.5 percent)
Canadian Dollar (-23.8 percent) vs Canadian Dollar previous week (-26.6 percent)
Australian Dollar (-34.8 percent) vs Australian Dollar previous week (-22.6 percent)
New Zealand Dollar (-76.3 percent) vs New Zealand Dollar previous week (-89.1 percent)
Mexican Peso (-14.1 percent) vs Mexican Peso previous week (-6.6 percent)
Brazilian Real (-7.8 percent) vs Brazilian Real previous week (-12.1 percent)
Bitcoin (-1.9 percent) vs Bitcoin previous week (19.7 percent)
Individual COT Forex Markets:
US Dollar Index Futures:
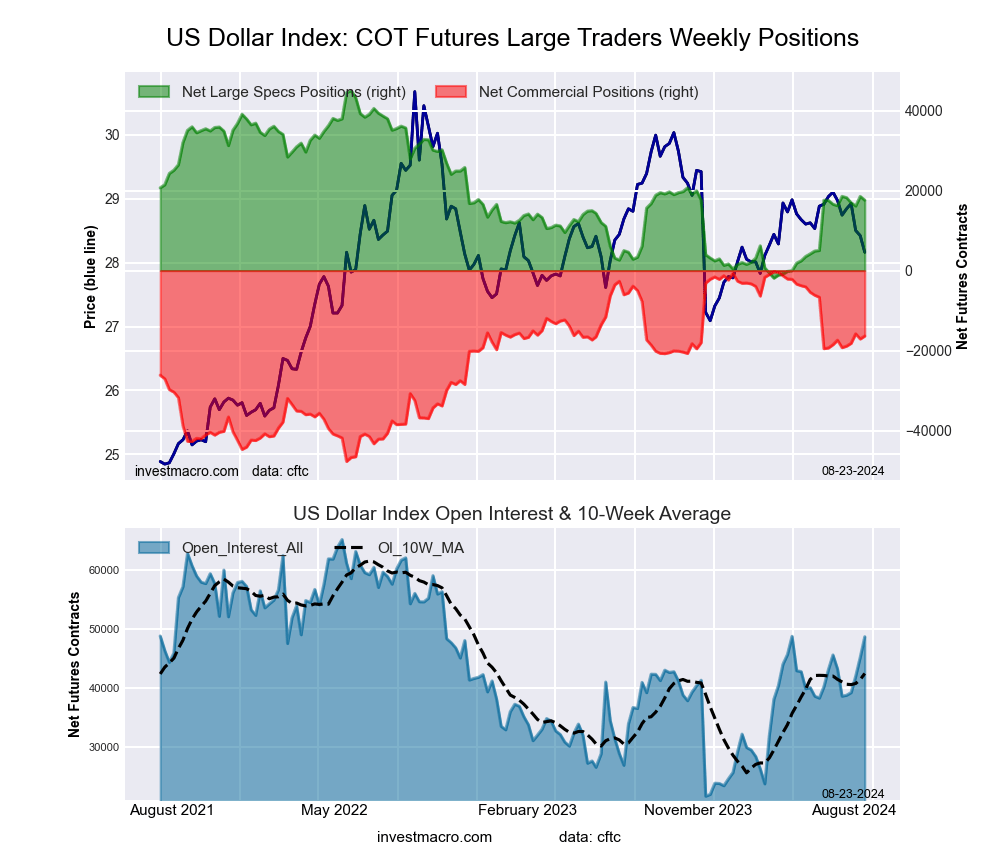 The US Dollar Index large speculator standing this week equaled a net position of 17,591 contracts in the data reported through Tuesday. This was a weekly fall of -945 contracts from the previous week which had a total of 18,536 net contracts.
This week’s current strength score (the trader positioning range over the past three years, measured from 0 to 100) shows the speculators are currently Bearish with a score of 41.5 percent. The commercials are Bullish with a score of 66.1 percent and the small traders (not shown in chart) are Bearish-Extreme with a score of 2.2 percent.
Price Trend-Following Model: Strong Downtrend
Our weekly trend-following model classifies the current market price position as: Strong Downtrend. The current action for the model is considered to be: New Sell – Short Position.
| US DOLLAR INDEX Statistics | SPECULATORS | COMMERCIALS | SMALL TRADERS |
| – Percent of Open Interest Longs: | 72.8 | 19.3 | 4.8 |
| – Percent of Open Interest Shorts: | 36.7 | 52.9 | 7.3 |
| – Net Position: | 17,591 | -16,372 | -1,219 |
| – Gross Longs: | 35,452 | 9,412 | 2,361 |
| – Gross Shorts: | 17,861 | 25,784 | 3,580 |
| – Long to Short Ratio: | 2.0 to 1 | 0.4 to 1 | 0.7 to 1 |
| NET POSITION TREND: | | | |
| – Strength Index Score (3 Year Range Pct): | 41.5 | 66.1 | 2.2 |
| – Strength Index Reading (3 Year Range): | Bearish | Bullish | Bearish-Extreme |
| NET POSITION MOVEMENT INDEX: | | | |
| – 6-Week Change in Strength Index: | 2.9 | 2.2 | -26.9 |
Euro Currency Futures:
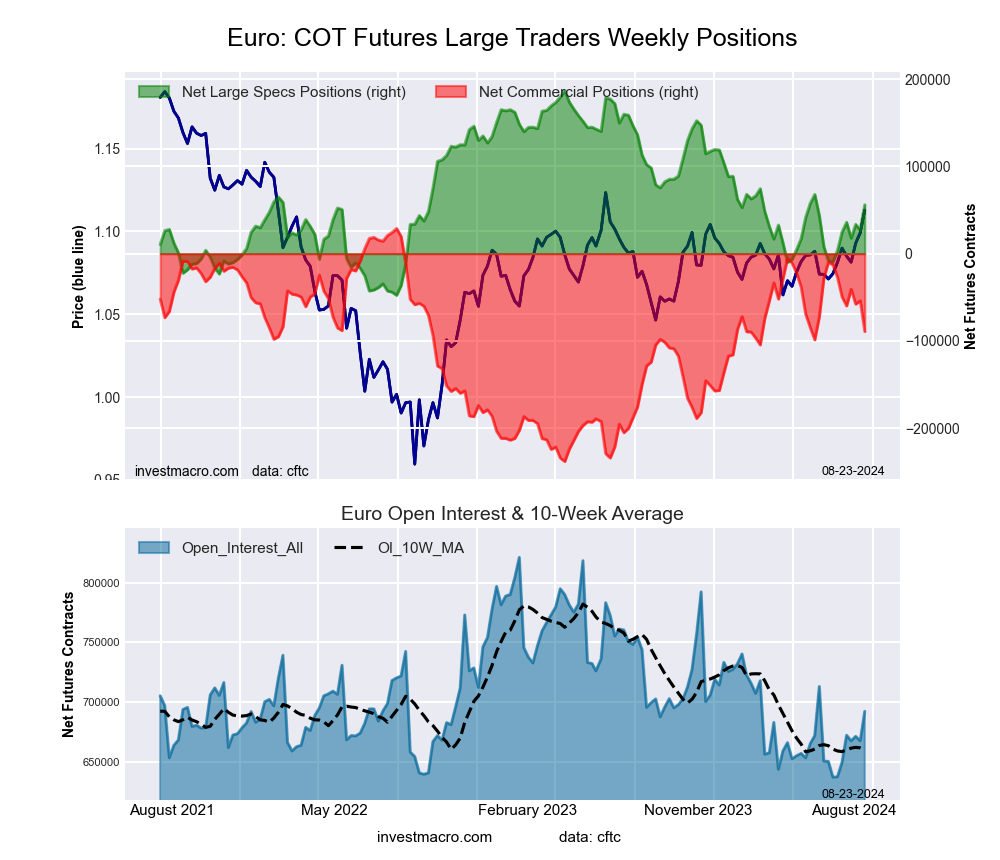 The Euro Currency large speculator standing this week equaled a net position of 56,017 contracts in the data reported through Tuesday. This was a weekly gain of 29,034 contracts from the previous week which had a total of 26,983 net contracts.
This week’s current strength score (the trader positioning range over the past three years, measured from 0 to 100) shows the speculators are currently Bearish with a score of 44.2 percent. The commercials are Bullish with a score of 55.8 percent and the small traders (not shown in chart) are Bearish with a score of 45.7 percent.
Price Trend-Following Model: Strong Uptrend
Our weekly trend-following model classifies the current market price position as: Strong Uptrend. The current action for the model is considered to be: Hold – Maintain Long Position.
| EURO Currency Statistics | SPECULATORS | COMMERCIALS | SMALL TRADERS |
| – Percent of Open Interest Longs: | 28.1 | 55.9 | 11.9 |
| – Percent of Open Interest Shorts: | 20.0 | 68.8 | 7.1 |
| – Net Position: | 56,017 | -89,224 | 33,207 |
| – Gross Longs: | 194,350 | 386,948 | 82,517 |
| – Gross Shorts: | 138,333 | 476,172 | 49,310 |
| – Long to Short Ratio: | 1.4 to 1 | 0.8 to 1 | 1.7 to 1 |
| NET POSITION TREND: | | | |
| – Strength Index Score (3 Year Range Pct): | 44.2 | 55.8 | 45.7 |
| – Strength Index Reading (3 Year Range): | Bearish | Bullish | Bearish |
| NET POSITION MOVEMENT INDEX: | | | |
| – 6-Week Change in Strength Index: | 22.3 | -23.2 | 21.9 |
British Pound Sterling Futures:
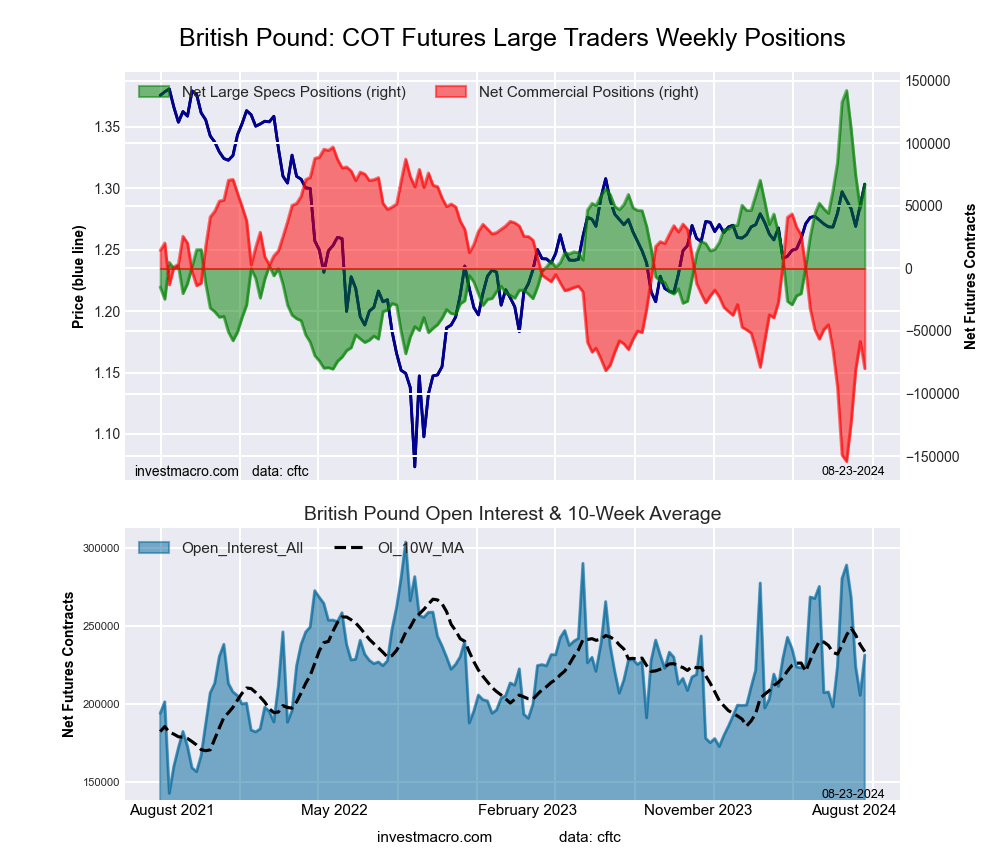 The British Pound Sterling large speculator standing this week equaled a net position of 67,511 contracts in the data reported through Tuesday. This was a weekly lift of 19,699 contracts from the previous week which had a total of 47,812 net contracts.
This week’s current strength score (the trader positioning range over the past three years, measured from 0 to 100) shows the speculators are currently Bullish with a score of 66.4 percent. The commercials are Bearish with a score of 29.6 percent and the small traders (not shown in chart) are Bullish-Extreme with a score of 88.3 percent.
Price Trend-Following Model: Strong Uptrend
Our weekly trend-following model classifies the current market price position as: Strong Uptrend. The current action for the model is considered to be: Hold – Maintain Long Position.
| BRITISH POUND Statistics | SPECULATORS | COMMERCIALS | SMALL TRADERS |
| – Percent of Open Interest Longs: | 54.3 | 23.9 | 16.3 |
| – Percent of Open Interest Shorts: | 25.1 | 58.4 | 10.9 |
| – Net Position: | 67,511 | -79,955 | 12,444 |
| – Gross Longs: | 125,634 | 55,248 | 37,610 |
| – Gross Shorts: | 58,123 | 135,203 | 25,166 |
| – Long to Short Ratio: | 2.2 to 1 | 0.4 to 1 | 1.5 to 1 |
| NET POSITION TREND: | | | |
| – Strength Index Score (3 Year Range Pct): | 66.4 | 29.6 | 88.3 |
| – Strength Index Reading (3 Year Range): | Bullish | Bearish | Bullish-Extreme |
| NET POSITION MOVEMENT INDEX: | | | |
| – 6-Week Change in Strength Index: | -7.7 | 5.8 | 5.4 |
Japanese Yen Futures:
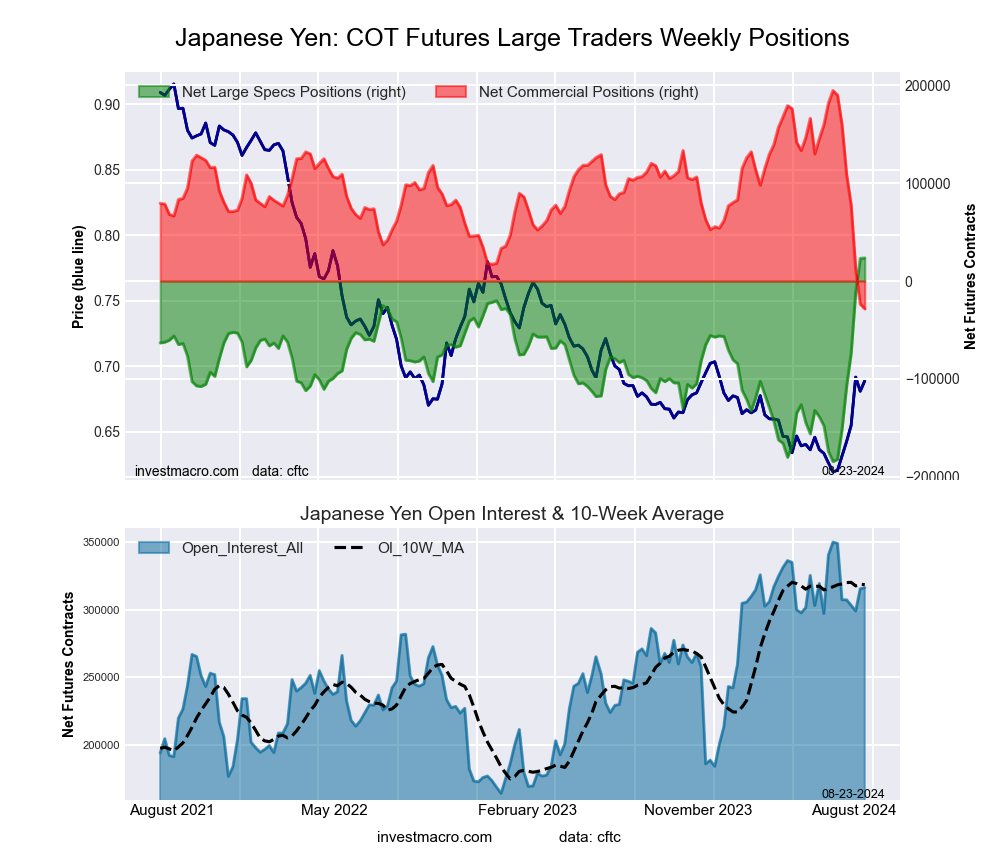 The Japanese Yen large speculator standing this week equaled a net position of 23,585 contracts in the data reported through Tuesday. This was a weekly increase of 481 contracts from the previous week which had a total of 23,104 net contracts.
This week’s current strength score (the trader positioning range over the past three years, measured from 0 to 100) shows the speculators are currently Bullish-Extreme with a score of 100.0 percent. The commercials are Bearish-Extreme with a score of 0.0 percent and the small traders (not shown in chart) are Bullish-Extreme with a score of 97.7 percent.
Price Trend-Following Model: Strong Uptrend
Our weekly trend-following model classifies the current market price position as: Strong Uptrend. The current action for the model is considered to be: Hold – Maintain Long Position.
| JAPANESE YEN Statistics | SPECULATORS | COMMERCIALS | SMALL TRADERS |
| – Percent of Open Interest Longs: | 28.1 | 59.2 | 11.4 |
| – Percent of Open Interest Shorts: | 20.6 | 68.1 | 9.9 |
| – Net Position: | 23,585 | -28,401 | 4,816 |
| – Gross Longs: | 88,761 | 187,055 | 35,989 |
| – Gross Shorts: | 65,176 | 215,456 | 31,173 |
| – Long to Short Ratio: | 1.4 to 1 | 0.9 to 1 | 1.2 to 1 |
| NET POSITION TREND: | | | |
| – Strength Index Score (3 Year Range Pct): | 100.0 | 0.0 | 97.7 |
| – Strength Index Reading (3 Year Range): | Bullish-Extreme | Bearish-Extreme | Bullish-Extreme |
| NET POSITION MOVEMENT INDEX: | | | |
| – 6-Week Change in Strength Index: | 98.9 | -97.9 | 39.7 |
Swiss Franc Futures:
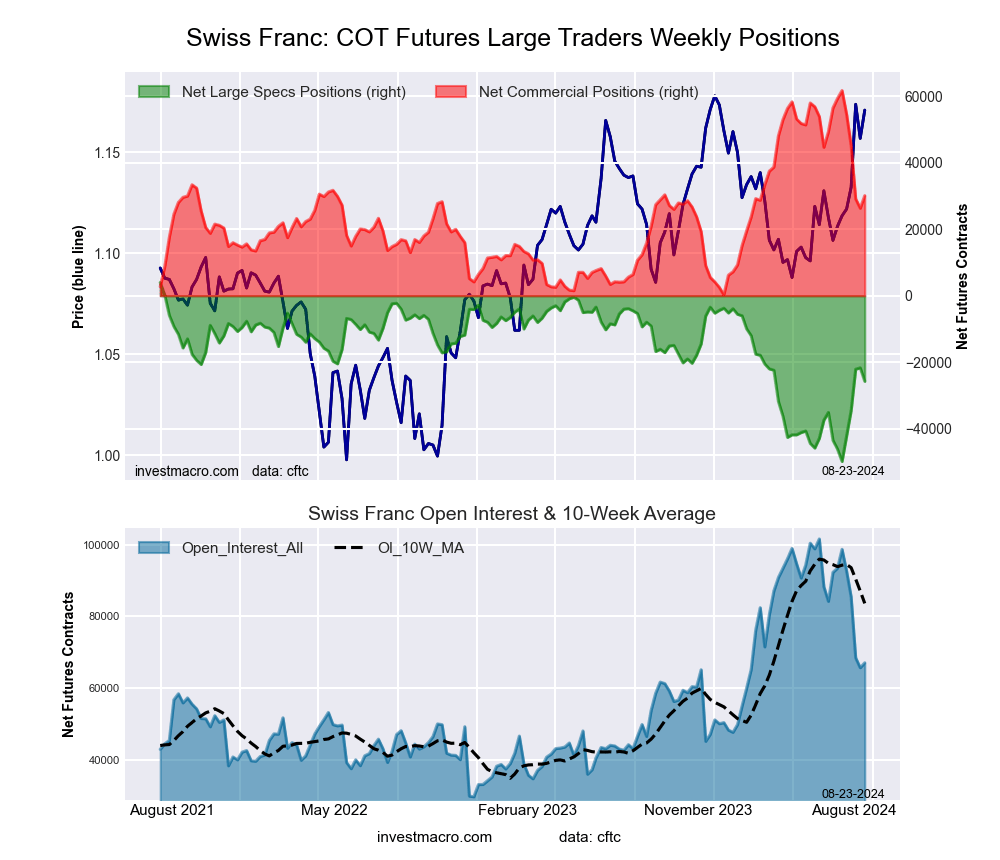 The Swiss Franc large speculator standing this week equaled a net position of -25,714 contracts in the data reported through Tuesday. This was a weekly decline of -4,050 contracts from the previous week which had a total of -21,664 net contracts.
This week’s current strength score (the trader positioning range over the past three years, measured from 0 to 100) shows the speculators are currently Bearish with a score of 44.8 percent. The commercials are Bearish with a score of 48.6 percent and the small traders (not shown in chart) are Bullish with a score of 57.3 percent.
Price Trend-Following Model: Strong Uptrend
Our weekly trend-following model classifies the current market price position as: Strong Uptrend. The current action for the model is considered to be: Hold – Maintain Long Position.
| SWISS FRANC Statistics | SPECULATORS | COMMERCIALS | SMALL TRADERS |
| – Percent of Open Interest Longs: | 11.3 | 69.9 | 18.4 |
| – Percent of Open Interest Shorts: | 49.6 | 25.1 | 24.9 |
| – Net Position: | -25,714 | 30,096 | -4,382 |
| – Gross Longs: | 7,600 | 46,907 | 12,329 |
| – Gross Shorts: | 33,314 | 16,811 | 16,711 |
| – Long to Short Ratio: | 0.2 to 1 | 2.8 to 1 | 0.7 to 1 |
| NET POSITION TREND: | | | |
| – Strength Index Score (3 Year Range Pct): | 44.8 | 48.6 | 57.3 |
| – Strength Index Reading (3 Year Range): | Bearish | Bearish | Bullish |
| NET POSITION MOVEMENT INDEX: | | | |
| – 6-Week Change in Strength Index: | 37.9 | -47.6 | 40.1 |
Canadian Dollar Futures:
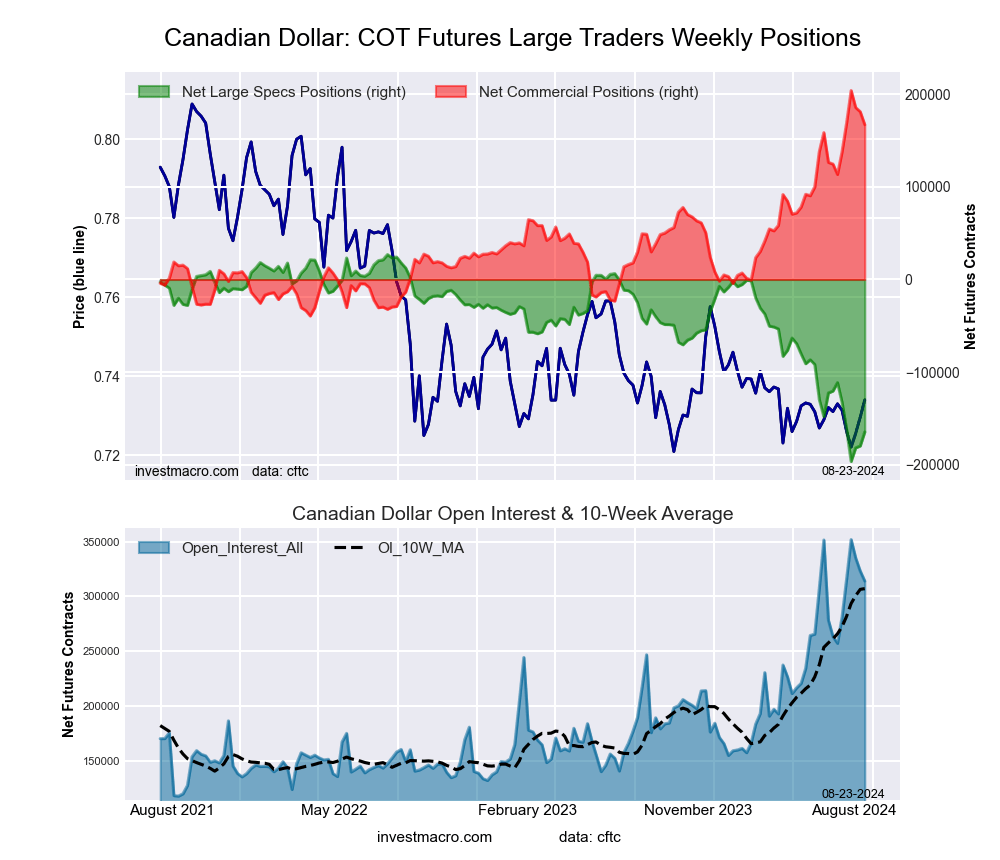 The Canadian Dollar large speculator standing this week equaled a net position of -164,410 contracts in the data reported through Tuesday. This was a weekly lift of 15,201 contracts from the previous week which had a total of -179,611 net contracts.
This week’s current strength score (the trader positioning range over the past three years, measured from 0 to 100) shows the speculators are currently Bearish-Extreme with a score of 14.3 percent. The commercials are Bullish-Extreme with a score of 84.9 percent and the small traders (not shown in chart) are Bearish with a score of 23.1 percent.
Price Trend-Following Model: Weak Downtrend
Our weekly trend-following model classifies the current market price position as: Weak Downtrend. The current action for the model is considered to be: Hold – Maintain Short Position.
| CANADIAN DOLLAR Statistics | SPECULATORS | COMMERCIALS | SMALL TRADERS |
| – Percent of Open Interest Longs: | 6.2 | 82.2 | 9.6 |
| – Percent of Open Interest Shorts: | 58.6 | 29.1 | 10.4 |
| – Net Position: | -164,410 | 167,006 | -2,596 |
| – Gross Longs: | 19,528 | 258,246 | 30,062 |
| – Gross Shorts: | 183,938 | 91,240 | 32,658 |
| – Long to Short Ratio: | 0.1 to 1 | 2.8 to 1 | 0.9 to 1 |
| NET POSITION TREND: | | | |
| – Strength Index Score (3 Year Range Pct): | 14.3 | 84.9 | 23.1 |
| – Strength Index Reading (3 Year Range): | Bearish-Extreme | Bullish-Extreme | Bearish |
| NET POSITION MOVEMENT INDEX: | | | |
| – 6-Week Change in Strength Index: | -23.8 | 22.1 | -1.5 |
Australian Dollar Futures:
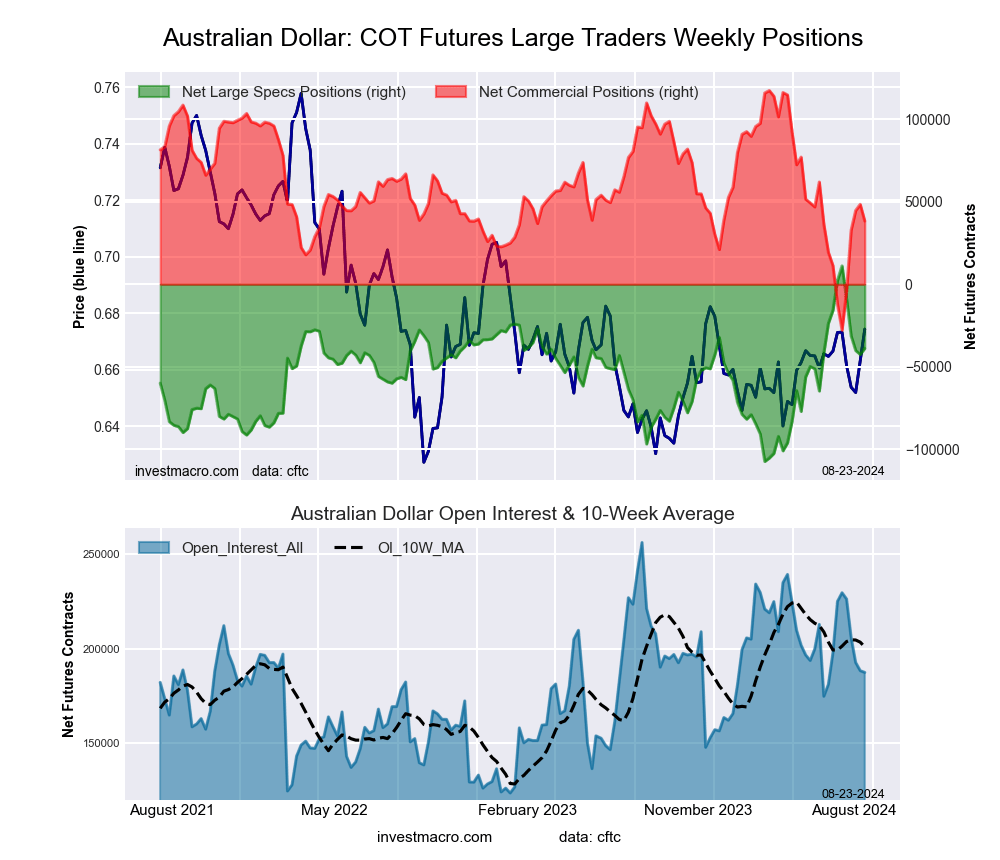 The Australian Dollar large speculator standing this week equaled a net position of -38,885 contracts in the data reported through Tuesday. This was a weekly boost of 3,731 contracts from the previous week which had a total of -42,616 net contracts.
This week’s current strength score (the trader positioning range over the past three years, measured from 0 to 100) shows the speculators are currently Bullish with a score of 57.9 percent. The commercials are Bearish with a score of 45.6 percent and the small traders (not shown in chart) are Bullish with a score of 57.5 percent.
Price Trend-Following Model: Strong Uptrend
Our weekly trend-following model classifies the current market price position as: Strong Uptrend. The current action for the model is considered to be: Hold – Maintain Long Position.
| AUSTRALIAN DOLLAR Statistics | SPECULATORS | COMMERCIALS | SMALL TRADERS |
| – Percent of Open Interest Longs: | 37.7 | 47.7 | 13.5 |
| – Percent of Open Interest Shorts: | 58.4 | 27.3 | 13.2 |
| – Net Position: | -38,885 | 38,366 | 519 |
| – Gross Longs: | 70,554 | 89,429 | 25,338 |
| – Gross Shorts: | 109,439 | 51,063 | 24,819 |
| – Long to Short Ratio: | 0.6 to 1 | 1.8 to 1 | 1.0 to 1 |
| NET POSITION TREND: | | | |
| – Strength Index Score (3 Year Range Pct): | 57.9 | 45.6 | 57.5 |
| – Strength Index Reading (3 Year Range): | Bullish | Bearish | Bullish |
| NET POSITION MOVEMENT INDEX: | | | |
| – 6-Week Change in Strength Index: | -34.8 | 34.7 | -24.0 |
New Zealand Dollar Futures:
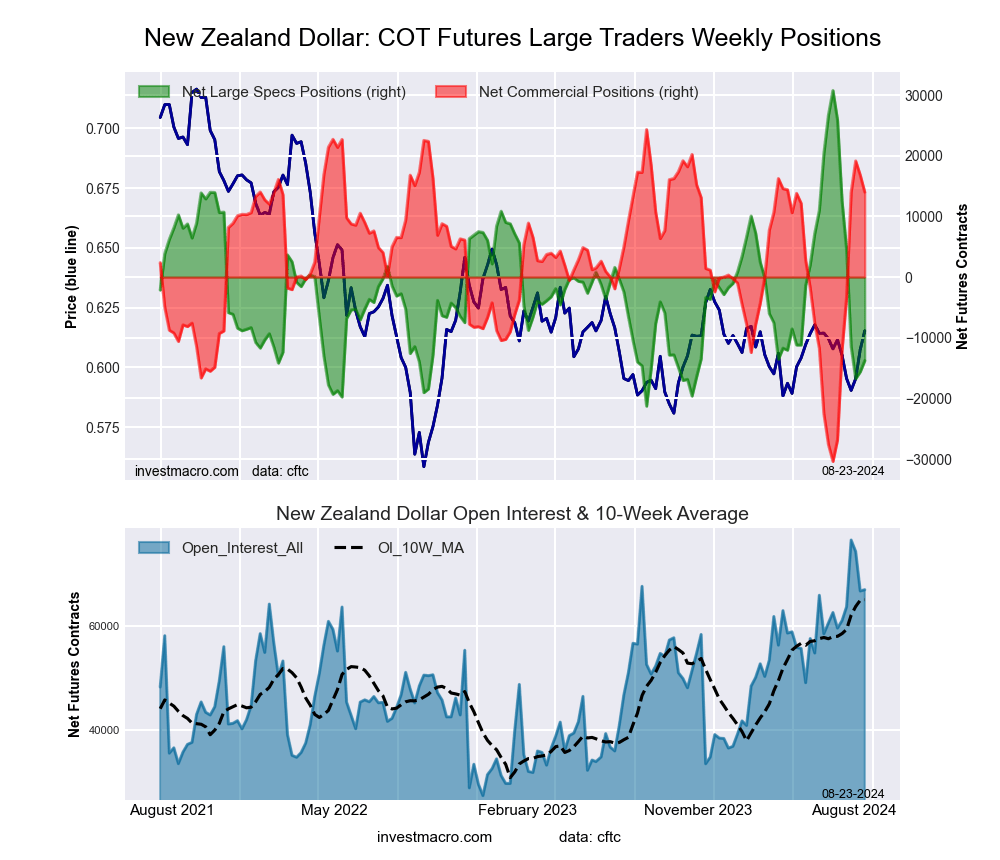 The New Zealand Dollar large speculator standing this week equaled a net position of -13,769 contracts in the data reported through Tuesday. This was a weekly increase of 1,855 contracts from the previous week which had a total of -15,624 net contracts.
This week’s current strength score (the trader positioning range over the past three years, measured from 0 to 100) shows the speculators are currently Bearish-Extreme with a score of 14.4 percent. The commercials are Bullish-Extreme with a score of 81.2 percent and the small traders (not shown in chart) are Bullish with a score of 55.3 percent.
Price Trend-Following Model: Strong Uptrend
Our weekly trend-following model classifies the current market price position as: Strong Uptrend. The current action for the model is considered to be: Hold – Maintain Long Position.
| NEW ZEALAND DOLLAR Statistics | SPECULATORS | COMMERCIALS | SMALL TRADERS |
| – Percent of Open Interest Longs: | 28.3 | 64.2 | 6.7 |
| – Percent of Open Interest Shorts: | 48.9 | 43.2 | 7.0 |
| – Net Position: | -13,769 | 14,000 | -231 |
| – Gross Longs: | 18,887 | 42,907 | 4,465 |
| – Gross Shorts: | 32,656 | 28,907 | 4,696 |
| – Long to Short Ratio: | 0.6 to 1 | 1.5 to 1 | 1.0 to 1 |
| NET POSITION TREND: | | | |
| – Strength Index Score (3 Year Range Pct): | 14.4 | 81.2 | 55.3 |
| – Strength Index Reading (3 Year Range): | Bearish-Extreme | Bullish-Extreme | Bullish |
| NET POSITION MOVEMENT INDEX: | | | |
| – 6-Week Change in Strength Index: | -76.3 | 74.7 | -16.0 |
Mexican Peso Futures:
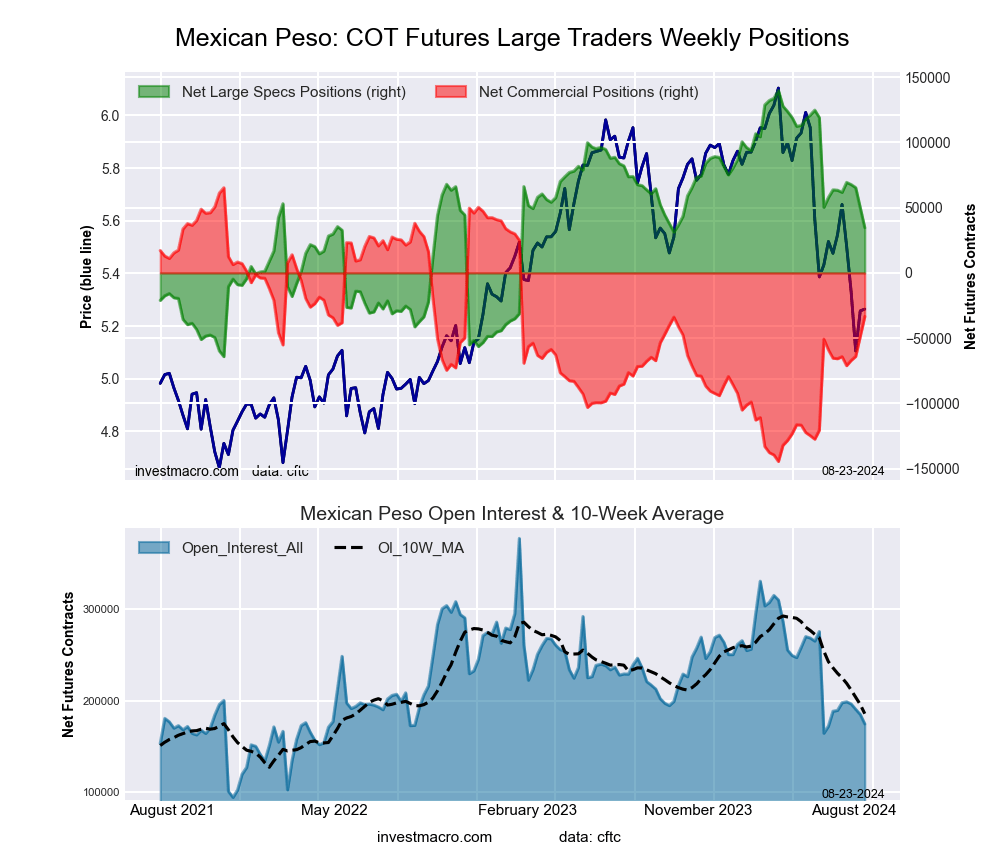 The Mexican Peso large speculator standing this week equaled a net position of 34,646 contracts in the data reported through Tuesday. This was a weekly decrease of -15,448 contracts from the previous week which had a total of 50,094 net contracts.
This week’s current strength score (the trader positioning range over the past three years, measured from 0 to 100) shows the speculators are currently Bearish with a score of 48.5 percent. The commercials are Bullish with a score of 53.0 percent and the small traders (not shown in chart) are Bearish-Extreme with a score of 3.3 percent.
Price Trend-Following Model: Strong Downtrend
Our weekly trend-following model classifies the current market price position as: Strong Downtrend. The current action for the model is considered to be: Hold – Maintain Short Position.
| MEXICAN PESO Statistics | SPECULATORS | COMMERCIALS | SMALL TRADERS |
| – Percent of Open Interest Longs: | 38.2 | 57.3 | 2.3 |
| – Percent of Open Interest Shorts: | 18.4 | 76.5 | 3.0 |
| – Net Position: | 34,646 | -33,410 | -1,236 |
| – Gross Longs: | 66,745 | 100,092 | 3,948 |
| – Gross Shorts: | 32,099 | 133,502 | 5,184 |
| – Long to Short Ratio: | 2.1 to 1 | 0.7 to 1 | 0.8 to 1 |
| NET POSITION TREND: | | | |
| – Strength Index Score (3 Year Range Pct): | 48.5 | 53.0 | 3.3 |
| – Strength Index Reading (3 Year Range): | Bearish | Bullish | Bearish-Extreme |
| NET POSITION MOVEMENT INDEX: | | | |
| – 6-Week Change in Strength Index: | -14.1 | 15.4 | -23.3 |
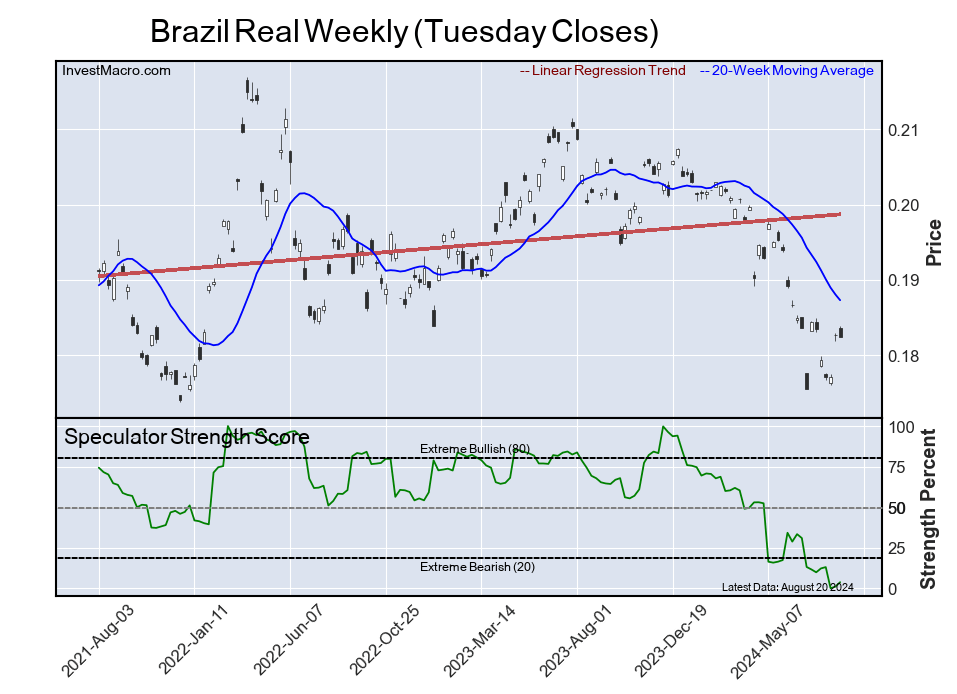
Brazilian Real Futures:
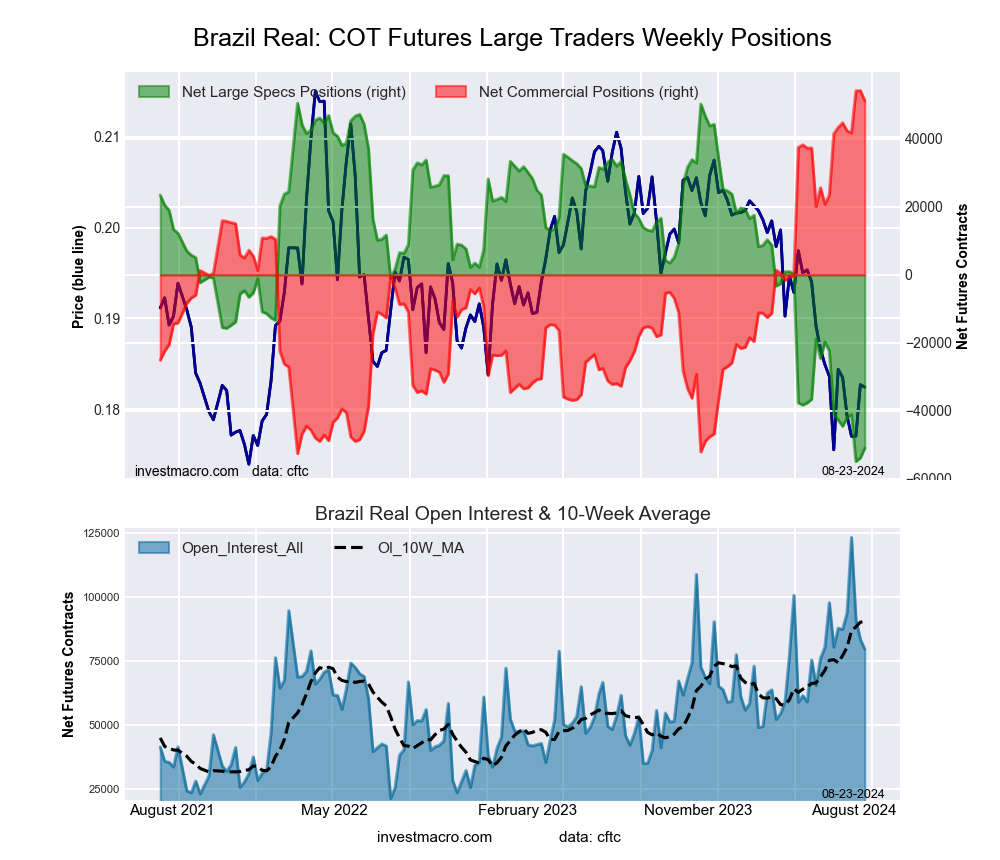 The Brazilian Real large speculator standing this week equaled a net position of -50,955 contracts in the data reported through Tuesday. This was a weekly increase of 2,887 contracts from the previous week which had a total of -53,842 net contracts.
This week’s current strength score (the trader positioning range over the past three years, measured from 0 to 100) shows the speculators are currently Bearish-Extreme with a score of 3.7 percent. The commercials are Bullish-Extreme with a score of 97.2 percent and the small traders (not shown in chart) are Bearish with a score of 31.8 percent.
Price Trend-Following Model: Downtrend
Our weekly trend-following model classifies the current market price position as: Downtrend. The current action for the model is considered to be: Hold – Maintain Short Position.
| BRAZIL REAL Statistics | SPECULATORS | COMMERCIALS | SMALL TRADERS |
| – Percent of Open Interest Longs: | 18.1 | 78.6 | 2.9 |
| – Percent of Open Interest Shorts: | 82.2 | 14.2 | 3.2 |
| – Net Position: | -50,955 | 51,235 | -280 |
| – Gross Longs: | 14,355 | 62,490 | 2,300 |
| – Gross Shorts: | 65,310 | 11,255 | 2,580 |
| – Long to Short Ratio: | 0.2 to 1 | 5.6 to 1 | 0.9 to 1 |
| NET POSITION TREND: | | | |
| – Strength Index Score (3 Year Range Pct): | 3.7 | 97.2 | 31.8 |
| – Strength Index Reading (3 Year Range): | Bearish-Extreme | Bullish-Extreme | Bearish |
| NET POSITION MOVEMENT INDEX: | | | |
| – 6-Week Change in Strength Index: | -7.8 | 7.3 | 3.9 |
Bitcoin Futures:
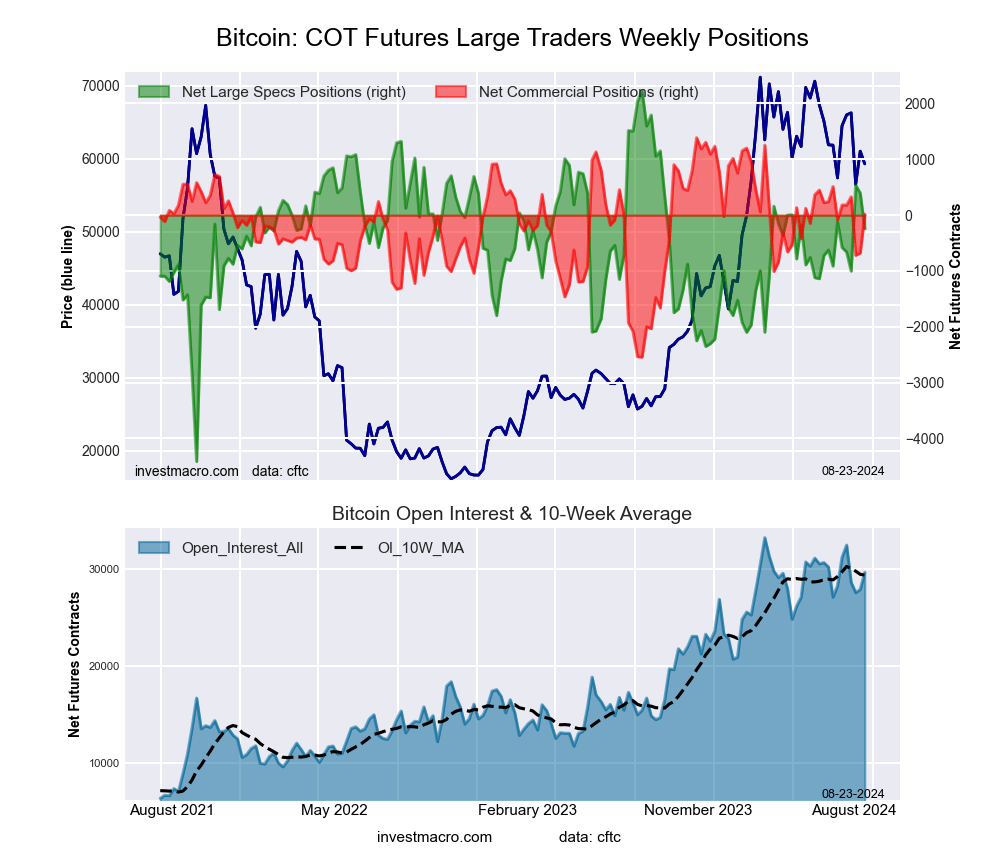 The Bitcoin large speculator standing this week equaled a net position of -243 contracts in the data reported through Tuesday. This was a weekly lowering of -638 contracts from the previous week which had a total of 395 net contracts.
This week’s current strength score (the trader positioning range over the past three years, measured from 0 to 100) shows the speculators are currently Bullish with a score of 62.7 percent. The commercials are Bullish with a score of 65.1 percent and the small traders (not shown in chart) are Bearish-Extreme with a score of 18.1 percent.
Price Trend-Following Model: Downtrend
Our weekly trend-following model classifies the current market price position as: Downtrend. The current action for the model is considered to be: Hold – Maintain Short Position.
| BITCOIN Statistics | SPECULATORS | COMMERCIALS | SMALL TRADERS |
| – Percent of Open Interest Longs: | 81.1 | 3.1 | 4.1 |
| – Percent of Open Interest Shorts: | 81.9 | 3.1 | 3.3 |
| – Net Position: | -243 | 17 | 226 |
| – Gross Longs: | 24,016 | 927 | 1,215 |
| – Gross Shorts: | 24,259 | 910 | 989 |
| – Long to Short Ratio: | 1.0 to 1 | 1.0 to 1 | 1.2 to 1 |
| NET POSITION TREND: | | | |
| – Strength Index Score (3 Year Range Pct): | 62.7 | 65.1 | 18.1 |
| – Strength Index Reading (3 Year Range): | Bullish | Bullish | Bearish-Extreme |
| NET POSITION MOVEMENT INDEX: | | | |
| – 6-Week Change in Strength Index: | -1.9 | 2.7 | 0.5 |
Article By InvestMacro – Receive our weekly COT Newsletter
*COT Report: The COT data, released weekly to the public each Friday, is updated through the most recent Tuesday (data is 3 days old) and shows a quick view of how large speculators or non-commercials (for-profit traders) were positioned in the futures markets.
The CFTC categorizes trader positions according to commercial hedgers (traders who use futures contracts for hedging as part of the business), non-commercials (large traders who speculate to realize trading profits) and nonreportable traders (usually small traders/speculators) as well as their open interest (contracts open in the market at time of reporting). See CFTC criteria here.


 As companies develop satellite constellations as shown in this illustration, they’ll need to repair satellites in orbit.