
By RoboForex Analytical Department
The NZD/USD pair plummeted to 0.5892, marking a significant three-month low. The New Zealand dollar remains under pressure as the US dollar gains strength due to the start of the Federal Reserve’s two-day meeting.
The Fed is expected to leave the interest rate in the target range of 5.25-5.50% this time. At the same time, the market eagerly anticipates clear signals regarding the September meeting, when borrowing costs are expected to be lowered.
A week earlier, the NZD fell by almost 2% against the USD due to overly large-scale risk aversion in the global market, reduced carry trade positions with JPY, and China’s relatively sluggish macroeconomic background.
Expectations regarding the Reserve Bank of New Zealand’s future steps also exert fundamental pressure on the NZD. The main forecast assumes that the RBNZ will lower the interest rate soon. At the moment, investors take a rate cut at the August meeting with a 44% probability, which is quite a lot, given all the inputs.
Technical Analysis of NZD/USD
Free Reports:
 Get our Weekly Commitment of Traders Reports - See where the biggest traders (Hedge Funds and Commercial Hedgers) are positioned in the futures markets on a weekly basis.
 Sign Up for Our Stock Market Newsletter – Get updated on News, Charts & Rankings of Public Companies when you join our Stocks Newsletter
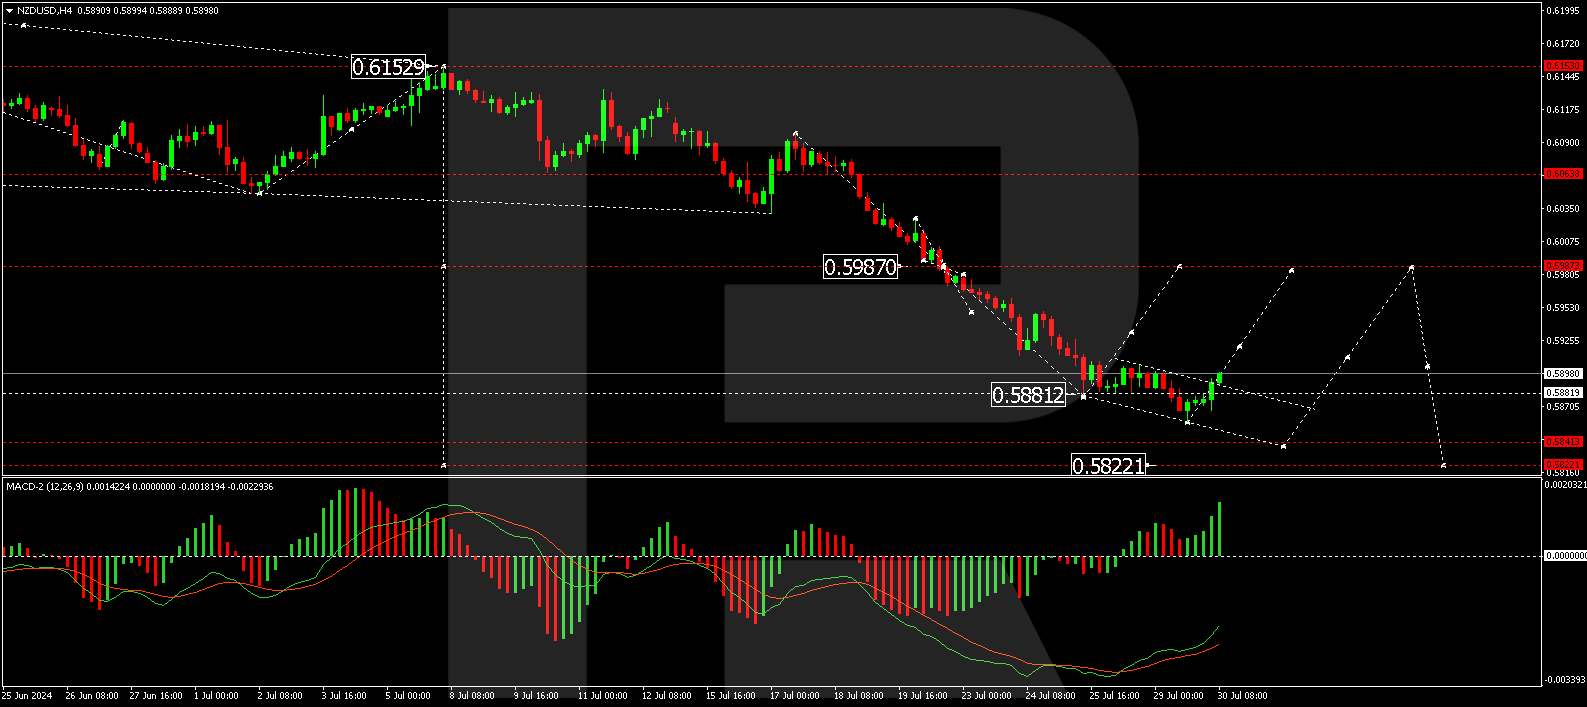
On the H4 chart of NZD/USD, the market executed a wave of decline to the level of 0.5858. Today, the market is correcting this wave of decline. We expect a growth link to the level of 0.5903. If this level is breached upwards, the correction continuing to 0.5987 (test from below) is possible. After the correction is completed, we will consider the beginning of a new wave of decline to the level of 0.5840 with the prospect of trend continuation to the level of 0.5822. Technically, this scenario is confirmed by the MACD indicator. Its signal line is under the zero mark and is directed strictly upwards.
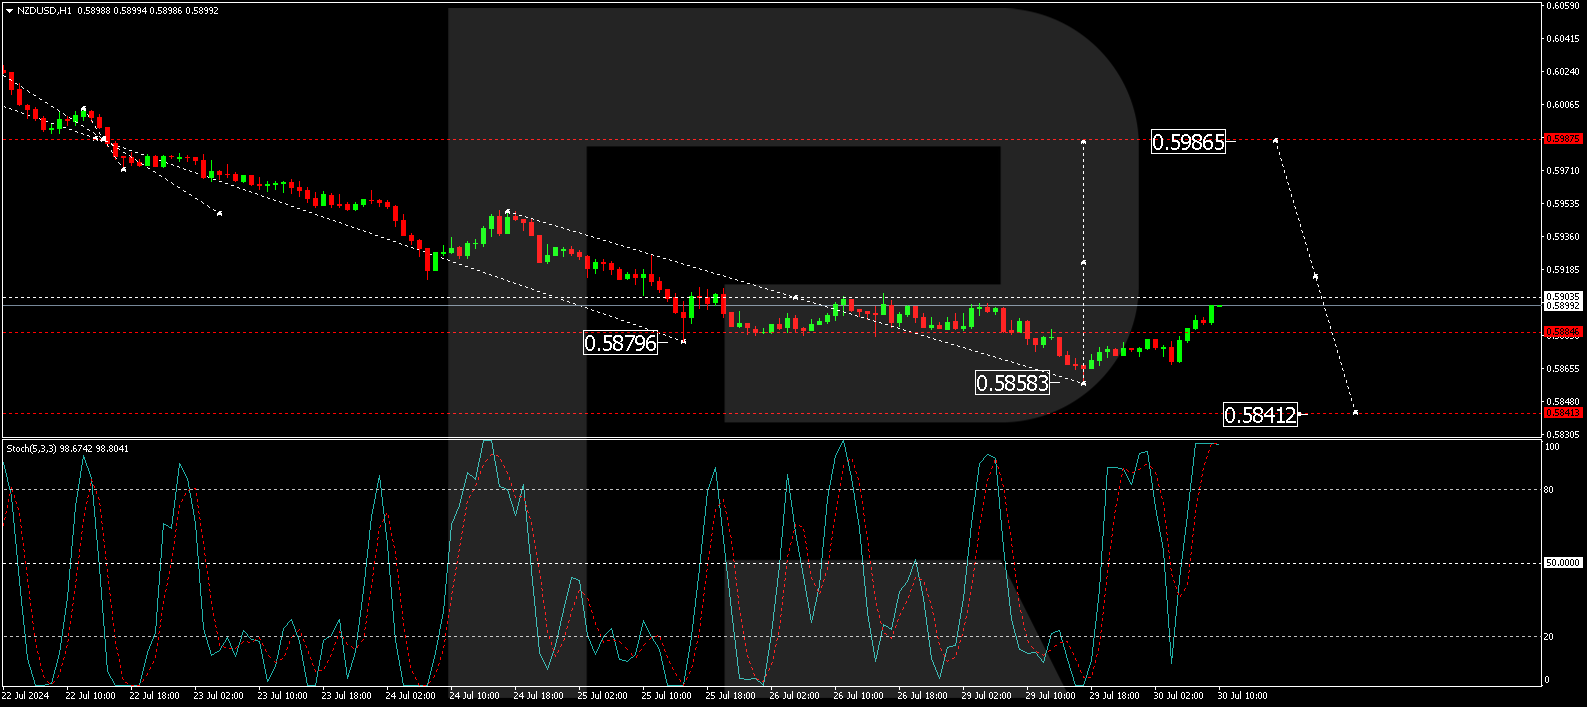
On the H1 chart of NZD/USD, the market is forming a growth structure towards the level of 0.5903. After working off this level, we will consider the probability of a decline to the level of 0.5884 (test from above). Then, we will consider the likelihood of another growth structure to the level of 0.5986. Technically, this scenario is confirmed by the Stochastic oscillator. Its signal line is above the 80 mark. We expect a decline to the level of 50 and further to the level of 20.
Disclaimer
Any forecasts contained herein are based on the author’s particular opinion. This analysis may not be treated as trading advice. RoboForex bears no responsibility for trading results based on trading recommendations and reviews contained herein.

- Geopolitical and macroeconomic conditions continue to pressure market sentiment Jul 20, 2026
- USD/JPY Poised to Continue Gains as Expensive Oil and Lack of Support Weigh on Yen Jul 20, 2026
- COT Metals Charts: Weekly Speculator Bets led by Copper & Steel Jul 18, 2026
- COT Bonds Charts: Weekly Speculator Bets led by 2-Year, SOFR 3M & 5-Year Bonds Jul 18, 2026
- COT Energy Charts: Weekly Speculator Bets led by Brent Oil & Heating Oil Jul 18, 2026
- COT Soft Commodities Charts: Weekly Speculator Bets led by Wheat, Corn & Soybean Meal Jul 18, 2026
- The Bank of Canada kept its interest rate unchanged. Platinum prices reached a three‑week high Jul 16, 2026
- Stock indices rose after the release of US inflation data. China’s GDP slowed sharply Jul 15, 2026
- GBP/USD Awaits Political News: What Will Happen Next Jul 15, 2026
- USD/JPY Holds at Highs: Pressure Lingers on Yen Jul 14, 2026