The Analytical Overview of the Main Currency Pairs on 2020.08.12

by JustForex

The EUR/USD currency pair

Technical indicators of the currency pair:
  • Prev Open: 1.17365
  • Open: 1.17404
  • % chg. over the last day: +0.03
  • Day’s range: 1.17112 – 1.17607
  • 52 wk range: 1.0777 – 1.1781

There is an ambiguous technical pattern on the EUR/USD currency pair. The trading instrument is consolidating. Financial market participants expect additional drivers. The demand for greenback is supported by the growth of US government bonds yield. At the moment, the local support and resistance levels are 1.1710 and 1.1765, respectively. We recommend opening positions from these marks.

The news feed on 2020.08.12:
  • – Report on inflation in the US at 15:30 (GMT+3:00).
EUR/USD

The indicators do not give accurate signals: the price has crossed the 50 MA.

The MACD histogram is in the negative zone, but above the signal line, which gives a weak signal to sell EUR/USD.

Stochastic Oscillator is in the neutral zone, the %K line is above the %D line, which indicates the bullish sentiment.

Trading recommendations
  • Support levels: 1.1710, 1.1700, 1.1670
  • Resistance levels: 1.1765, 1.1800, 1.1845

If the price fixes below 1.1710, EUR/USD quotes are expected to fall further. The movement is tending to 1.1670-1.1650.

An alternative could be the growth of the EUR/USD currency pair to 1.1800-1.1830.

The GBP/USD currency pair

Technical indicators of the currency pair:
  • Prev Open: 1.30582
  • Open: 1.30496
  • % chg. over the last day: -0.17
  • Day’s range: 1.30171 – 1.30673
  • 52 wk range: 1.1466 – 1.3516

GBP/USD quotes have been declining. The British pound has updated local lows. The UK reported that the country’s GDP decreased by 20.4% (q/q) in the second quarter, which is the record reduction among the largest economies. At the moment, the local support and resistance levels are 1.3020 and 1.3065, respectively. The trading instrument has the potential for further decline. Positions should be opened from key levels.

We recommend paying attention to the news feed from the US.

GBP/USD

Indicators do not give accurate signals: the price is testing 50 MA.

The MACD histogram is in the negative zone, but above the signal line, which gives a weak signal to sell GBP/USD.

Stochastic Oscillator is in the neutral zone, the %K line is above the %D line, which indicates the bullish sentiment.

Trading recommendations
  • Support levels: 1.3020, 1.2980, 1.2950
  • Resistance levels: 1.3065, 1.3100, 1.3130

If the price fixes below 1.3020, a further drop in GBP/USD quotes is expected. The movement is tending to 1.2980-1.2950.

An alternative could be the growth of the GBP/USD currency pair to 1.3100-1.3130.

The USD/CAD currency pair

Technical indicators of the currency pair:
  • Prev Open: 1.33508
  • Open: 1.33010
  • % chg. over the last day: -0.37
  • Day’s range: 1.32906 – 1.33469
  • 52 wk range: 1.2949 – 1.4668

USD/CAD quotes are in a sideways trend. There is no defined trend. At the moment, the local support and resistance levels are 1.3290 and 1.3345, respectively. The USD/CAD currency pair is tending to decline. We recommend paying attention to the dynamics of oil prices. Positions should be opened from key levels.

The news feed on Canada’s economy is calm.

USD/CAD

Indicators do not give accurate signals: 50 MA has crossed 100 MA.

The MACD histogram is near the 0 mark.

Stochastic Oscillator is in the neutral zone, the %K line is below the %D line, which indicates the bearish sentiment.

Trading recommendations
  • Support levels: 1.3290, 1.3270, 1.3240
  • Resistance levels: 1.3345, 1.3370, 1.3400

If the price fixes below 1.3290, USD/CAD quotes are expected to fall. The movement is tending to 1.3250-1.3230.

An alternative could be the growth of the USD/CAD currency pair to 1.3370-1.3400.

The USD/JPY currency pair

Technical indicators of the currency pair:
  • Prev Open: 105.936
  • Open: 106.487
  • % chg. over the last day: +0.50
  • Day’s range: 106.441 – 106.828
  • 52 wk range: 101.19 – 112.41

The USD/JPY currency pair shows a pronounced uptrend. The trading instrument has overcome and fixed above the key extremes. At the moment, the USD/JPY quotes are consolidating in the range of 106.45-106.80. We recommend paying attention to the dynamics of US government bonds yield. The greenback is tending to grow further against the yen. Positions should be opened from key levels.

The news feed on Japan’s economy is calm.

USD/JPY

Indicators signal the power of buyers: the price has fixed above 50 MA and 100 MA.

The MACD histogram is in the positive zone, which indicates the bullish sentiment.

Stochastic Oscillator is near the overbought zone, the %K line has crossed the %D line. There are no signals at the moment.

Trading recommendations
  • Support levels: 106.45, 106.20, 105.80
  • Resistance levels: 106.80, 107.30, 107.50

If the price fixes above the level of 106.80, further growth of USD/JPY quotes is expected. The movement is tending to 107.20-107.50.

An alternative could be a decline in the USD/JPY currency pair to 106.00-105.80.

by JustForex

Ichimoku Cloud Analysis 12.08.2020 (USDJPY, XAUUSD, USDRUB)

Article By RoboForex.com

USDJPY, “US Dollar vs Japanese Yen”

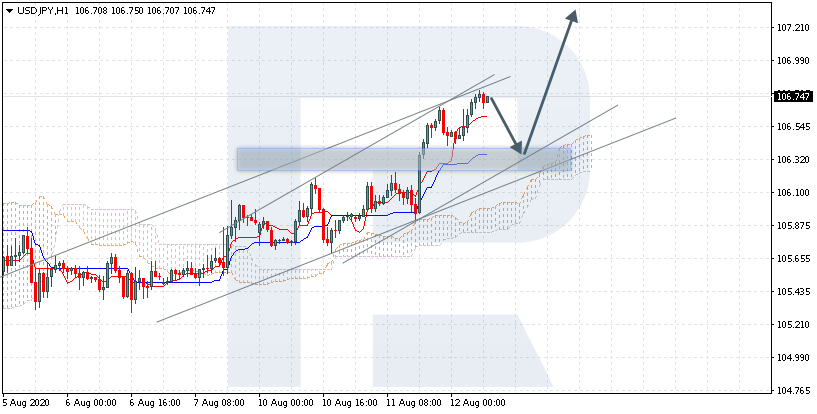
USDJPY is trading at 106.74; the instrument is moving above Ichimoku Cloud, thus indicating an ascending tendency. The markets could indicate that the price may test Tenkan-Sen and Kijun-Sen at 106.35 and then resume moving upwards to reach 107.35. Another signal is favor of further uptrend will be a rebound from the rising channel’s downside border. However, the bullish scenario may no longer be valid if the price breaks the cloud’s downside border and fixes below 105.65. In this case, the pair may continue falling towards 104.75.

USDJPY
Risk Warning: the result of previous trading operations do not guarantee the same results in the future

XAUUSD, “Gold vs US Dollar”

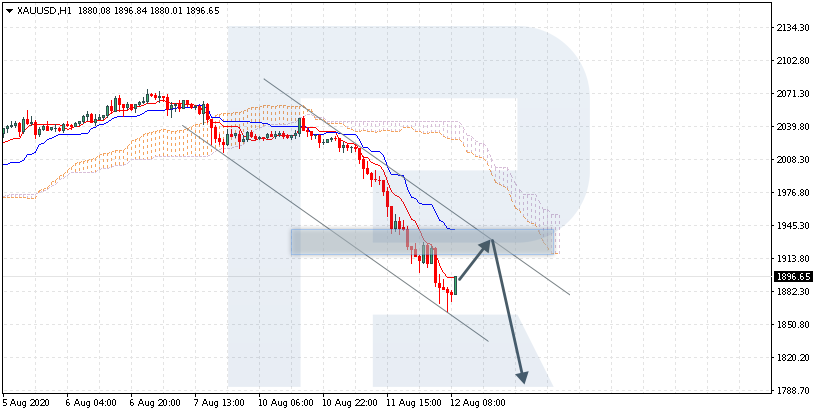
XAUUSD is trading at 1896.00; the instrument is moving below Ichimoku Cloud, thus indicating a descending tendency. The markets could indicate that the price may test Tenkan-Sen and Kijun-Sen at 1915.00 and then resume moving downwards to reach 1785.00. Another signal in favor of further downtrend will be a rebound from the descending channel’s upside border. However, the bearish scenario may no longer be valid if the price breaks the cloud’s upside border and fixes above 1985.00. In this case, the pair may continue growing towards 2075.00.

XAUUSD
Risk Warning: the result of previous trading operations do not guarantee the same results in the future

USDRUB, “US Dollar vs Russian Ruble”

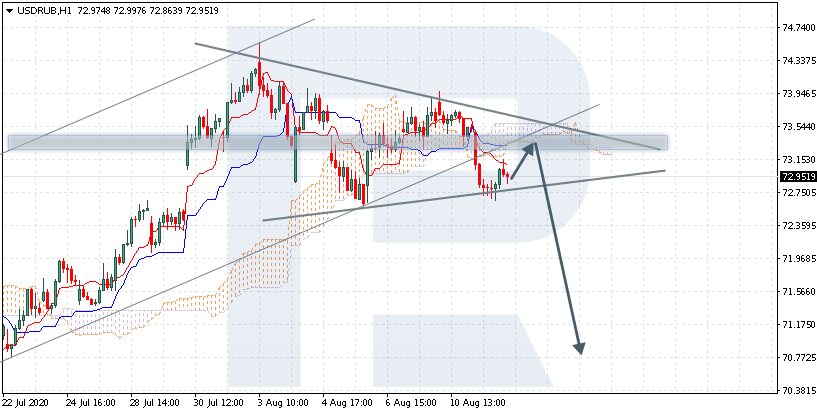
USDRUB is trading at 72.95; the instrument is moving below Ichimoku Cloud, thus indicating a descending tendency. The markets could indicate that the price may test the cloud’s downside border at 73.25 and then resume moving downwards to reach 70.80. Another signal in favor of further downtrend will be a rebound from the upside border of the Triangle pattern. However, the bearish scenario may be canceled if the price breaks the cloud’s upside border and fixes above 74.05. In this case, the pair may continue growing towards 75.25. To confirm further decline, the asset must break the pattern’s downside border and fix below 72.35.

USDRUB

Article By RoboForex.com

Attention!
Forecasts presented in this section only reflect the author’s private opinion and should not be considered as guidance for trading. RoboForex LP bears no responsibility for trading results based on trading recommendations described in these analytical reviews.

Adaptive Fibonacci Price Modeling System Suggests Market Peak May Be Near

By TheTechnicalTraders 

– Our Adaptive Fibonacci Price Modeling system is suggesting a moderate price peak may be already setting up in the NASDAQ while the Dow Jones, S&P500, and Transportation Index continue to rally beyond the projected Fibonacci Price Expansion Levels.  This indicates that capital may be shifting away from the already lofty Technology sector and into Basic Materials, Financials, Energy, Consumer Staples, Utilities, as well as other sectors.

This type of a structural market shift indicates a move away from speculation and towards Blue Chip returns. It suggests traders and investors are expecting the US consumer to come back strong (or at least hold up the market at least) over the next 6+ months.

SHIFTING MARKET SECTORS COULD CATCH TRADERS OFF-GUARD

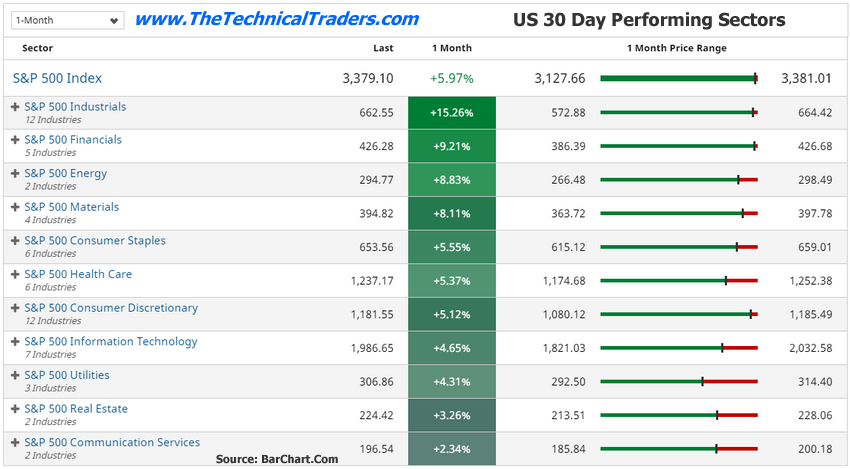
Recently, a moderately large shift away from Technology and Biotech has taken place where traders and investors have started to move capital away from these high-flying sectors and into more traditional market sectors like the Industrials, Financials, Energy, Materials amongst others.  This type of shift takes place when traders and investors believe a consumer-based economy will dominate essential components within the markets and when technology or price speculation has driven stock price levels to near extreme levels. Take a look below for a list of the top-performing sectors over the last 30 days.

We like to think of these things in terms of simple supply and demand.  When price levels reach extreme highs and buyers no longer believe the valuation levels to be accurate (or overvalued), then buying activity slows or stops. Buyers will start to seek our other assets that appear to be undervalued as there is a greater chance to profit from those assets.

It appears that traders are now shifting into consumer staples, energy, materials, and financials, expecting market support for the remainder of 2020 to come from the things that people cannot live without. This could mean the high flying NASDAQ and Bio-Tech sector may be left wanting for the next 4+ months or longer.

FIBONACCI PRICE RANGES SUGGEST A PEAK MAY BE NEAR

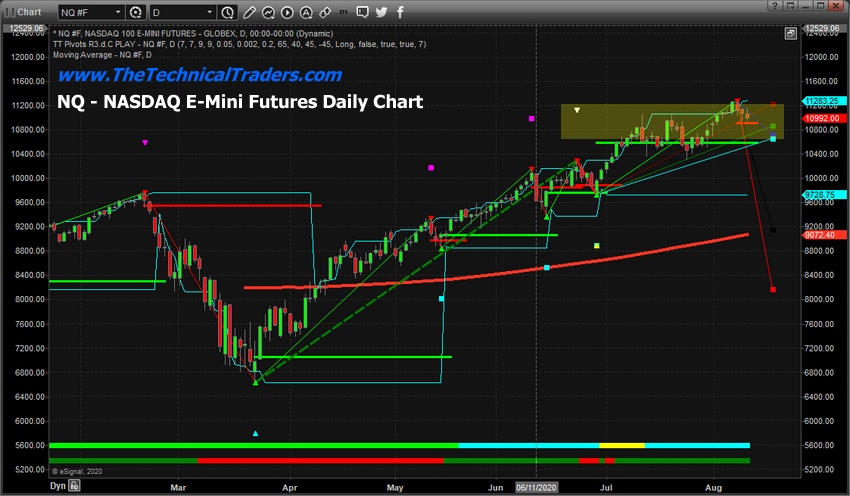
Our proprietary Fibonacci Price Modeling system assists us in learning where and when price levels have reached critical turning points and nearing exhaustion points  The NASDAQ Daily chart below highlights our Fibonacci Price Modeling system. It shows a YELLOW Rectangle that spans the range of the upside Fibonacci projected price expansion level from the lows in late June 2020.  Notice how price rallied above the 10,600 price level in mid-July, then began to weaken and rotate between 10,600 and 11,300.  The projected Fibonacci Price Expansion levels suggested price would attempt to move into this range as the main Resistance area.  Of course, price could continue to rally beyond these ranges in strong momentum – which we’ve seen in the past.

If the shift in capital away from the NASDAQ pushes price levels below 10,915 on a closing price basis, then the Daily chart will confirm a new potential BEARISH price trend in the NASDAQ which could see price levels falling to 10,650, 9,175, or 8,190.  Each of these lower Fibonacci price expansion levels are adapted to the current range of price rotation (peaks and troughs) setup over the past 280+ days.  Thus, our Fibonacci Price Modeling system attempts to adapt to price ranges and rotation in a way that presents very real trigger levels and targets for future price activity.

Be sure to sign up for our free market trend analysis and signals now so you don’t miss our next special report!

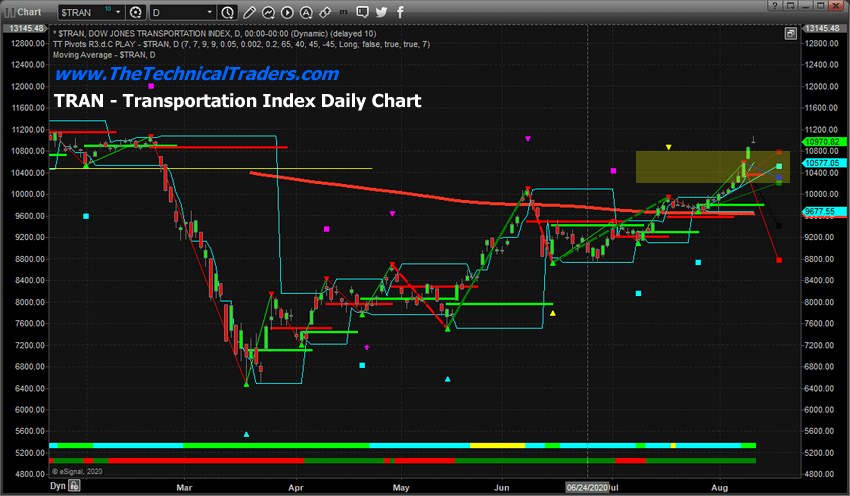
This next chart, the Transportation Index Daily chart, also suggests that price levels have already breached the Fibonacci Projected Price Expansion levels.  As such, the Transportation Index may have already breached key resistance – pushing into a Scouting Pattern type of price formation.  This is where price attempts to “scout out” a price area that is somewhat “alien” to normal price ranges.  If strong support if found above this resistance level, then prices will hold above the resistance level and attempt to move higher.  If support is not found in the scouting area, then price will almost immediately fall back into the resistance area and consolidate or initiate a new downside price trend.

The YELLOW Rectangle area on the chart above highlights the Fibonacci Price Expansion levels presented by the Fibonacci Price Modeling system.  Any rally beyond these projected expansion levels would suggest a massive shift in capital is taking place where price momentum, traders piling into the shifting trading environment, are driving price activity well beyond normal Fibonacci price expansion ranges.

MOVING AVERAGES ALSO SUGGEST A PEAK

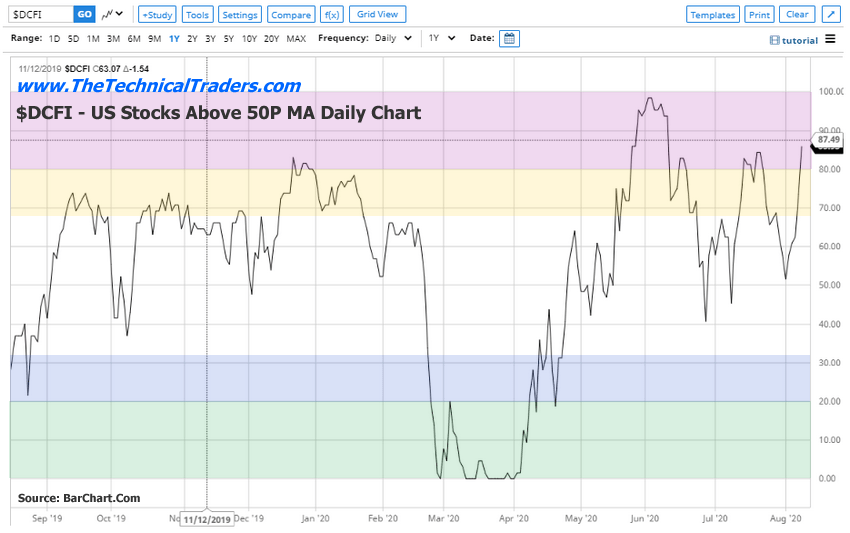
As you can see from the chart below, the number of stocks above the 50-period Moving Average (MA) level has climbed to 87.49.  In layman terms, this means that nearly 90% of all stocks (within the Dow Comp) are above their 50-period MA is near extremely high levels.  Historically, when this indicator reaches above 85~90, price peaks usually set up within 5 to 7+ trading days prompting a downside price trend that may last 10 to 30+ days.

Additionally, over the past 12+ months, we can see that the current level of this indicator is near the highest levels reached at any other time over the past 12+ months.  This suggests that the US stock market has currently reached overbought levels that are moderately extreme.  We would expect this indicator to rotate lower, possibly reaching levels near 35 to 45 from these current peak levels.

Recently, we published a research article that suggested the SPY and TRAN (Transportation Index) appear to have another 2 to 4% (or more) to the upside before reaching a full 100% measured move.  After the past two days of strong upside price activity, we believe we are nearing a peak in price levels and urge traders to take precautions – protect open long positions.  The NASDAQ appears to be much weaker than the Dow Jones or S&P500 right now – yet all of these US major indexes appear to be nearing a peak level.

The breakdown of Gold and Silver today suggest that metals may have moved beyond critical support on panic buying.  A similar type of downside price move could take place in the US major indexes if traders suddenly realize price levels have been pushed “too far to the upside”…  particularly in the NASDAQ.

Pay attention to our research and please protect your assets and family.  The process of global recovery after the COVID-19 virus is likely to take years.  There will be very big and incredible opportunities for skilled technical traders over that time.  Learn how we can help you trade and find success in these markets – sign up for my Active ETF Swing Trade Signals today!

If you have a buy-and-hold account (like retirement accounts) and are looking for technical signals for when to own equities, bonds, or cash, be sure to subscribe to my Passive Long-Term ETF Investing Signals, for which we expect to issue a new signal for subscribers soon. Stay healthy and rest easy at night by staying informed through our services – sign up today!

Chris Vermeulen
Chief Market Strategist
Founder of Technical Traders Ltd.

NOTICE: Our free research does not constitute a trade recommendation, investment or trading advice, or solicitation for our readers to take any action regarding this research.  It is provided for educational purposes only.  Our research team produces these research articles to share information with you in an effort to try to keep you well informed.  Visit our web site (TheTechnicalTraders.com) to learn how to take advantage of our members-only research and trading signals.


Fibonacci Retracements Analysis 12.08.2020 (GBPUSD, EURJPY)

Article By RoboForex.com

GBPUSD, “Great Britain Pound vs US Dollar”

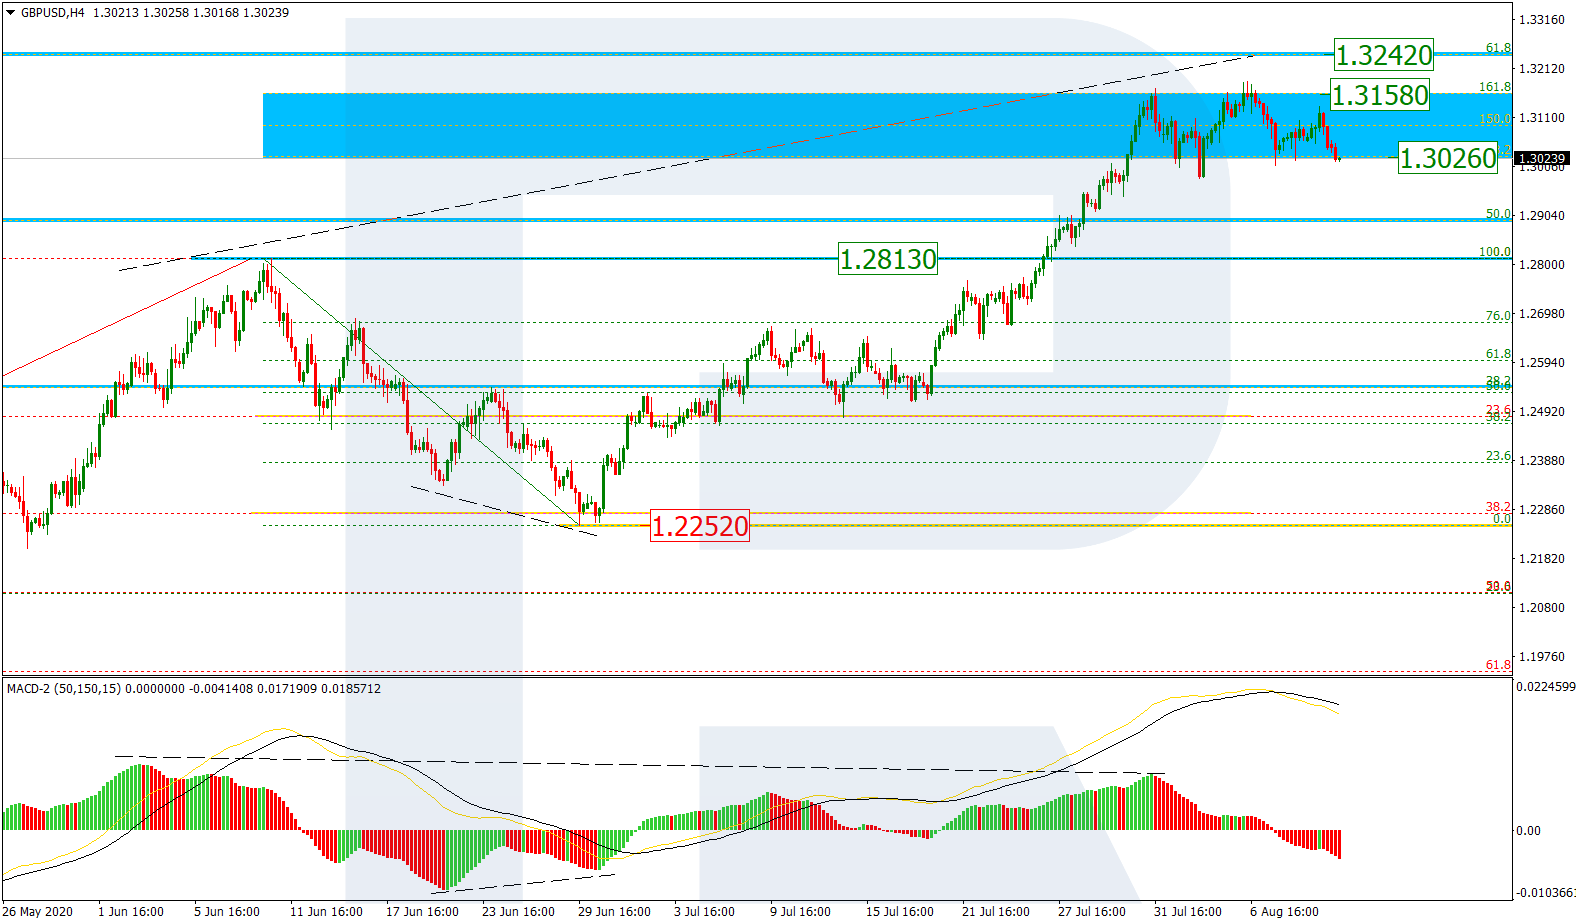
As we can see in the H4 chart, GBPUSD is moving inside the post-correctional extension area between 138.2% and 161.8% fibo at 1.3026 and 1.3158 respectively. At the same time, the MACD indicator is forming a divergence, which may hint at a possible correction. The target of this pullback may be a test of the area close to the earlier broken high at 1.2813. After completing the correction, the next rising impulse may be heading towards the long-term 61.8% fibo at 1.3243.

GBPUSD_H4
Risk Warning: the result of previous trading operations do not guarantee the same results in the future

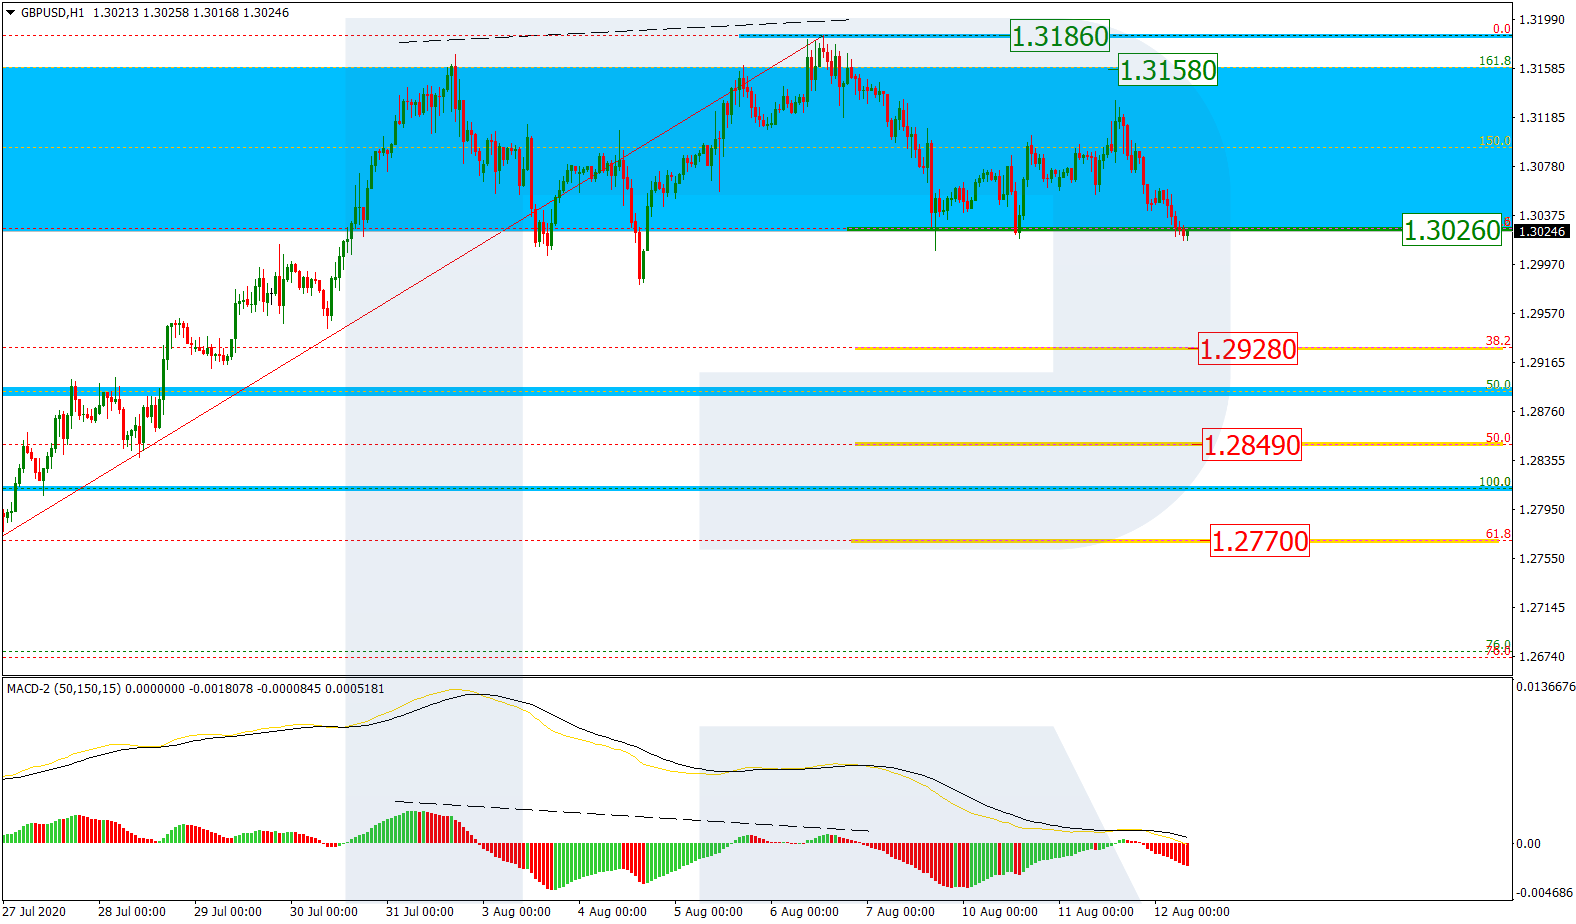
In the H1 chart, the divergence on MACD made the price start a new correction, which has already reached 23.6% fibo. The next correctional downside targets may be 38.2%, 50.0%, and 61.8% fibo at 1.2928, 1.2849, and 1.2770 respectively. However, if the price breaks the high at 1.3186, the instrument may continue the uptrend.

GBPUSD_H1
Risk Warning: the result of previous trading operations do not guarantee the same results in the future

EURJPY, “Euro vs. Japanese Yen”

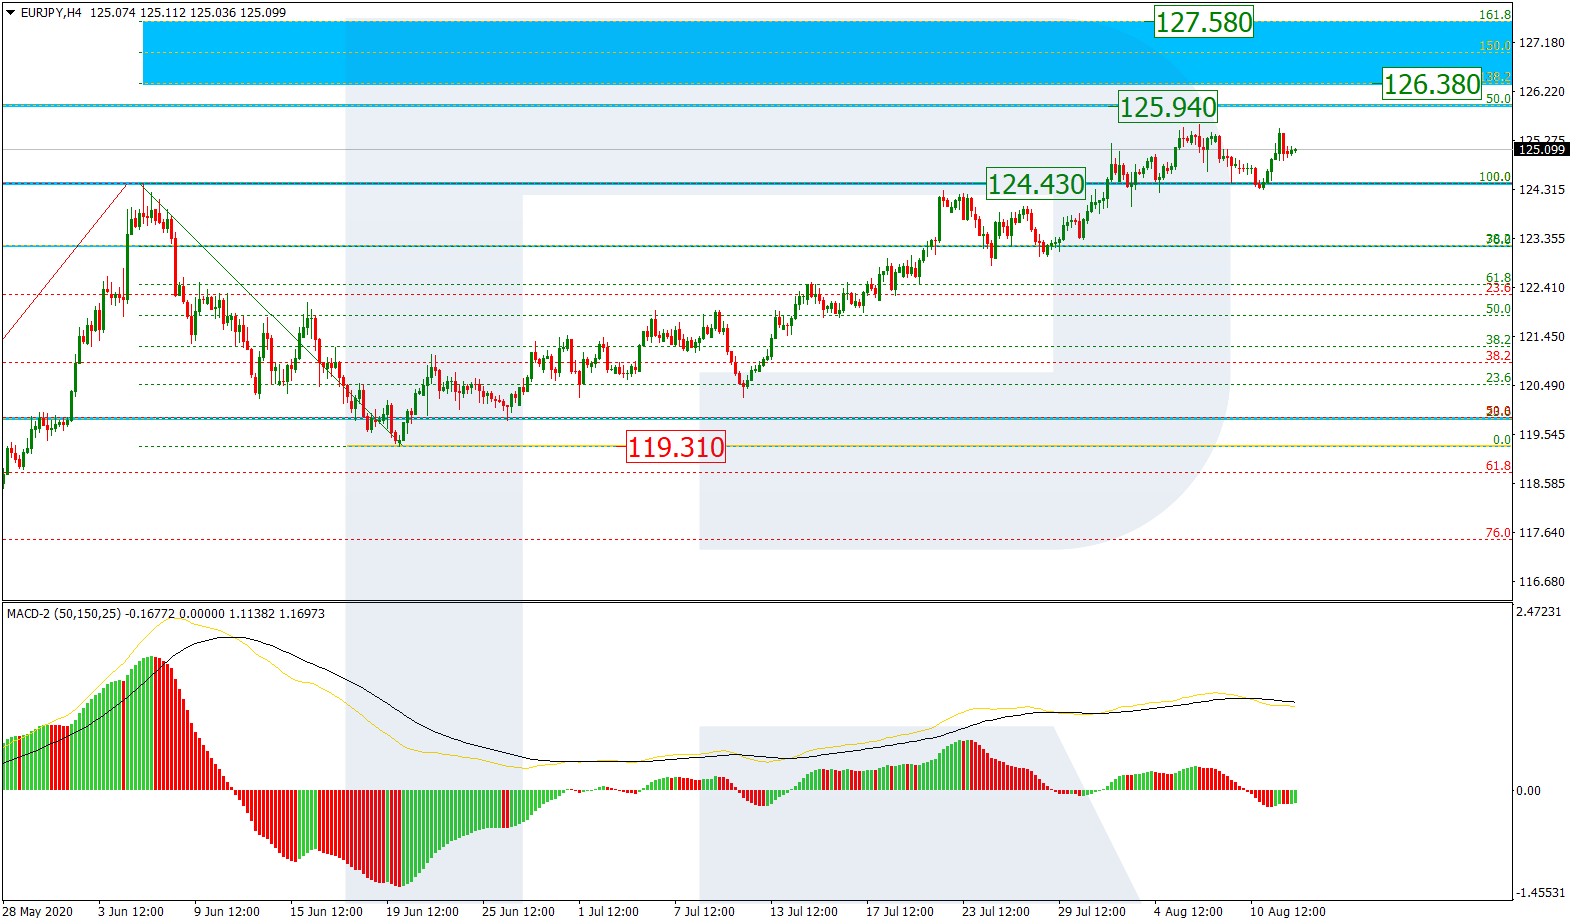
As we can see in the H4 chart, after completing a short-term pullback towards the earlier broken high at 124.43, EURJPY is forming a new rising impulse towards the long-term 50.0% fibo at 125.94 and then the post-correctional extension area between 138.2% and 161.8% fibo at 126.38 and 127.57 respectively. The support is the fractal low at 119.31.

EURJPY_H4
Risk Warning: the result of previous trading operations do not guarantee the same results in the future

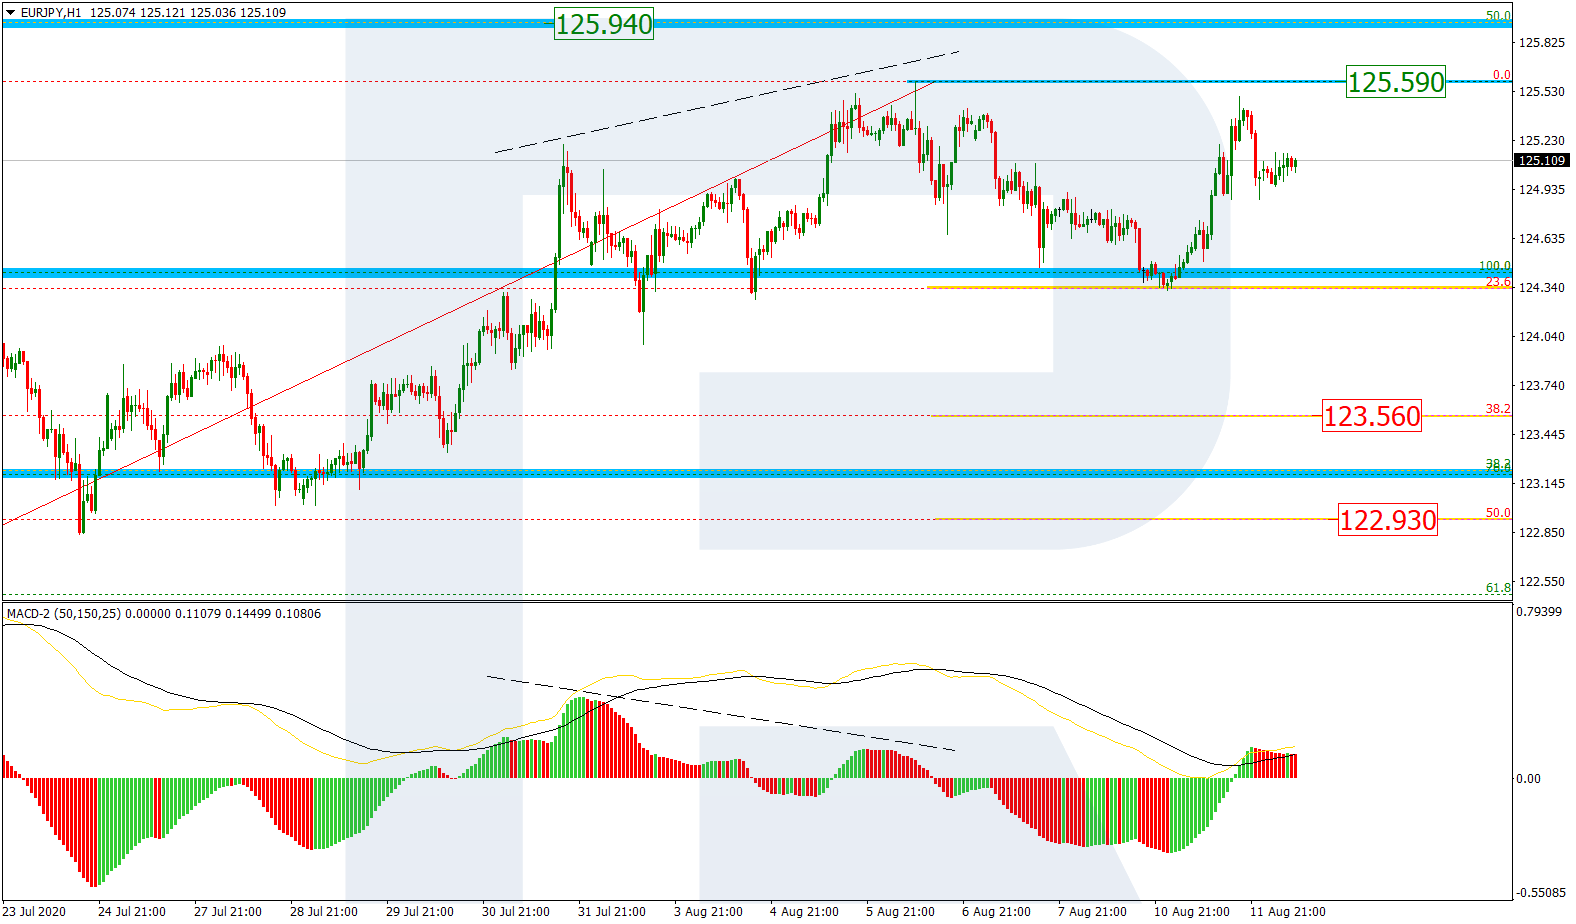
In the H1 chart, the instrument is correcting after a local divergence on MACD. The first descending impulse has already reached 23.6% fibo. However, a following ascending structure may be heading towards the high at 125.59. If the price fails to break the high, the instrument may resume trading downwards to reach 38.2% and 50.0% fibo at 123.56 and 122.93.

EURJPY_H1

Article By RoboForex.com

Attention!
Forecasts presented in this section only reflect the author’s private opinion and should not be considered as guidance for trading. RoboForex LP bears no responsibility for trading results based on trading recommendations described in these analytical reviews.

UK recession will prompt investors to consider overseas options

By George Prior

– A growing number of UK and global investors are likely to move their assets overseas as Britain enters its worst recession in history, affirms the boss of one of the world’s largest independent financial advisory and fintech organizations.

The observation from Nigel Green, founder and chief executive of deVere Group, which has $12bn under advisement, comes as it is revealed that the UK economy suffered its biggest drop on record between April and June as coronavirus lockdown measures pushed the country officially into recession.

The economy contracted by 20.4% compared with the first three months of the year.

Mr Green notes: “As was expected, Britain is now officially in recession.  It’s the deepest recession in UK history and the deepest of any G7 country.

“Whilst the economy grew 8.7% in June, which beat economic estimates, and confirms a recovery is now underway, the real test will be after the summer when there are no more national lockdown-easing measures to lift the economic spirits, more local restrictions are likely to be imposed and as significant programmes such as the furlough scheme which has protected jobs come to a halt.

“All of this creates ever more uncertainty in the UK economy.”

He continues: “UK and global investors will be becoming increasingly nervous of this worrying situation and can be expected to take precautionary measures to insulate themselves against a potential fall in the value of UK-based financial assets.

“A growing number inevitably and quite sensibly are likely to be looking to grow and safeguard their wealth by moving assets overseas through various established international financial solutions.

“The pace of this trend, I believe, will increase over the next few months as the issues intensify.”

The deVere CEO goes on to add that the confirmation of a recession “may be a good excuse to start that much-needed rebalancing in favour of global stocks, bonds, currencies and perhaps property.”

The weak economy also further boosts the chances of tax hikes and relief cuts in the UK November Budget.

“It is highly likely taxes will rise and reliefs be cut. Possible targets for hikes could include income tax for higher earners, capital gains tax, inheritance tax, and VAT.

“In addition, new wealth taxes may be brought in, which was something the Prime Minister was considering before the pandemic hit,” notes Mr Green.

These potential changes in the Budget can be expected to prompt those overseas with financial ties to the country, to look into the international options available to them.

He concludes: “Now could be a good time to revise your financial planning strategies to ensure you’re best-positioned to be able to grow and protect your wealth.”

About:

deVere Group is one of the world’s largest independent advisors of specialist global financial solutions to international, local mass affluent, and high-net-worth clients.  It has a network of more than 70 offices across the world, over 80,000 clients and $12bn under advisement.

Gold with first weekly close above 2,000 USD – further gains ahead?

By Admiral Markets

Economic events August 12 2020

Source: Economic Events August 12, 2020 – Admiral Markets’ Forex Calendar

With a closing above 2,000 USD last Friday, the yellow metal saw its first-ever weekly close above this level. Despite the sell-off on Tuesday in which the precious metal lost more than 5%, or dropped more than 100 USD per ounce, the most in one day since 2013, we don’t see any reason why the sharp rise in the precious metal won’t continue.

One main reason for yesterday’s sharp drop was certainly the extended trend on the upside.

But this is amidst ongoing printing of trillions of dollars from the US central bank, which is needed as a stimulus to tide the U.S. economy over during the coronavirus pandemic.

And while negotiations between Democrats and Republicans in the US to hammer out a stimulus relief package are still ongoing, with US President Trump having signed a series of executive orders extending coronavirus economic relief to US Americans, it seems likely that further fiscal stimulus will come sooner rather than later in one way or another. It is also clear that such a relief package must be financed somehow – most likely with freshly printed USD from the FED.

Thus, with ETF demand still on the rise, currently amounting to around the equivalent of 3,376 tons of Gold in ETFs and US 10-year yields remaining under pressure, driving real yields to under 1%, a short-term stint to as high as 2,500/2,600 USD seems a serious possibility.

An initial impulse could be delivered if US inflation sees a small uptick in today’s data, even though, technically, the extended trend and aggressive wash out of weak hands yesterday could easily continue, with the precious metal finding a potential long trigger near the former All Time High around the 1,900/920 USD region, or a little lower at around 1,850 USD.

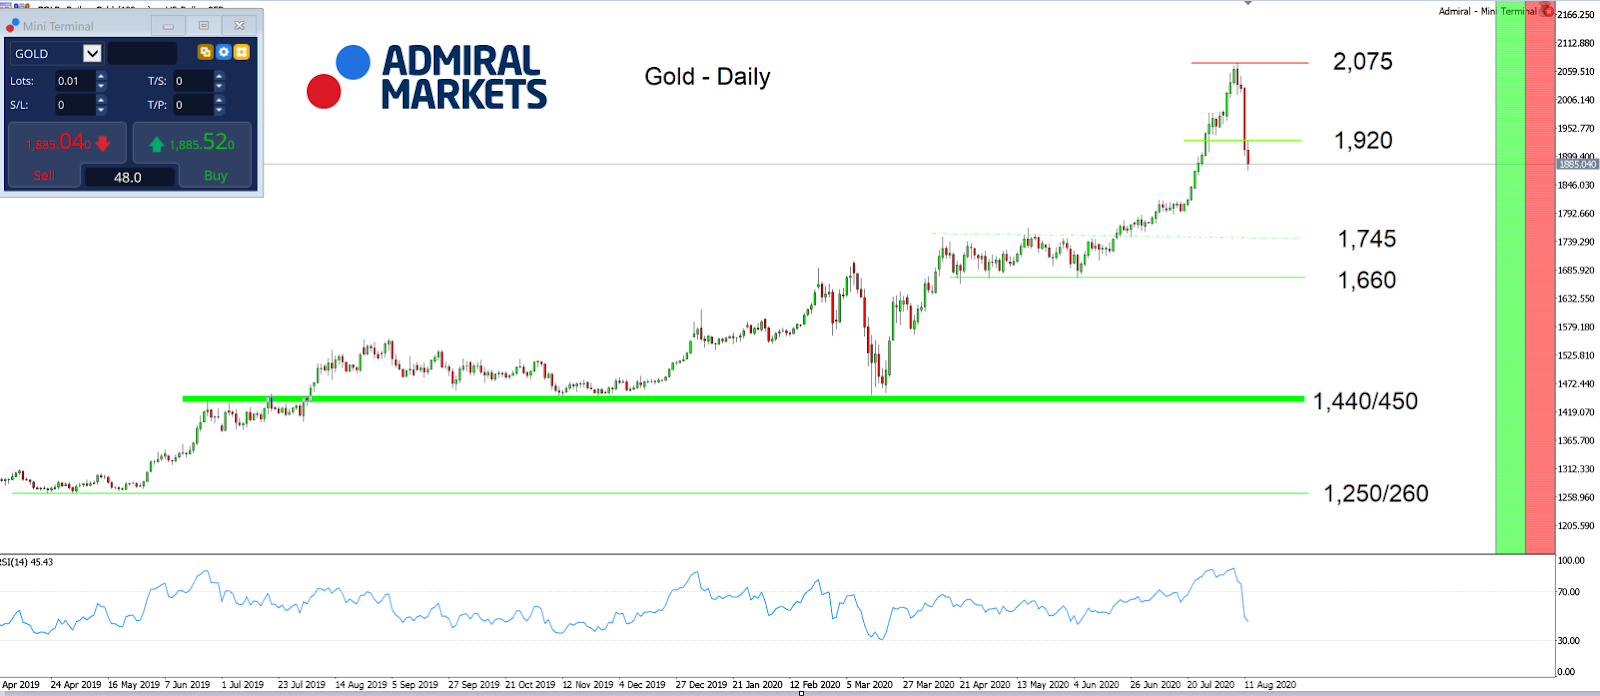
In general, the bullish trend remains intact as long as we are trading above 1,660 USD:

Gold daily chart

Source: Admiral Markets MT5 with MT5-SE Add-on Gold Daily chart (between April 1, 2019, to August 12, 2020). Accessed: August 12, 2020, at 04:00 PM GMTPlease note: Past performance is not a reliable indicator of future results or future performance.

In 2015, the value of Gold fell by 10.4%. In 2016, it rose by 8.1%. In 2017, it increased by 13.1%. In 2018, it fell by 1.6%, and in 2019, it increased by 18.9%, meaning that after five years, it was up 28%.

Discover the world’s #1 multi-asset platform

Admiral Markets offers professional traders the ability to trade with a custom, upgraded version of MetaTrader 5, allowing you to experience trading at a significantly higher, more rewarding level. Experience benefits such as the addition of the Market Heat Map, so you can compare various currency pairs to see which ones might be lucrative investments, access real-time trading data, and so much more. Click the banner below to start your FREE download of MT5 Supreme Edition!

Trade With MetaTrader 5

Disclaimer: The given data provides additional information regarding all analysis, estimates, prognosis, forecasts or other similar assessments or information (hereinafter “Analysis”) published on the website of Admiral Markets. Before making any investment decisions please pay close attention to the following:

  1. This is a marketing communication. The analysis is published for informative purposes only and are in no way to be construed as investment advice or recommendation. It has not been prepared in accordance with legal requirements designed to promote the independence of investment research, and that it is not subject to any prohibition on dealing ahead of the dissemination of investment research.
  2. Any investment decision is made by each client alone whereas Admiral Markets shall not be responsible for any loss or damage arising from any such decision, whether or not based on the Analysis.
  3. Each of the Analysis is prepared by an independent analyst (Jens Klatt, Professional Trader and Analyst, hereinafter “Author”) based on the Author’s personal estimations.
  4. To ensure that the interests of the clients would be protected and objectivity of the Analysis would not be damaged Admiral Markets has established relevant internal procedures for prevention and management of conflicts of interest.
  5. Whilst every reasonable effort is taken to ensure that all sources of the Analysis are reliable and that all information is presented, as much as possible, in an understandable, timely, precise and complete manner, Admiral Markets does not guarantee the accuracy or completeness of any information contained within the Analysis. The presented figures refer that refer to any past performance is not a reliable indicator of future results.
  6. The contents of the Analysis should not be construed as an express or implied promise, guarantee or implication by Admiral Markets that the client shall profit from the strategies therein or that losses in connection therewith may or shall be limited.
  7. Any kind of previous or modeled performance of financial instruments indicated within the Publication should not be construed as an express or implied promise, guarantee or implication by Admiral Markets for any future performance. The value of the financial instrument may both increase and decrease and the preservation of the asset value is not guaranteed.
  8. The projections included in the Analysis may be subject to additional fees, taxes or other charges, depending on the subject of the Publication. The price list applicable to the services provided by Admiral Markets is publicly available from the website of Admiral Markets.
  9. Leveraged products (including contracts for difference) are speculative in nature and may result in losses or profit. Before you start trading, you should make sure that you understand all the risks.

By Admiral Markets

Gold seeing “healthy” pullback

By Han Tan, Market Analyst, ForexTime

It was overdue for a pullback, and boy, are we getting one.

Spot Gold has now fallen into sub-$1900 levels as it extends yesterday’s steep drop. Tuesday’s 5.69 percent decline was Bullion’s largest single-day decline since 2013, with much of the stellar gains seen over the past two weeks now wiped out. At the time of writing, Gold futures are shedding another 2.6 percent.

From a technical perspective, the jarring move was needed to pull Bullion away from ‘overbought’ territory, ending Gold’s three-week period when its 14-day relative strength index was above the 70 mark.

There appears to be some serious profit-taking going on, as investors rotate funds back into other asset classes, especially considering the swath of US Treasuries that’s being brought to market this week. US real yields pulling back above minus one percent for the first time this month is denting some of Gold’s allure and prompting investors to sell off Bullion.

While we may see a period of consolidation for Gold prices, the overall bullish case appears intact. In other words, there are still plenty of sound reasons to think that Gold prices can resume its climb.

Although 10-year US Treasury yields climbed to 0.64 percent at the time of writing, it remains far off from pre-pandemic levels of above one percent, while real yields are still in negative territory. There also remains lingering concerns over the outlook for the global economy, even as geopolitical risks continue to simmer in the background. While the Dollar index is trying to claw its way back to the 94 handle, investors continue to expect more weakness for the Dollar, and the softer Greenback offers little resistance to Gold’s upside.

Bullion has been guided steadily upwards by its 50-day simple moving average (SMA) since Q2, apart from the brief dip below the line in early June. This trend is expected to remain intact, although it also implies that the pullback may still have some ways to go before spot Gold gets reacquainted with its 50-day SMA once more.


Disclaimer: The content in this article comprises personal opinions and should not be construed as containing personal and/or other investment advice and/or an offer of and/or solicitation for any transactions in financial instruments and/or a guarantee and/or prediction of future performance. ForexTime (FXTM), its affiliates, agents, directors, officers or employees do not guarantee the accuracy, validity, timeliness or completeness, of any information or data made available and assume no liability as to any loss arising from any investment based on the same.


Forex-Time-LogoArticle by ForexTime

ForexTime Ltd (FXTM) is an award winning international online forex broker regulated by CySEC 185/12 www.forextime.com

UK economy nosedives into recession

By Lukman Otunuga, Research Analyst, ForexTime

It is official, the UK economy has entered a recession for the first time in 11 years!

Economic growth during the second quarter of 2020 was a horror show, plunging 20.4% after a 2.2% fall in the first three months of 2020. This was the worst GDP seen in Western Europe and clearly illustrated the damaging impacts of coronavirus to the UK economy. To rub salt into the wound, it was only yesterday that data revealed an estimated one million jobs had already been erased during the coronavirus induced lockdown.

Surprisingly, the British Pound offered a fairly muted reaction despite the UK stumbling into the largest recession on record. The currency slightly gained against the Dollar and held its ground against other G10 currencies on Wednesday morning. It looks like the disappointing GDP report was already priced in with investors now evaluating how quickly the UK economy can bounce back. Expect the Pound to become highly sensitive to economic data over the next few weeks as investors access if a V-shaped bounce back could still be on the cards. After today, market players may start questioning whether looser monetary policy and handsome fiscal packages have the ability to revive the UK economy.

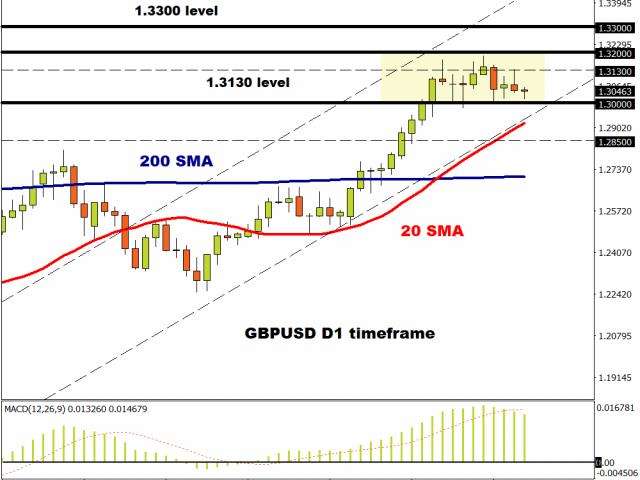
Looking at the technical picture, the GBPUSD remains in a wide range on the daily timeframe with support at 1.3000 and resistance at 1.3200. Prices are trading above 20 & 200 Simple Moving Average while the MACD trades to the upside. The trend is bullish but some fatigue looks to be kicking in with bears eyeing the 1.3000 support. It is worth keeping in mind that the GBPUSD has been stuck between these level’s for the past two weeks with bears constantly pressing against 1.3000.

A solid breakdown below 1.3000 could encourage a decline towards 1.2850. Alternatively, if this level proves to be a tough nut to crack, then a rebound towards 1.3130 could be on the cards.

Disclaimer: The content in this article comprises personal opinions and should not be construed as containing personal and/or other investment advice and/or an offer of and/or solicitation for any transactions in financial instruments and/or a guarantee and/or prediction of future performance. ForexTime (FXTM), its affiliates, agents, directors, officers or employees do not guarantee the accuracy, validity, timeliness or completeness, of any information or data made available and assume no liability as to any loss arising from any investment based on the same.


Forex-Time-LogoArticle by ForexTime

ForexTime Ltd (FXTM) is an award winning international online forex broker regulated by CySEC 185/12 www.forextime.com

ORANGE: Technical setup bearish for orange price

By IFCMarkets.com

Technical setup bearish for orange price

Florida orange growers experienced a disastrous 2019-20 season with regard to farm prices – average farm prices plummeted 50-56% from average prices in 2018-19. The reasons cited for the drop in orange juice prices include high orange juice inventories held by Florida processors combined with high juice imports and declining orange juice sales at retail outlets. And the technical bias for price is bearish currently. On the other hand, inventories of single-strength, chilled orange juice fell 9.3% through May 30 compared to a year earlier, according to Citrus Department statistics. And single-strength orange juice imports declined by 40% during the same period. Retail orange juice sales rose 1% in the US through April 11. Falling orange juice supply and higher sales are upside risk for orange juice price.

IndicatorVALUESignal
RSINeutral
MACDSell
Donchian ChannelNeutral
MA(100)Sell
FractalsSell
Parabolic SARSell


Summary of technical analysis

OrderSell
Buy stopBelow 112.93
Stop lossAbove 125.15

Market Analysis provided by IFCMarkets.com

Cyberspace is critical infrastructure – it will take effective government oversight to make it safe

By Francine Berman, Rensselaer Polytechnic Institute

A famous 1990s New Yorker cartoon showed two dogs at a computer and a caption that read “On the Internet, nobody knows you’re a dog.” The cartoon represents a digital past when people required few safeguards on the internet. People could explore a world of information without having every click tracked or their personal data treated as a commodity.

The New Yorker cartoon doesn’t apply today. Not only do your browser, service provider and apps know you’re a dog, they know what breed you are, what kind of dog food you eat, who your owner is and where your doghouse is. Companies are parlaying that information into profit.

Legal and regulatory protections in cyberspace have not kept up with the times. They are better suited to the internet of the past than the present. Today’s dependence on the internet has thrust society into a new era, making effective public protections critical for a healthy cyberspace.

The COVID-19 pandemic has made cyberspace critical infrastructure. When schools, stores, restaurants and community gathering places closed, the U.S. went online and digital technologies became the primary platform for education, grocery delivery, services and many workplaces.

In the last four months, I’ve attended a Zoom funeral, a Zoom wedding and taken ballet classes online. This fall I’ll teach online. Many of the shifts from on-site to online are here to stay, and I predict the “new normal” will put much more emphasis on interacting in cyberspace.

This creates new urgency for public protections. As former head of a national Supercomputer Center and a data scientist, I’ve seen that digital exploitation of personal information is the pandemic in cyberspace. It puts individuals and society at risk.

The need for government action

Public leadership is needed to solve this public problem. But for the most part, the federal government has left the private sector to regulate itself. Today, data is a commodity, and relying on the fox to guard the henhouse has not brought the needed protections.

Evidence of digital exploitation is everywhere. Online dating services Grindr, Tinder and OKCupid share personal data on sexual orientation and location with advertisers. Commercial data brokers sell lists of “dementia sufferers” and “Hispanic payday loan responders” to predators and others. Cambridge Analytica used personal information to manipulate a presidential election. Before public outcry, Zoom handed over user information to Facebook. High school students, peaceful protesters and others have become targets of mass surveillance and facial recognition.

Experiences with data protection regulation in Europe and California demonstrate that getting protections right is complicated and politically fraught, and many people have little confidence in government protection or effectiveness. But with cyberspace serving as public infrastructure, I believe safeguards must come from the public sector.

Regulating protections

So what needs to be done? Political leaders can initiate digital reforms by enacting effective legislation and empowering independent oversight agencies. Federal efforts to safeguard Americans in other areas provide a blueprint: The Health Insurance Portability and Accountability Act protects private health information. The Occupational Safety and Health Administration mandates protective gear to keep workplaces safe. The Food and Drug Administration works to ensure that drugs are safe to ingest.

In these instances, government stepped in because industry could or would not, and companies in these sectors conform to government expectations for public protections or pay a price.

Cyberspace needs the same strategies. Multiple bills in the 116th Congress could provide a baseline for federal digital reforms.

The most comprehensive of the bunch, according to the Electronic Privacy Information Center, is Reps. Eshoo and Lofgren’s Online Privacy Act. This bill would promote individuals’ rights to access, control and delete personal data. Sen. Gillibrand’s Data Protection Act would create an independent Data Protection Agency, needed to monitor and enforce public protections. Sen. Markey’s Facial Recognition and Biometric Technology Moratorium Act would ban federal use of facial recognition technology.

Despite the urgency of enacting privacy protections in the wake of COVID-19, Congress has yet to hold hearings, invite experts or seek public comment on these bills.

First steps

Passing legislation now is important because building healthy digital infrastructure takes time. Legislation and policy are only the first step. When digital reforms are enacted, technology companies will need to design new protections into existing and next-generation digital products, services, protocols and algorithms. This could change the software architectures of everything from baby monitors to Fitbits to Facebook.

Digital protections will need to be monitored and effectively enforced by independent federal agencies. They will impact business models in Silicon Valley and the marketplace for information. They will constrain the way the private sector deploys surveillance technologies, accumulates huge personal digital profiles and exploits data.

[Understand new developments in science, health and technology, each week. Subscribe to The Conversation’s science newsletter.]

With unconstrained digital exploitation, the privacy and safety of cyberspace will continue to erode and with it the social fabric. Digital reform is the basis for a healthy cyberspace where users control what personal data is collected and how it is used, where digital products and services meet standards for privacy, safety and security, and where individuals can opt out and still function without commercial penalty.

Cyberspace can function as critical infrastructure only when it’s safe for everyone. Federal digital reforms are stuck in committee; redesigning cyberspace for protections later will limit effectiveness. Safeguards must be incorporated into today’s and tomorrow’s digital products now, including new surveillance technologies and AI. Congress must take the lead to effectively contain the digital exploitation pandemic and make cyberspace safe for the public.The Conversation

About the Author:

Francine Berman, Hamilton Distinguished Professor of Computer Science, Rensselaer Polytechnic Institute

This article is republished from The Conversation under a Creative Commons license. Read the original article.