Risk on: Russia registers vaccine

By Han Tan, Market Analyst, ForexTime

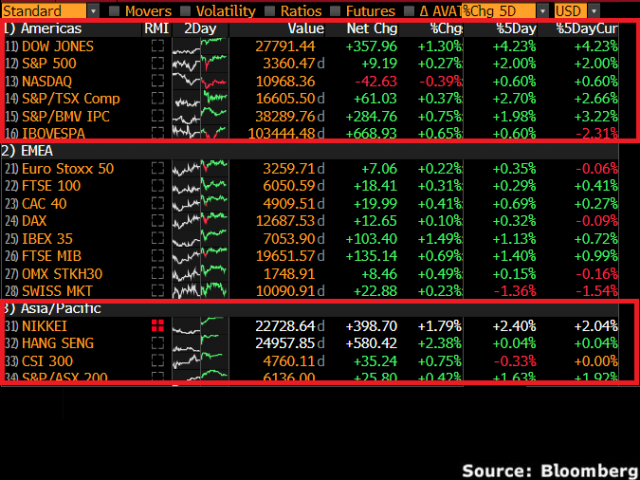
US benchmark stock indices are set for gains when markets open today, fuelled by positive developments surrounding a Covid-19 vaccine. Russia announced today that it has registered the world’s first Covid-19 vaccine, while drug makers such as BioNTech, Novavax, and Inovio Pharmaceuticals say they are moving closer to their respective vaccines, with these stocks making some of the biggest pre-market moves.

Such developments are pushing the SP500 minis to about 0.5 percent, or a mere 18 points, away from its record high.

The headlines have also contributed to Gold prices hurtling back below the psychologically-important $2000 level. Bullion has fallen by some 2.3 percent so far today, which would mark its biggest single-day move since April. The news may have spurred on the technical pullback needed to bring Gold prices away from overbought territory. With a flood of US Treasuries being brought to market this week, there could also be some profit-taking in Bullion prices at play.

Risk appetite has also seen other tailwinds, including news that US President Donald Trump is considering a tax cut for capital gains. Investors outlook surrounding Germany, Europe’s largest economy, over the next 6 months also registered a positive surprise. Such headlines make for a risk-on mood, emboldening investors who continue to remain optimistic over the global economic recovery.


Disclaimer: The content in this article comprises personal opinions and should not be construed as containing personal and/or other investment advice and/or an offer of and/or solicitation for any transactions in financial instruments and/or a guarantee and/or prediction of future performance. ForexTime (FXTM), its affiliates, agents, directors, officers or employees do not guarantee the accuracy, validity, timeliness or completeness, of any information or data made available and assume no liability as to any loss arising from any investment based on the same.


Forex-Time-LogoArticle by ForexTime

ForexTime Ltd (FXTM) is an award winning international online forex broker regulated by CySEC 185/12 www.forextime.com

Murrey Math Lines 11.08.2020 (AUDUSD, NZDUSD)

Article By RoboForex.com

AUDUSD, “Australian Dollar vs US Dollar”

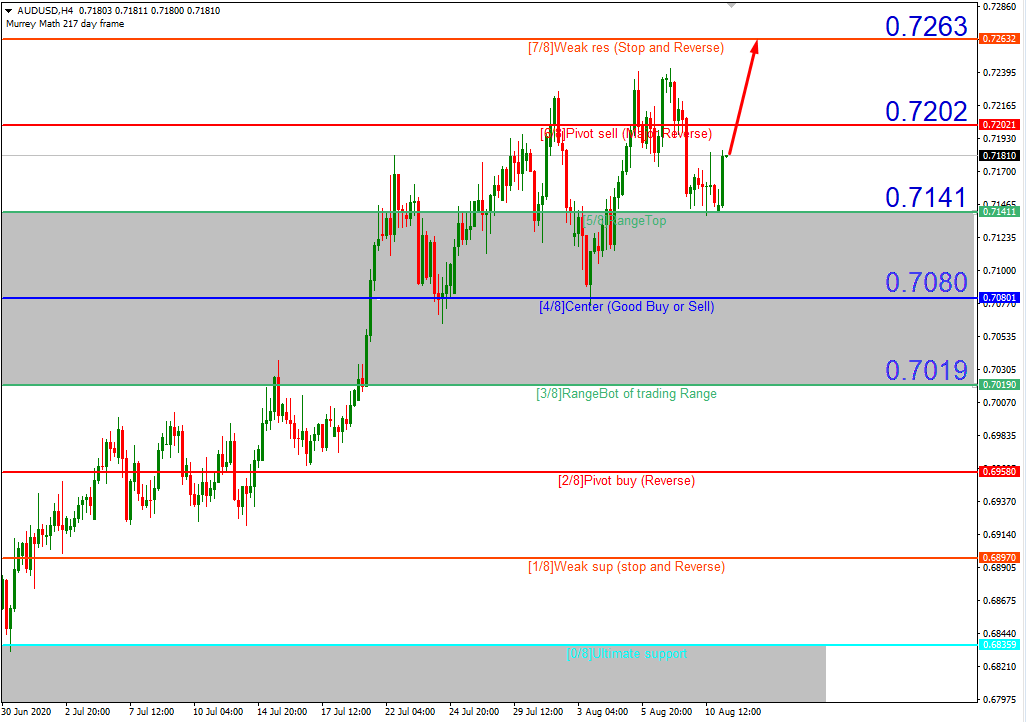
In the H4 chart, after rebounding from 5/8, AUDUSD is expected to resume growing to reach the resistance at 7/8. However, this scenario may be canceled if the price breaks 5/8 to the downside. After that, the instrument may continue falling towards the support at 4/8.

AUDUSD_H4
Risk Warning: the result of previous trading operations do not guarantee the same results in the future

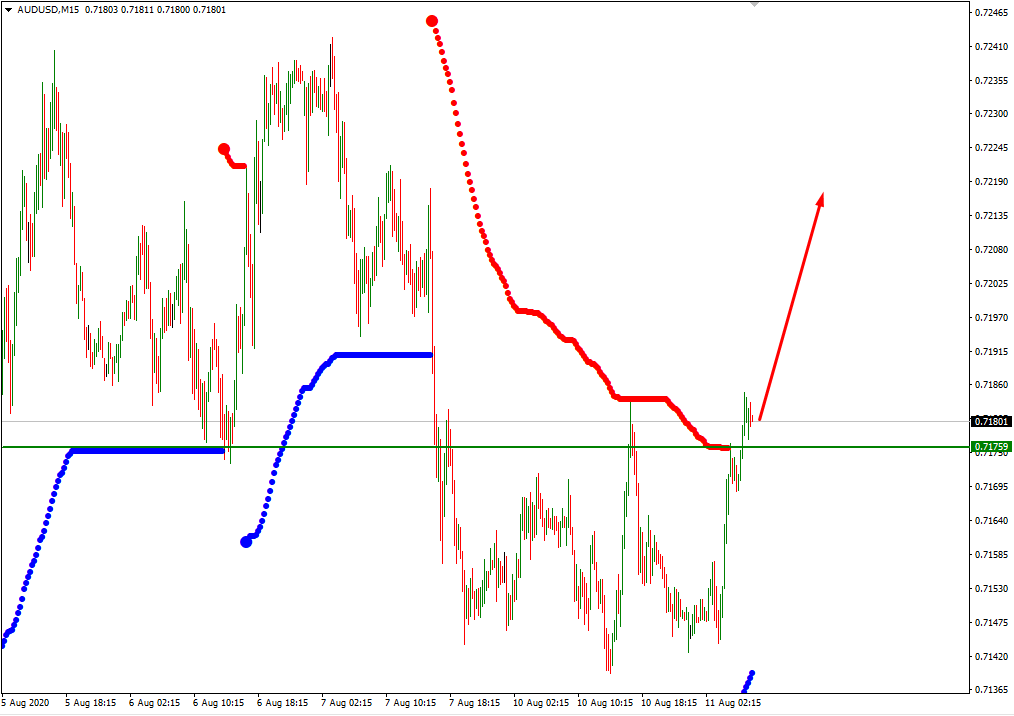
As we can see in the M15 chart, the pair has broken the upside line of the VoltyChannel indicator and, as a result, may continue trading upwards.

AUDUSD_M15
Risk Warning: the result of previous trading operations do not guarantee the same results in the future

NZDUSD, “New Zealand Dollar vs US Dollar”

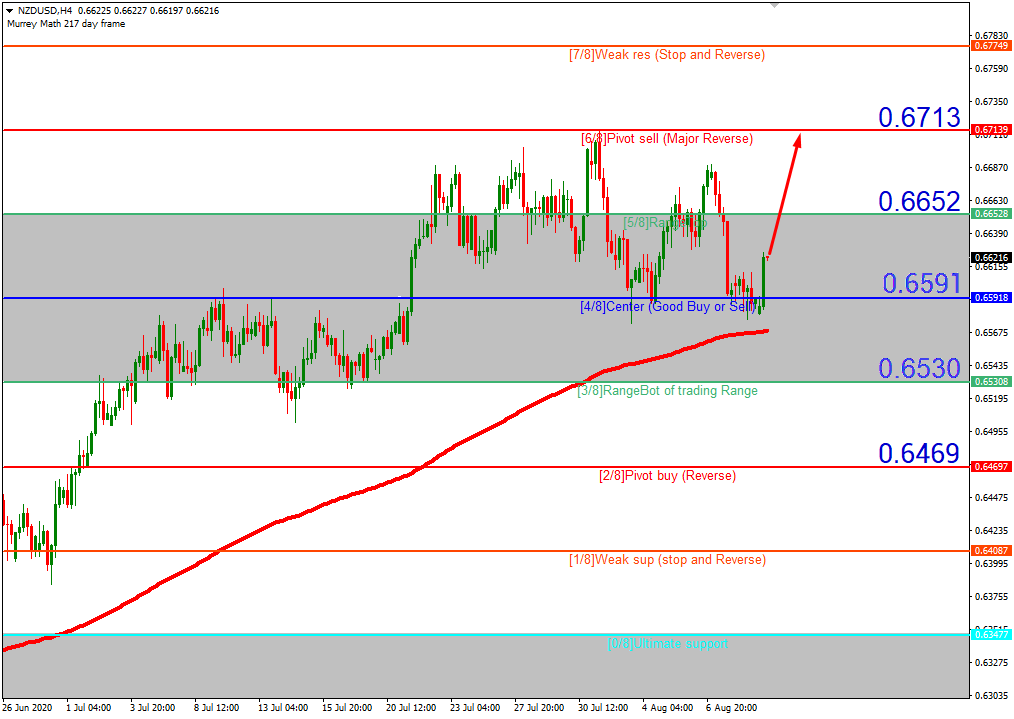
In the H4 chart, NZDUSD is consolidating. In this case, the pair is expected to break 5/8 and then continue trading upwards to reach the resistance at 6/8. However, this scenario may no longer be valid if the price breaks 4/8 to the downside. After that, the instrument may continue falling towards the support at 3/8.

NZDUSD_H4
Risk Warning: the result of previous trading operations do not guarantee the same results in the future

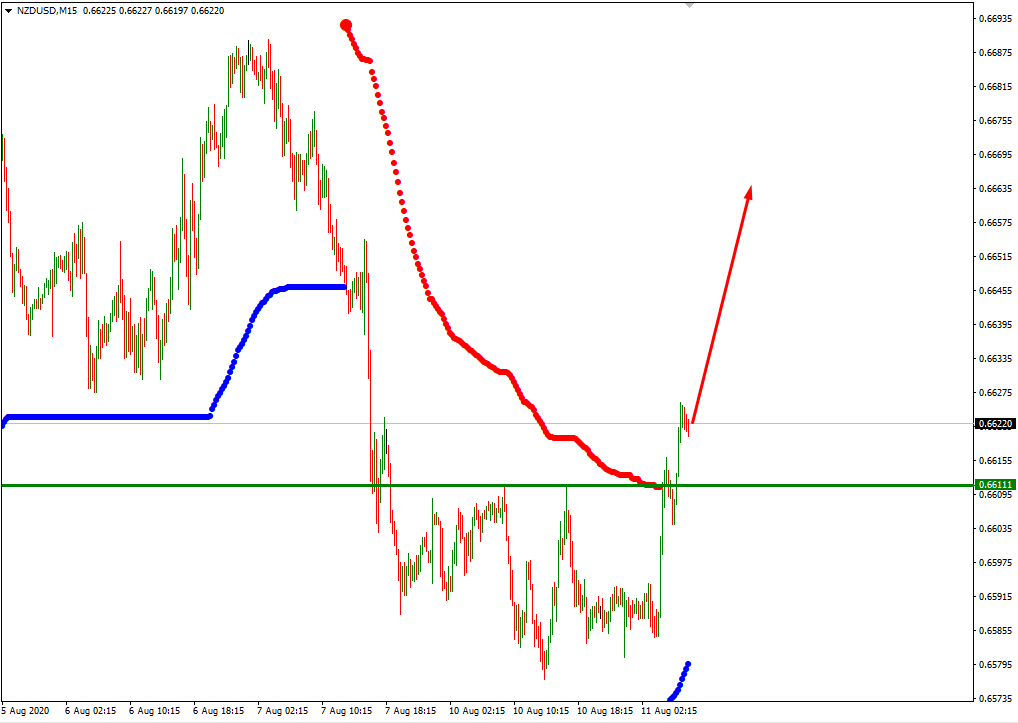
As we can see in the M15 chart, the pair has broken the upside line of the VoltyChannel indicator and, as a result, may continue moving upwards to reach 6/8 from the H4 chart.

NZDUSD_M15

Article By RoboForex.com

Attention!
Forecasts presented in this section only reflect the author’s private opinion and should not be considered as guidance for trading. RoboForex LP bears no responsibility for trading results based on trading recommendations described in these analytical reviews.

USD holding on to gains from last Friday

By Orbex

Euro Continues To Extend Declines

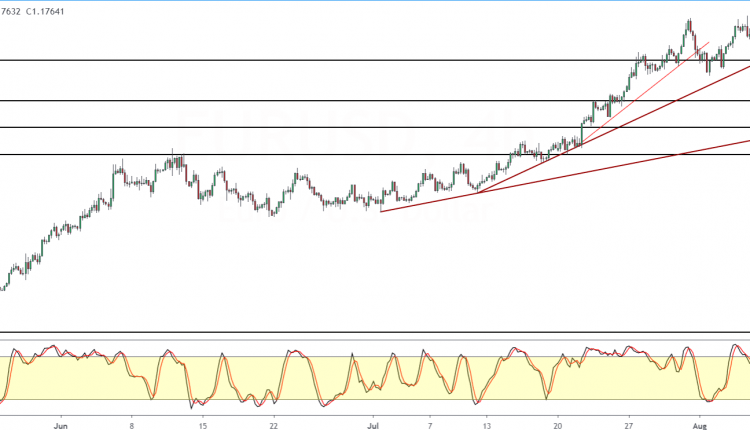
The common currency is trading weaker on Monday’s open, extending on the declines from last Friday. This comes as price failed to breach the previous two-year highs.

The dollar strength is also adding to the current weakness in EURUSD. Price action is trading near the 1.1750 level of support.

From the Stochastics oscillator, there is a possibility that EURUSD might hold on to this support.

A rebound off this level could see another attempt to the upside.

But in case the euro slips below the 1.1750 handle, then we could expect a move toward the 1.1600 level of support next.

GBPUSD Likely To Settle Inside The Range

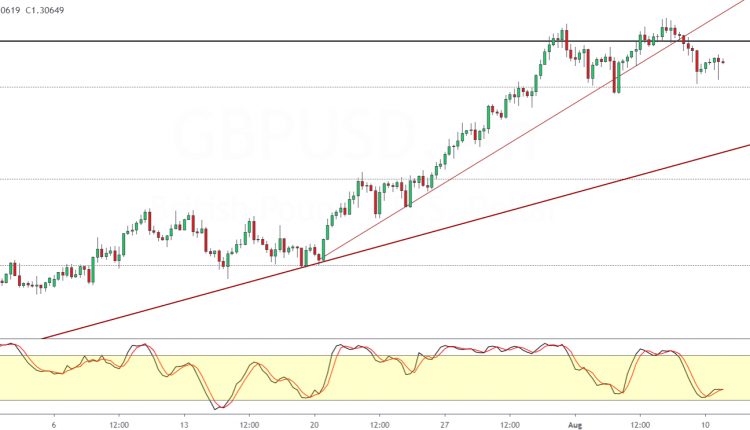
The British pound sterling is also extending losses from last Friday. Just after price made another attempt to close above 1.3122, GBPUSD dropped lower.

For now, price action is likely supported near the 1.3000 level. We expect some ranging price action to extend within these levels.

Only a breakout from the range will determine the near term direction. GBPUSD could be poised to breakout higher given the bullish momentum,

A strong close above 1.3122 is required with follow-through to post a new high. The next main target is 1.3200.

WTI Crude Oil Falls Back Into Consolidation

Oil prices have been somewhat volatile over the past few sessions.

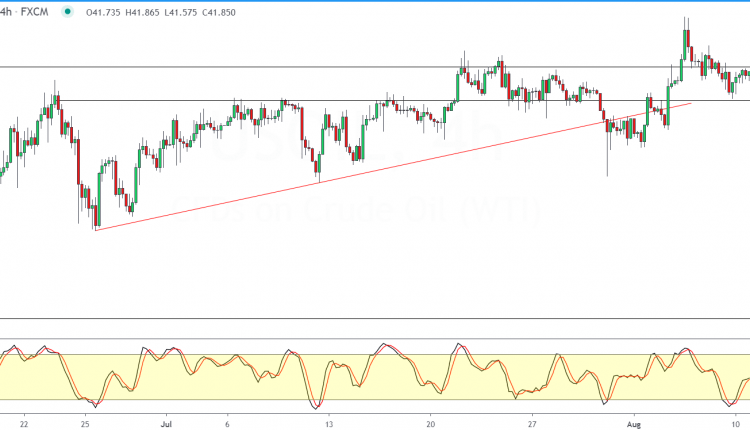
After trading strongly above the 42.00 level, oil prices gave way, paring gains. As a result, WTI crude oil is now trading within the 42.00 and 41.00 levels.

A breakout from this range needs to be convincing in order to maintain the trend.

While the bias remains to the upside, we could expect this sideways action to prevail.

To the downside, below the 41.00 handle, the previous lows near 39.00 might act as support.

To the upside, 43.00 forms the key resistance level.

Gold Retreats From All-Time Highs

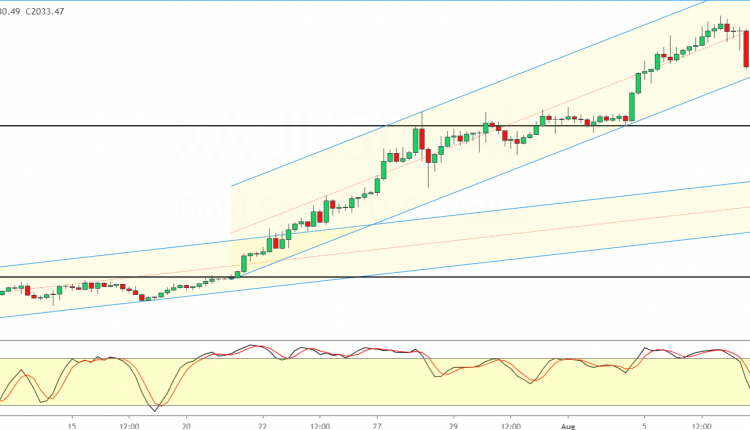
The precious metal is trading soft on Monday right after prices touched a new all-time high last Friday.

The pace of declines is, however, limited. This means that the upside is still likely to prevail.

On the 4-hour chart, we see that price action is supported by the lower end of the rising price channel.

A rebound off this line will need to see gold prices making higher highs.

Failure to post new gains could potentially put the precious metal at risk of a correction.

Immediate support is near the 1967 handle if the psychological support area near 2000 gives way.

By Orbex


Fibonacci Retracements Analysis 11.08.2020 (EURUSD, USDJPY)

Article By RoboForex.com

EURUSD, “Euro vs US Dollar”

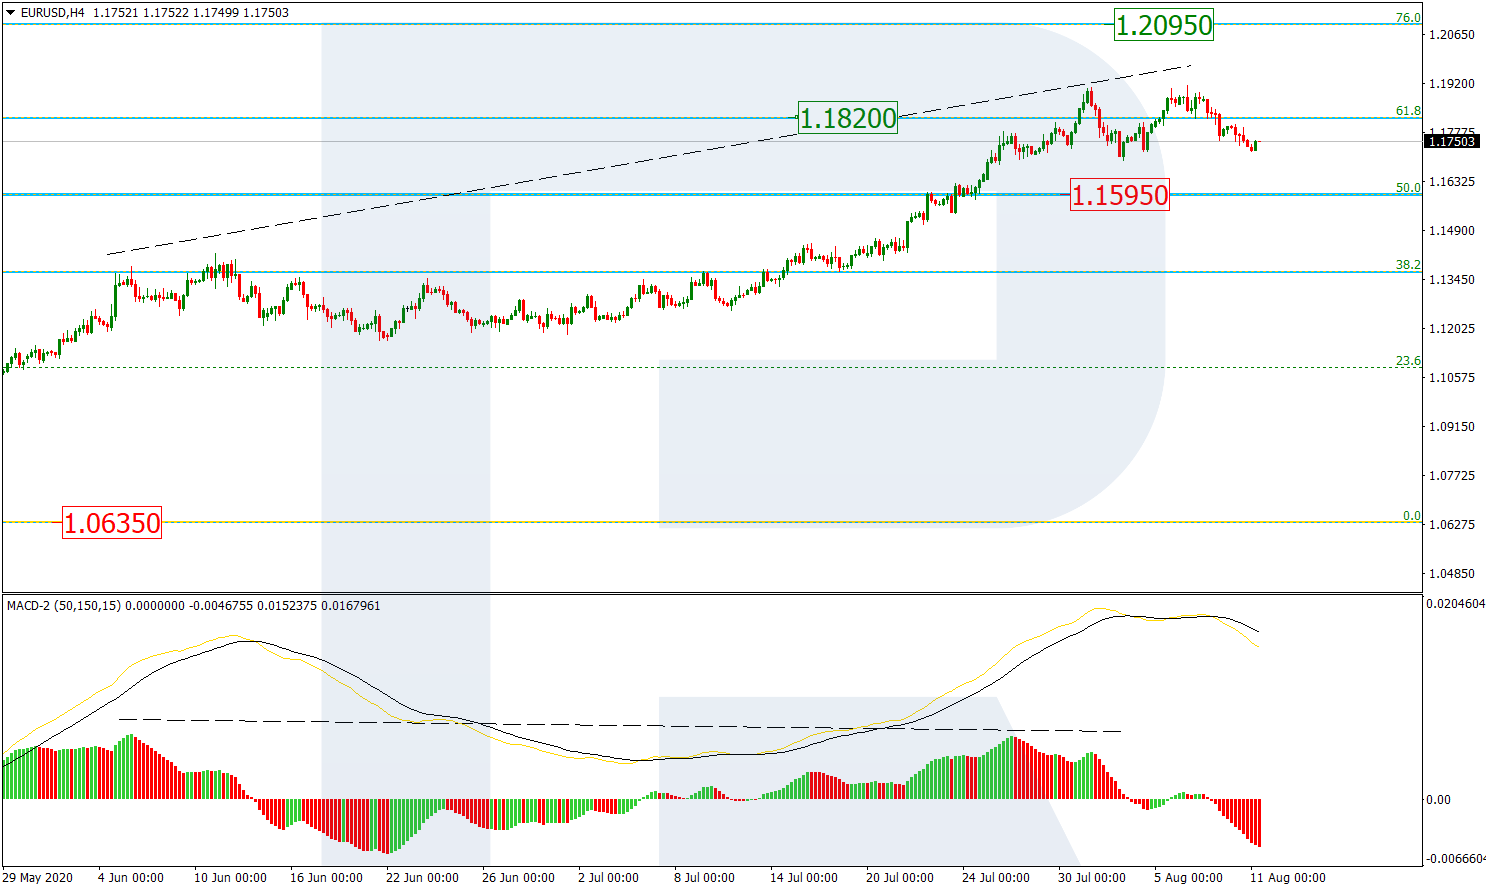
As we can see in the H4 chart, the divergence made the pair stop at 61.8% fibo and start a new decline, which is getting closer to the key correctional target at 50.0% fibo (1.1595). After completing the correction, EURUSD may resume trading upwards to reach 76.0% fibo at 1.2095.

EURUSD_H4
Risk Warning: the result of previous trading operations do not guarantee the same results in the future

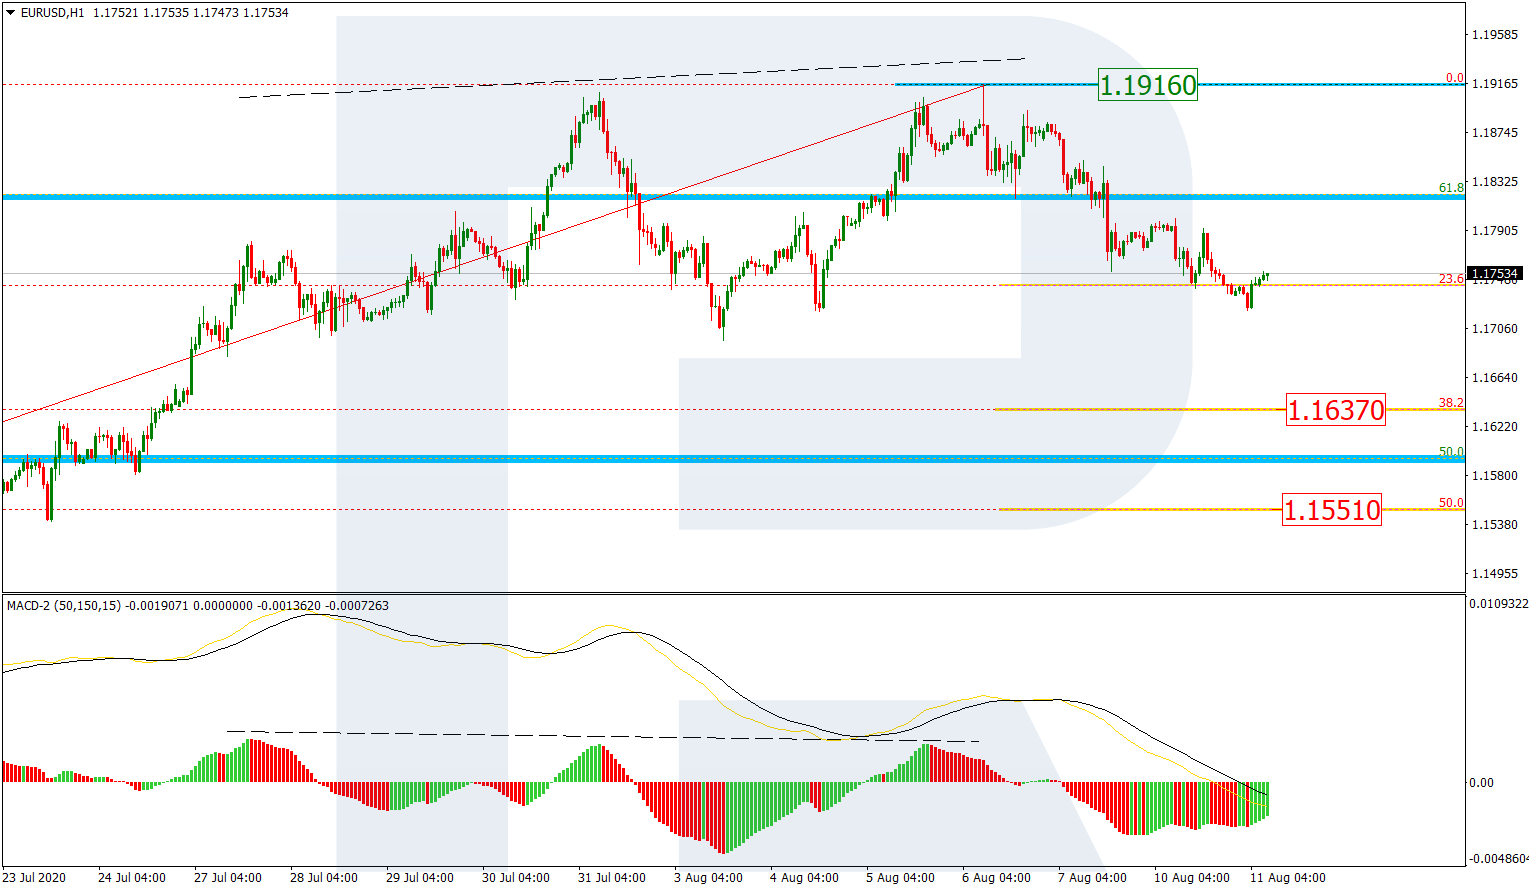
The H1 chart shows a more detailed structure of the current correctional downtrend, which has already reached 23.6% fibo and may continue towards 38.2% and 50.0% fibo at 1.1637 and 1.1551 respectively. However, if the price breaks the high at 1.1916, the correction will be over.

EURUSD_H1
Risk Warning: the result of previous trading operations do not guarantee the same results in the future

USDJPY, “US Dollar vs. Japanese Yen”

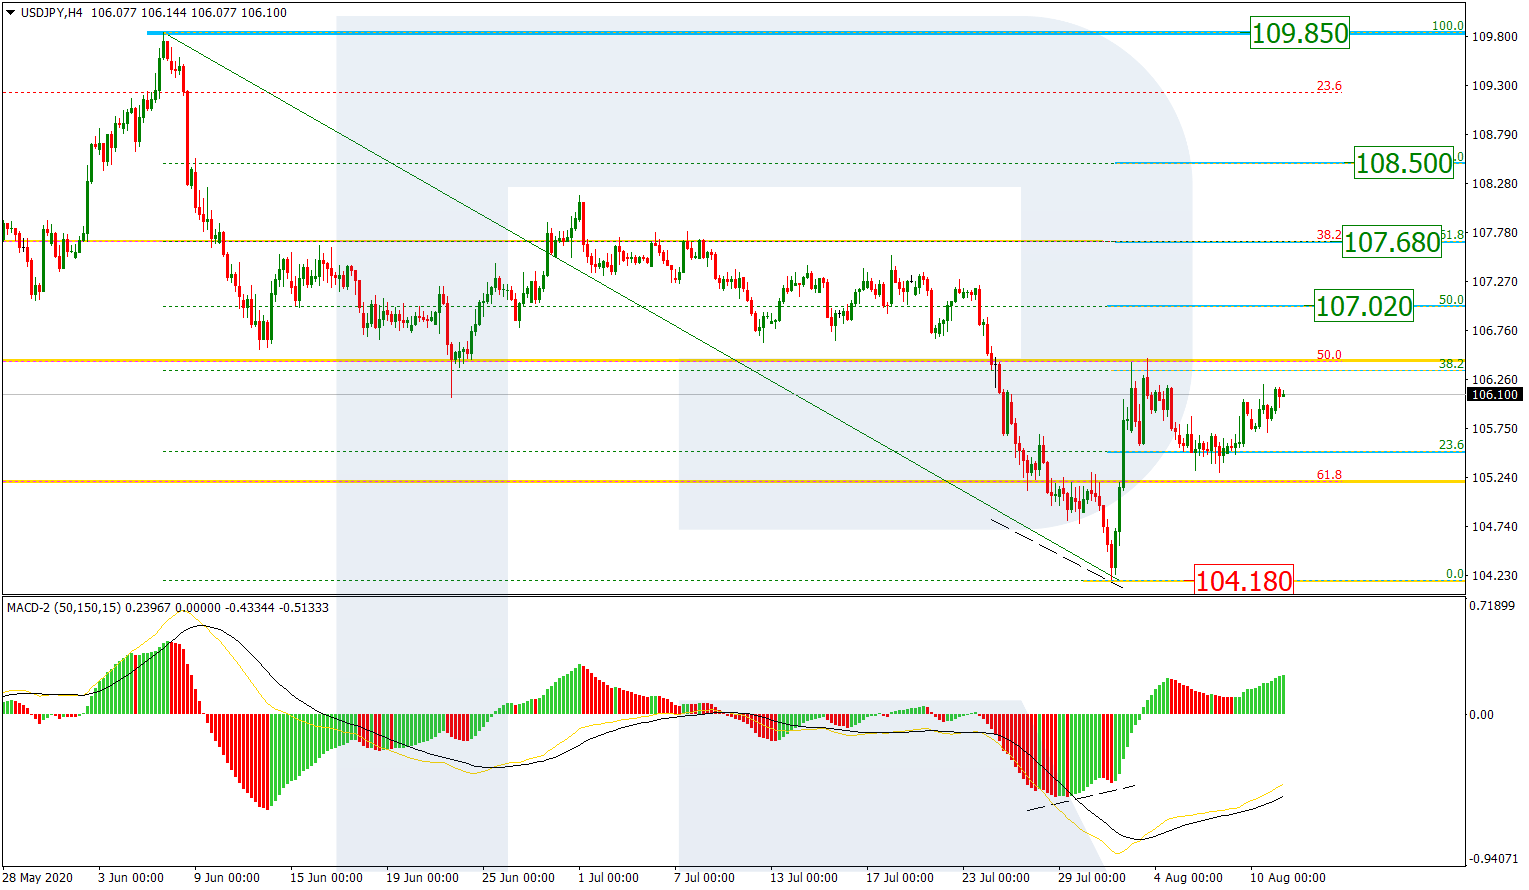
As we can see in the H4 chart, after reaching 61.8% fibo, the downtrend was stopped by the convergence on MACD, that’s why USDJPY is currently correcting upwards and has already reached 38.2% fibo and may later continue towards 50.0%, 61.8%, and 76.0% fibo at 107.02, 107.68, and 108.50 respectively. The key upside target is the fractal high at 109.85.

USDJPY_H4
Risk Warning: the result of previous trading operations do not guarantee the same results in the future

The H1 chart shows that after finishing the correctional decline towards 50.0% fibo, the pair is starting a new rising movement. Later, the price may break the high at 106.47 and then continue growing to reach 50.0% fibo at 107.02. The support is the fractal low at 104.18.

USDJPY_H1

Article By RoboForex.com

Attention!
Forecasts presented in this section only reflect the author’s private opinion and should not be considered as guidance for trading. RoboForex LP bears no responsibility for trading results based on trading recommendations described in these analytical reviews.

Currency Majors Show a Variety of Trends. Investors Expect Additional Drivers

by JustForex

The US dollar has strengthened slightly against a basket of currency majors. The US dollar index (#DX) closed the trading session in the green zone (+0.17%). Investors are focused on the deteriorating relationship between the US and China. China’s Foreign Ministry has imposed sanctions on US officials after Washington sanctioned 11 Chinese and Hong Kong officials on Friday. Meanwhile, on August 15, another round of trade negotiations between the countries should begin. Investors also monitor the adoption of a new package of measures to support the US economy.

The Bank of England intends to increase quantitative easing (QE) if the UK economy slows down and faces difficulties again. Deputy Governor of the Bank of England, Dave Ramsden, also noted that the regulator has a headroom. Investors expect the release of UK labor market data today.

The “black gold” prices continue to grow. At the moment, futures for the WTI crude oil are testing the $42.70 mark per barrel. At 23:30, API weekly crude oil inventories will be published.

Market indicators

Yesterday, there was a variety of trends in the US stock market: #SPY (+0.30%), #DIA (+1.28%), #QQQ (-0.43%).

The 10-year US government bonds yield is growing. At the moment, the indicator is at the level of 0.59-0.60%.

The news feed for 2020.08.11:
  • – Data on the labor market in the UK at 09:00 (GMT+3:00);
  • – ZEW economic sentiment index in Germany at 12:00 (GMT+3:00);
  • – Producer price index in the US at 15:30 (GMT+3:00).

by JustForex

Yen softens despite rising US-China tensions

By Lukman Otunuga, Research Analyst, ForexTime

Shares across Asian markets ventured higher on Tuesday morning, following gains on Wall Street overnight as investors shrugged off China’s retaliatory actions against the United States.

In a move that is likely to strain US-China relations even further, Beijing slapped sanctions on U.S. officials in response to similar measures enforced by Washington. Despite this, market sentiment remains optimistic with investors keeping a close eye on negotiations over the next coronavirus stimulus package in the US.

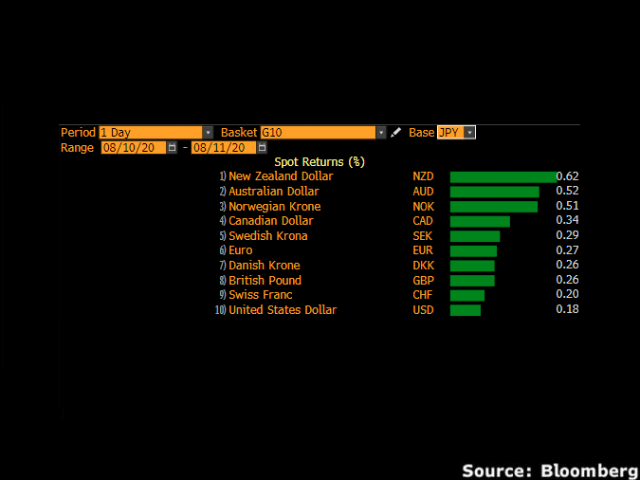
With hopes for additional U.S fiscal supporting risk sentiment, safe-haven currencies like the Japanese Yen and even Dollar have struggled to shine despite mounting tensions between the two largest economies in the world.

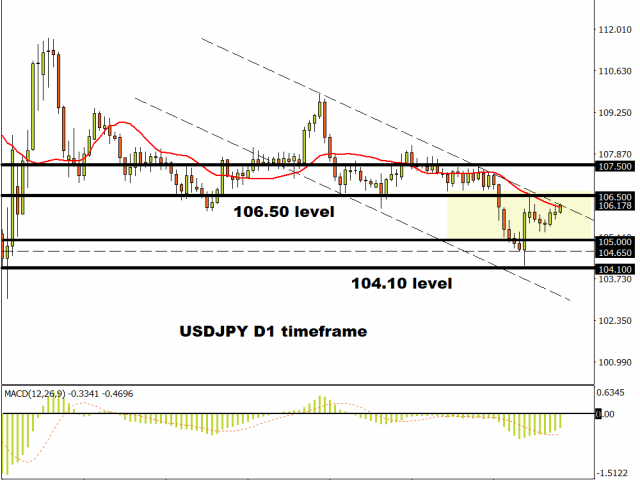
USDJPY eyes 106.50

Over the past two weeks, the USDJPY has found comfort within a 150-pip range with support at 105.00 and resistance around 106.50.

Given how both the Dollar and Yen are fundamentally bearish, this could be a slow grind higher or lower. Looking at the technical picture, prices remain bearish on the daily chart as the candlesticks are trading below the 20 Simple Moving Average while the MACD trades to the downside. If 106.50 proves to be reliable resistance, prices could end up declining back towards the 105.00 support.

Alternatively, a breakout above 106.50 may open the gates towards 107.50.

EURJPY remains in an uptrend

A picture is worth a thousand words…

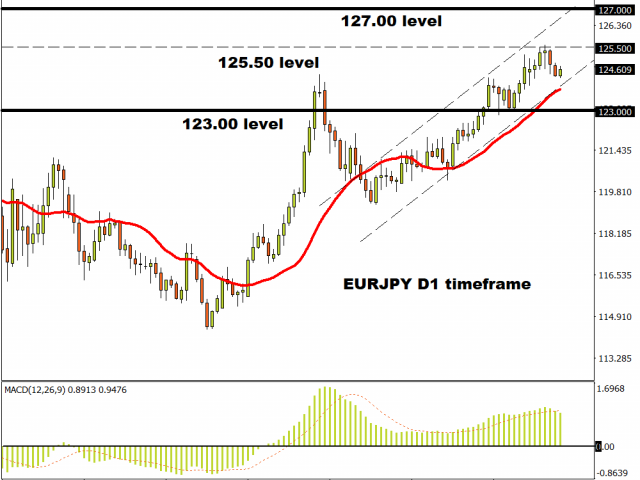
Looking at the EURJPY on the daily charts, prices are firmly bullish as there have been consistently higher highs and higher lows.

The currency pair is finding comfort above the 20 Simple Moving Average while the MACD also points to the upside. A solid breakout above 125.50 will confirm the bullish trend with the new higher low around 124.00. The next key point of interest in such a scenario will be found around 127.00. On the other hand, if 125.50 proves to be a tough nut to crack, prices could sink back towards 123.00.

GBPJPY breakout setup in play

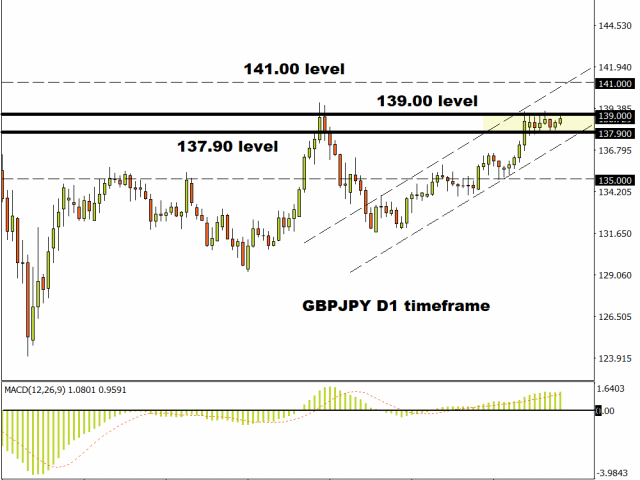
It has been the same story with the GBPJPY over the past two weeks as the currency traded within 110 pip range. All eyes will be on the support at 137.90 and resistance at 139.00.

A decisive breakdown and daily close below 137.90 should pave a path towards 135.00. Alternatively, a breakout above 139.00 may inspire a move back towards 141.00.

Disclaimer: The content in this article comprises personal opinions and should not be construed as containing personal and/or other investment advice and/or an offer of and/or solicitation for any transactions in financial instruments and/or a guarantee and/or prediction of future performance. ForexTime (FXTM), its affiliates, agents, directors, officers or employees do not guarantee the accuracy, validity, timeliness or completeness, of any information or data made available and assume no liability as to any loss arising from any investment based on the same.


Forex-Time-LogoArticle by ForexTime

ForexTime Ltd (FXTM) is an award winning international online forex broker regulated by CySEC 185/12 www.forextime.com

The Analytical Overview of the Main Currency Pairs on 2020.08.11

by JustForex

The EUR/USD currency pair

Technical indicators of the currency pair:
  • Prev Open: 1.17868
  • Open: 1.17365
  • % chg. over the last day: -0.39
  • Day’s range: 1.17220 – 1.17744
  • 52 wk range: 1.0777 – 1.1781

The bearish sentiment prevails on the EUR/USD currency pair. The trading instrument has updated local lows again. The demand for greenback has been partially resumed. Investors continue to monitor the adoption of a new package of measures to support the US economy. At the moment, EUR/USD quotes are consolidating in the range of 1.1725-1.1770. The single currency has the potential for further decline. We recommend opening positions from key levels.

The news feed on 2020.08.11:
  • – ZEW economic sentiment indices in Germany and the Eurozone at 12:00 (GMT+3:00);
  • – Producer price index in the US at 15:30 (GMT+3:00).
EUR/USD

Indicators signal the power of sellers: the price has fixed below 50 MA and 100 MA.

The MACD histogram is in the negative zone, which indicates the bearish sentiment.

Stochastic Oscillator is in the neutral zone, the %K line has crossed the %D line. There are no signals at the moment.

Trading recommendations
  • Support levels: 1.1725, 1.1700
  • Resistance levels: 1.1770, 1.1800, 1.1845

If the price fixes below 1.1725, EUR/USD quotes are expected to fall further. The movement is tending to 1.1700-1.1670.

An alternative could be the growth of the EUR/USD currency pair to 1.1800-1.1830.

The GBP/USD currency pair

Technical indicators of the currency pair:
  • Prev Open: 1.30535
  • Open: 1.30582
  • % chg. over the last day: +0.02
  • Day’s range: 1.30553 – 1.30959
  • 52 wk range: 1.1466 – 1.3516

There is an ambiguous technical pattern on the GBP/USD currency pair. The British pound is being traded in a flat. Quotes are testing local support and resistance levels: 1.3055 and 1.3100, respectively. Financial market participants expect additional drivers. The trading instrument is tending to decline. Positions should be opened from key levels.

The UK released ambiguous labor market data.

GBP/USD

The indicators do not give accurate signals: the price has crossed the 50 MA and 100 MA.

The MACD histogram is near the 0 mark.

Stochastic Oscillator is in the neutral zone, the %K line has crossed the %D line. There are no signals at the moment.

Trading recommendations
  • Support levels: 1.3055, 1.3010, 1.2980
  • Resistance levels: 1.3100, 1.3155, 1.3185

If the price fixes below 1.3055, GBP/USD quotes are expected to correct. The movement is tending to 1.3010-1.2980.

An alternative could be the growth of the GBP/USD currency pair to 1.3140-1.3170.

The USD/CAD currency pair

Technical indicators of the currency pair:
  • Prev Open: 1.33890
  • Open: 1.33508
  • % chg. over the last day: -0.28
  • Day’s range: 1.33009 – 1.33607
  • 52 wk range: 1.2949 – 1.4668

USD/CAD quotes have been declining again. The trading instrument has updated local lows. At the moment, the key support and resistance levels are 1.3290 and 1.3335, respectively. USD/CAD quotes have the potential for further decline. We recommend paying attention to the dynamics of oil prices. Positions should be opened from key levels.

At 15:30 (GMT+3:00), data on building permits will be published in Canada.

USD/CAD

Indicators do not give accurate signals: the price has crossed the 100 MA.

The MACD histogram is in the negative zone, which indicates the bearish sentiment.

Stochastic Oscillator is near the oversold zone, the %K line has crossed the %D line. There are no signals at the moment.

Trading recommendations
  • Support levels: 1.3290, 1.3255, 1.3235
  • Resistance levels: 1.3335, 1.3370, 1.3400

If the price fixes below 1.3290, a further drop in USD/CAD quotes is expected. The movement is tending to 1.3255-1.3235.

An alternative could be the growth of the USD/CAD currency pair to 1.3370-1.3400.

The USD/JPY currency pair

Technical indicators of the currency pair:
  • Prev Open: 105.842
  • Open: 105.936
  • % chg. over the last day: +0.09
  • Day’s range: 105.913 – 106.240
  • 52 wk range: 101.19 – 112.41

The technical pattern is still ambiguous on the USD/JPY currency pair. The trading instrument is in a sideways trend. Investors expect additional drivers. At the moment, the local support and resistance levels are 105.80 and 106.20, respectively. USD/JPY quotes are tending to grow. We recommend paying attention to the dynamics of US government bonds yield. Positions should be opened from key levels.

The news feed on Japan’s economy is calm.

USD/JPY

Indicators signal the power of buyers: the price has fixed above 50 MA and 100 MA.

The MACD histogram is in the positive zone, which indicates the bullish sentiment.

Stochastic Oscillator is in the neutral zone, the %K line is below the %D line, which gives a signal to sell USD/JPY.

Trading recommendations
  • Support levels: 105.80, 105.60, 105.30
  • Resistance levels: 106.20, 106.45

If the price fixes above 106.20, further growth in USD/JPY quotes is expected. The movement is tending to 106.50-106.80.

An alternative could be a decline in the USD/JPY currency pair to 105.50-105.20.

by JustForex

Asia’s recovery supports Oil around 5-month high

By Han Tan, Market Analyst, ForexTime

Oil prices are holding steady around levels not seen since March, after Saudi Aramco expressed a slightly rosier outlook on global markets. Having witnessed a 73 percent year-on-year drop in its Q2 earnings, Saudi Arabia’s government-owned oil giant now believes that demand for crude oil is returning to pre-pandemic levels in Asian economies, which make up the company’s largest regional market.


Looking at Oil prices from a technical perspective, the stunning surge since April is clearly waning. As the Oil benchmarks approach their respective 200-day simple moving averages, it remains to be seen whether crude can break above this resistance level.

The onus appears to be on fundamental factors to drive oil prices higher, allowing WTI futures to add to its 4.7 percent month-to-date gain, with Brent futures having added 3.7 percent thus far in August.

There has to be clearer signs that the world’s consumption of Oil can move closer to pre-pandemic levels by way of a recovery in global economic activity. In other words, more factories have to resume operations, more motorists have to resume their regular routes, and more planes have to return to the skies. According to data by FlightRadar24, commercial flights worldwide climbed by nearly six percent last week, but the average number of flights remains some 33 percent lower than the pre-pandemic average.

On the supply side of the equation, the likes of Russia and Saudi Arabia are beginning to ease off their production cuts this month, as the OPEC+ alliance plans to bring back nearly two million barrels a day back into global markets. Should OPEC+ members continue to struggle with adhering to their respective output quotas, such factors could temper any attempts to send Oil prices higher.

In the event that markets are tipped back into oversupplied conditions, that could see Oil prices unwind recent gains, especially if hopes over the global economic recovery gives way to the realization that this slog into the post-pandemic era is set to be dragged out for longer.


Disclaimer: The content in this article comprises personal opinions and should not be construed as containing personal and/or other investment advice and/or an offer of and/or solicitation for any transactions in financial instruments and/or a guarantee and/or prediction of future performance. ForexTime (FXTM), its affiliates, agents, directors, officers or employees do not guarantee the accuracy, validity, timeliness or completeness, of any information or data made available and assume no liability as to any loss arising from any investment based on the same.


Forex-Time-LogoArticle by ForexTime

ForexTime Ltd (FXTM) is an award winning international online forex broker regulated by CySEC 185/12 www.forextime.com

Markets advance intact with SP 500 near new record – 11.8.2020

By IFCMarkets.com

Top daily news

Global markets are rising currently after a bullish session on Monday. US equities ended mostly higher Monday while technology shares declined as investors rotated away from high-growth stocks.

Forex news

Currency PairChange
EUR USD+1.05%
GBP USD-0.26%
USD JPY+0.18%
The Dollar strengthening has halted currently . The live dollar index data show the ICE US Dollar index, a measure of the dollar’s strength against a basket of six rival currencies, added 0.1% Monday as the Bureau of Labor Statistics reported the number of job openings in the US rose 518,000 to 5.8 million, climbing for a second month in a row. EUR/USD continued sliding Monday while GBP/USD reversed higher as Sentix overall business sentiment  index for the euro-zone economy climbed by +4.8 points for the fourth time in a row, reaching -13.4. Both pairs are little changed currently. AUD/USD continued sliding yesterday while USD/JPY continued advancing with both pairs higher currently.

Stock Market news

IndicesChange
Dow Jones Index+0.66%
GB 100 Index+1.04%
Nikkei Index+1.76%
Hang Seng Index+0.86%
Futures on three main US stock indexes are higher currently ahead of the housing starts report at 16:15 CET today. Companies continue reporting second quarter results. As of Friday, companies representing 89% of the SP 500’s market capitalization had reported second-quarter results, with 81% of them beating their lowered projections. The three main US stock indexes posted returns ranging from -0.4% to 1.3% Monday. European stock indexes are advancing currently after back to back gains yesterday led by bank shares. Asian indexes are mostly rising today led by Nikkei and followed by Hong Kong’s Hang Seng Index as China Association of Automobile Manufacturers reported China’s auto sales grew for a fourth straight month in July.

Commodity Market news

CommoditiesChange
Brent Crude Oil+0.58%
WTI Crude+0.92%
Brent is extending gains today. Oil prices ended solidly higher on Monday after Saudi Aramco Chief Executive said over the weekend there had been a “partial recovery” in demand: the US oil benchmark West Texas Intermediate (WTI) for September added 1.8% Monday and is up currently. October Brent crude rose 1.3% to $44.99 a barrel on Monday.

Gold Market News

MetalsChange
Silver-1.66%
Gold prices are edging lower today. December gold added 0.6% to $2039 an ounce on Monday.

Market Analysis provided by IFCMarkets.com

NASDAQ vs. DJIA: Does the Recent Divergence Matter?

By Elliott Wave International

– “The NASDAQ nearly doubled in the last 100 days of its rally.”

This quote sounds like it’s from 2020, doesn’t it?

After all, since its March bottom near 6600, the NASDAQ has rallied to a new record high. Low to high, it has indeed “nearly doubled.”

And yet, the quote above is not new. It’s from the year 2000.

It appeared in Financial Forecast, a monthly publication by our friends at Elliott Wave International covering stocks, bonds, the dollar, gold, the economy and more.

Yes, the divergence between the NASDAQ and DJIA — one makes a record high, the other one doesn’t — is something EWI’s analysts have seen before.

And today, the same divergence tells you a lot about the next move in stocks.

This excerpt from EWI’s August 2020 Financial Forecast explains:

Special Section
ANOTHER ICARUS MOMENT FOR THE NASDAQ

In December 1999, just weeks before the Dow Jones Industrial Average made its Primary wave 3 peak on January 14, 2000, the NASDAQ Composite was surging higher to ever more ecstatic reviews. “Ignore any forecast of the Dow,” cried the pundits. The Elliott Wave Financial Forecast saw it differently: “When the NASDAQ (and predecessor the OTC Index) pushes into record territory against a lagging Dow, the overall market is late in a long-term uptrend. It is only after years of ascent that investors can work up the courage to jump into these relatively young names despite a weakening trend.” In the January 2000 issue, when the Dow was days from its top, EWFF called the “languishing Dow and the ebullient NASDAQ a classic sign of long-term vulnerability for the market.” The NASDAQ nearly doubled in the last 100 days of its rally. With the index just days from its peak, the March 2000 issue of EWFF issued the following forecast:

The NASDAQ’s strength is derived from rotation among a thinning list of high-tech stocks. “The mentality is, ‘Let’s trim the generals [the Dow stocks] and put some of that money to work among the soldiers [the Nasdaq issues].'” Investors are so bullish that they will defy their own social nature to back a leaderless army. Such transgressions generally happen only late in long-term uptrends. The resulting carnage resembles what happens in a real war when the generals abandon the fight.

Similarly, after the Dow Industrials topped in December 1968, the OTC index rallied to a new high in November 1969, unconfirmed by the Dow. Overall, neither stock index made any material gains for another 13 years.

3-NasdaqDow_c

The chart above captures the latest divergence between the two indexes, which dates back to February 12 when the DJIA rallied to 29,551.42, its [so far] all-time closing high. The NASDAQ’s closing high then occurred at 9817.10 on February 19. After declining in conjunction with the Dow to March 23, the ensuing rally carried the NASDAQ to new highs.

As in 2000, a “thinning list of high-tech stocks” accounts for much of the stock market’s strength. The figure below shows that in June, just five technology stocks, Facebook, Alphabet (Google), Microsoft, Apple and Amazon, accounted for 5.7% of the S&P 500’s year-over-year increase in total market capitalization, a new record. The prior extreme came at the major top in March 2000.

Figure 4

In July, the advance narrowed further to three main stocks, as approximately 23% of the S&P’s gain came from Amazon, Apple and Alphabet (Google).

The next chart shows another area in which the NASDAQ recently surpassed a post-peak extreme from 2000. In early July, NASDAQ volume surged to 1.6 times S&P volume, the highest on record.

The prior record ratio of 1.35 occurred on September 5-6, 2000, when the NASDAQ and S&P 500 completed second-wave rallies in their respective bear markets.

Figure 5

There is an important difference between the peaks in 2000 and 2020. In 2000, financial stocks performed well, holding up for the balance of the year as the major stock averages declined.

The next chart reveals that’s not the case now. On a short- and long-term basis, the MSCI World Financials Index is far weaker than the main stock indexes.

Figure 6

In this respect, current market behavior is more like 1968-1969. That is when financial entities struggled in the midst of an ongoing speculative orgy. Brokerage firms were privately held at that time, but in his book The Go-Go Years

In September 1969, two months before the peak in the OTC Index, NYSE member firm Gregory and Sons went under.

In December, only one month after the OTC top, Brooks wrote, “Depression had come to Wall Street. A cheerless pall of doom hung over the financial district through the 1969 holiday season.”

A slew of failures in marginal firms followed. Even “conservative, well-established giants were in bad trouble. Bache and Company reported that for fiscal 1969, it had recorded the largest annual operating loss in the annals of American brokerage. Shock waves followed.”

Back in 2014, market expert Ned Davis said, “If there are systemic risks, financials generally will ferret them out.”

That observation remains as pertinent as ever.

Want to read more insights like this one — free?

Then join Elliott Wave International’s free Club EWI today.

350,000 online members strong, Club EWI is your free source for tons of investor- and trader-focused reports, videos, forecasts and more.

Club EWI really is free, you won’t be asked for your credit card number. So, take a few seconds now to join in – and start reading and watching new insights. Get started now.

This article was syndicated by Elliott Wave International and was originally published under the headline NASDAQ vs. DJIA: Does the Recent Divergence Matter?. EWI is the world’s largest market forecasting firm. Its staff of full-time analysts led by Chartered Market Technician Robert Prechter provides 24-hour-a-day market analysis to institutional and private investors around the world.