Archive for Stock Market News – Page 45

Wall Street Hemophilia

Source: Michael Ballanger  (10/11/22)

Expert Michael Ballanger of GGM Advisory reviews the current stock market, the outlook for gold, and how he believes everyone should move forward.

Exactly nine months ago this weekend, I sounded the alarm for the pending arrival of a bear market in financial assets when “The First Five Days” of the January Barometer flashed a warning signal by closing lower than the end-of-year number from the prior week.

The Rolling Bear Market

For nearly the next eight months, I watched and read advisors, bloggers, and podcasters all chortle on and on in breathless anticipation of the emergence of the “Fed Pivot” to the extent that every sign of an abatement in the CPI numbers was met with mindless euphoria and wave after wave of buying while Wall Street insiders and corporate executives quietly and without fanfare were selling massive amounts of paper.

The volume and blatancy of insider sales were astonishingly outdone by the retail “buy-the-dipping” that results from the well-crafted Fed “script” that trains the kiddies to expect policy rescue and accompanying deliverance from portfolio purgatory.

Warren Buffett is quoted as saying that maximizing stock market performances involves being “Fearful when others are greedy and greedy when others are fearful.”

I had been holding fast to my strategy of fading every advance while pressing bearish bets while rolling bear market profits into additional (and egregiously large) precious metals holdings, which, up until Wednesday, September 28, 2022, seemed like a pretty good strategy.

However, the landscape all changed when the Bank of England announced it was buying — instead of selling — gilts (10-year U.K. bonds), putting an immediate end to the U.K. version of quantitative tightening and rather than calling it “easing,” they simply called it “temporary” and “emergency” purchases.

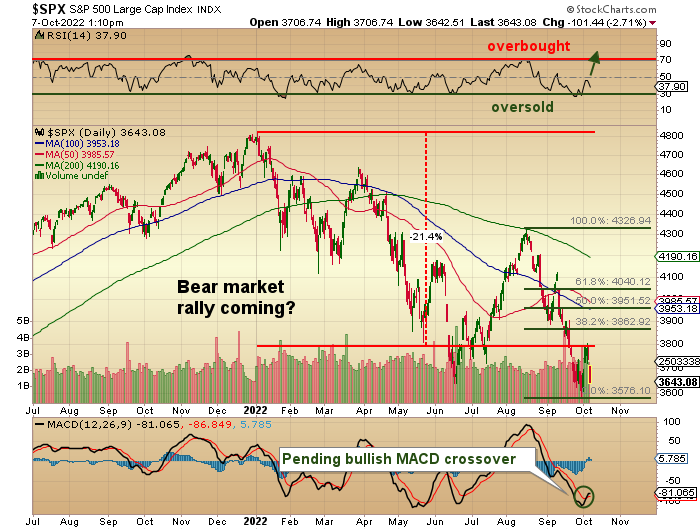
What resulted was a 7% rally in the S&P 500 on mammoth volume, and while pundits dismissed it as yet another “bear market rally” that should be sold aggressively, only with the fullness of time will I know without question the veracity of the MACD buy signal shown below,

Call it a “trader’s intuition,” call it a “gut feel,” or call it a “contrarian set-up” I think that the ferocity of retail dumping and shorting is moving to “overblown” status.

I furthermore think that the Twitterverse, with all of the gold bugs delighting in the demise of every sector that was in the limelight since March 2009, remains “interesting.”

Tech, crypto, and social media — all totally trashed in the past year — are now being jettisoned like spent boosters on a NASA launch.

It still astounds me how quickly the darlings of today become the pariahs of tomorrow.

I also sense extreme investor apprehension here due to the month of October, known as the “jinx month” because of crashes in 1929 and 1987, a 554-point swoon in 1997 as well as back-to-back massacres in 1977 and 1979, “Friday the Thirteenth crash in 1989 and finally the subprime meltdown in 2008.

All of these nerve-rattling declines represented the terminal moves in a longer-term trend of lower prices and were followed by extended rallies in 1946, 1957, 1960, 1974, 1987, 1990, 1998, 2001, 2002, and 2011.

Should You Be Cautious?


I have countless times written about the difficulties in trying to pick bottoms or tops during the final parabolic “terminal” moves that characterize important turning points.

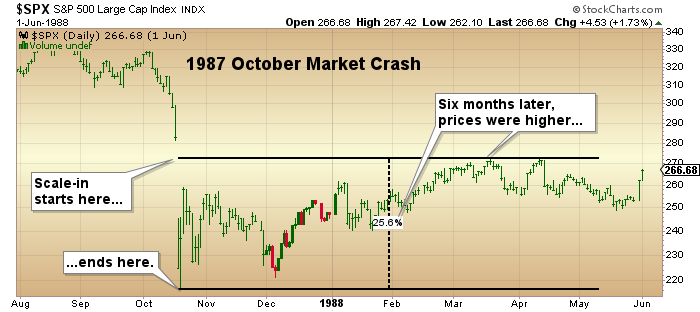
This is why I usually scale into positions in October because while market trendlines that move from gradual to vertical provide me with a sense of how close the lows are in terms of time, they do not provide me with the same sense as to price.

So if the bottoming process takes three weeks in October, I might be paying US$10 in week one but US$2 in week three, so nibbling away in tranches is a reasonable strategy.

Even if I get caught in a 1987-style crash, some of the entry points are going to be ridiculously lower than where they are once panic subsides (which it always does), and bargain hunters arrive in droves.

Make no mistake; there are dozens of reasons to be cautious but based upon everything I have learned since 1974, the first time I picked up a Wall St. Journal (understanding nothing), there are an even greater number of reasons to be optimistic as you have read in the above paragraphs.

I have told everyone to fade the markets until the Fed openly admits to a policy reversion from the current “hostile” to a more “friendly” stance.

Even a “neutral” stance would allow for a sharp relief rally lasting several months and classified as a tradable rally.

Gold

Gold is acting far better here in October than it was in September (as is silver), and while I am long both, I am modestly ahead on silver and moronically underwater on gold.

That said, I believe that once this difficult month of October is behind us, I see a rally unfolding in all risk assets, and despite the fact that the only asset class that is devoid of anything resembling counterparty risk is the physical precious metals sector, the money managers of the world choose to lump the PM’s together with growth stocks, crypto, and high-tech zombies under the label of “risk assets.”

Alas, I am neither able nor willing to debate it in the world of social media hatemongers because it is pointless. It is like the debate over precious metals manipulation; it does not matter who wins the debate when the control of price is in the hands of a few government-sanctioned bullion banks.

I continue to hold that new purchases should be in physical gold and/or silver so as to avoid inclusion in the “risky stocks” all-encompassing drawdown potential where it matters not that you are a gold and silver producer, explorer, or developer when the margin calls arrive, you get trashed.

Mind you, in 2008 and 2020, they took cash prices lower as well, which contrasted 1987 when the cash market for gold went from US$425 to US$505 in a week, while the TSE Gold and Silver Index containing all the big gold miners crashed from over 10,000 to less than half of that.

Fear and Greed

Warren Buffett is quoted as saying that maximizing stock market performances involves being “Fearful when others are greedy and greedy when others are fearful.”

I like to add the adjective “irrationally” as in “irrationally fearful” with yet another quote in mind, and that one being from the mouth of John Maynard Keynes, who reminded us that “Stocks can remain irrational longer than we can remain solvent.”

Do you wait for the result and then move?  Do as you must, but I do not want to be short in November.

Sometimes markets can remain “irrationally fearful” much longer than I might have reasonably expected, and that is where I try to discipline myself to focus on position size.

As an example, I might be totally convinced that the S&P is going to close out the year back above 4,000 but rather than going “all-in,” I use call options with a finite dollar amount of risk rather than a fully-leveraged portfolio.

This is because if I am wrong, I will still have an ample cash position with which to react, especially if things take longer or not at all, which does happen.

There is no doubt that there is a lot of blood flowing in the streets right now, and with the fear-greed gauges at levels last seen in April 2020, December 2018, March 2009, and October 2008, I believe it is time to reduce my bearish exposures and slowly shift to a conservatively-bullish stance.

I am loaded with junior copper/gold /silver /uranium developers but have no positions in the broad market components that will have the highest “beta” in the advent of a “risk-on” shift brought about by the specter of a bullish policy reversal.

Wealth managers across the planet are all hemorrhaging, creating this torrent of Main Street gore to the extent that some very large pools of investment capital are ready to pounce.

Do not think for a minute that the mid-term U.S. elections are a factor in keeping pressure on the markets; once the Democrats are ceremoniously swept out of the House and Senate, watch for a serious rebound.

Do you wait for the result and then move?  Do as you must, but I do not want to be short in November.

Think “risk-on” because we have had nine months of “risk-off,” and the blogosphere is short up to the teeth. . .

Michael Ballanger Disclaimer:

This letter makes no guarantee or warranty on the accuracy or completeness of the data provided. Nothing contained herein is intended or shall be deemed to be investment advice, implied or otherwise. This letter represents my views and replicates trades that I am making but nothing more than that. Always consult your registered advisor to assist you with your investments. I accept no liability for any loss arising from the use of the data contained on this letter. Options and junior mining stocks contain a high level of risk that may result in the loss of part or all invested capital and therefore are suitable for experienced and professional investors and traders only. One should be familiar with the risks involved in junior mining and options trading and we recommend consulting a financial adviser if you feel you do not understand the risks involved.

Disclosures:

1) Statements and opinions expressed are the opinions of Michael Ballanger and not of Streetwise Reports or its officers. Michael Ballanger is wholly responsible for the validity of the statements. Streetwise Reports was not involved in any aspect of the article preparation. Michael Ballanger was not paid by Streetwise Reports LLC for this article. Streetwise Reports was not paid by the author to publish or syndicate this article.

2) This article does not constitute investment advice. Each reader is encouraged to consult with his or her individual financial professional and any action a reader takes as a result of information presented here is his or her own responsibility. By opening this page, each reader accepts and agrees to Streetwise Reports’ terms of use and full legal disclaimer. This article is not a solicitation for investment. Streetwise Reports does not render general or specific investment advice and the information on Streetwise Reports should not be considered a recommendation to buy or sell any security. Streetwise Reports does not endorse or recommend the business, products, services or securities of any company mentioned on Streetwise Reports.

3) Comments and opinions expressed are those of the specific experts and not of Streetwise Reports or its officers. The information provided above is for informational purposes only and is not a recommendation to buy or sell any security.

4) The article does not constitute investment advice. Each reader is encouraged to consult with his or her individual financial professional and any action a reader takes as a result of information presented here is his or her own responsibility. By opening this page, each reader accepts and agrees to Streetwise Reports’ terms of use and full legal disclaimer. This article is not a solicitation for investment. Streetwise Reports does not render general or specific investment advice and the information on Streetwise Reports should not be considered a recommendation to buy or sell any security. Streetwise Reports does not endorse or recommend the business, products, services or securities of any company mentioned on Streetwise Reports.

5) From time to time, Streetwise Reports LLC and its directors, officers, employees or members of their families, as well as persons interviewed for articles and interviews on the site, may have a long or short position in securities mentioned. Directors, officers, employees or members of their immediate families are prohibited from making purchases and/or sales of those securities in the open market or otherwise from the time of the decision to publish an article until three business days after the publication of the article. The foregoing prohibition does not apply to articles that in substance only restate previously published company releases. As of the date of this article, officers and/or employees of Streetwise Reports LLC (including members of their household) own securities of Silver X Mining Corp., a company mentioned in this article.

Chen Reveals His Picks for Last Quarter

Source: Streetwise Reports  (10/11/22)

Asset manager Chen Lin’s picks for the home stretch of 2022 include several biotechs and some precious metals companies.

Asset manager Chen Lin’s picks for 2022’s last quarter include a whole stable of biotechs with some precious metals thrown in.

He cashed out of one position and doubled down on some others.

According to Zacks research, the biomedical and genetics industry has underperformed the S&P 500 Index and the medical sector so far in 2022, having declined 28.9% compared to 25% for both the medical sector and S&P.

But there is hope on the horizon. The sector carries a current Zacks industry rank of 77, which puts it in the top 31% of more than 251 industries Zacks tracks.

Biotech “bottomed around mid-year,” Chen said. “Now it is starting to rebound. I had a good year in biotech. I see continuing rebounds of my biotechs in the coming years.”

Tricida Inc.

Tricida, Inc. (TCDA:NASDAQ) is developing Veverimer, which is designed to treat metabolic acidosis in patients with chronic kidney disease. It’s a return from Q3 on Chen’s list.

The U.S. Food and Drug Administration (FDA) did not approve the drug in 2020, but the company is awaiting the outcome of a new trial which will be “the most important data readout in its history,” Chen said.

“The chance of positive data (in the trial) is extremely high, in my opinion,” Chen said. “With the positive data, TCDA can file for approval next year. The stock has at least a 10-fold upside after approval.”

Top shareholders in the company include OrbiMed Advisors LLC at 18.47%, VR Adivser LLC at 17.14%, Sibling Capital Ventures LLC at 11.54%, and Steven A. Cohen at 5.9%, according to Reuters.

Tricida’s market cap is US$659.68 million, with 55.7 million shares outstanding, 51 million of them free-floating. It trades in a 52-week range of US$13.85 and US$4.10.

Amyris Inc.

Another returning pick for Chen is Amyris, Inc. (AMRS:NASDAQ), asynthetic biotech company that “programs” cells to create sustainable ingredients.

The company has begun production at its new precision sugar fermentation plant in Brazil.

The plant consists of five precision fermentation “mini-factories” that can produce 13 of Amyris’ molecules, which are used in everything from health and beauty products to flavors and fragrances.

Amyris is a frontrunner for US$1 billion the U.S. Department of Defense will be investing in the bioindustrial domestic manufacturing infrastructure over the next five years.

It’s part of the US$2 billion the U.S. government plans to spend to boost biomanufacturing under an executive order announced last month.

“The decision could come in the next couple of months,” Chen said. “In addition, AMRS’ own lines of business are on fire . . . 2023 should be the year they turn cash positive.”

Amyris’ top shareholders include Foris Ventures LLC at 22.86%, Farallon Capital Management LLC at 6.56%, The Vanguard Group Inc. at 5.9%, Koninklijke DSM NV at 5.16%, and BlackRock Institutional Trust Co. N.A. who holds 3.68%.

Its market cap is US$846.26 million, and it has 323.4 million shares outstanding, 227.6 million of them free-floating. It trades in a 52-week range of US$15.12 and US$1.47.

Synaptogenix Inc.

A new pick for Chen is Synaptogenix Inc. (SNPX:NASDAQ), a biopharmaceutical company developing Bryostatin-1 for Alzheimer’s disease.

The company is just about to report data from its Phase 2 trials, which were partially funded by the National Institutes of Health.

“This trial, if successful, would open up a brand new approach to reverse Alzheimer’s,” Chen said.

The stock is a “very high-risk play,” he said, but he owns “a small position here as a lottery ticket.”

Top shareholders include Intracoastal Capital LLC at 7.17%, Alpha Capital Aktiengesellschaft at 4.41%, George Weaver Haywood at 3.44%, The Vanguard Group at 3.17%, and Ikarian Capital LLC at 1.77%.

The company’s market cap is US$48.23 million, with 6.84 million shares outstanding, 5.76 million of them free-floating. It trades in a 52-week range of US$14.50 and US$3.79.

GoGold Resources Inc.

GoGold Resources Inc. (GGD:TSX) is a Nova Scotia-based silver and gold producer operating in Mexico. It operates the Parral Tailings mine in the state of Chihuahua and has the Los Ricos South and Los Ricos North exploration projects in the state of Jalisco.

Chen said he took advantage of a big dip in its price recently to load up on his position.

“GGD has . . . cash, a silver-producing mine, and a new discovery,” he said. “It looks very undervalued.”

Ownership includes Bradley H. Langille with 5.22%, Van Eck Associates Corp. with 4.41%, Franklin Advisers Inc. with 4.35%, Sprott Asset Management LP with 3.1%, and Mirae Asset Global Investments (USA) LLC with 2.7%.

It has a market cap of CA$461.3 million, with 295.6 million shares outstanding, 275.2 million of them free-floating. It trades in a 52-week range of CA$3.79 and CA$1.37.

He said he also likes other silver producers such as Silver X Mining Corp. (AGX:TSX.V).

Chen Lin strongly recommends that investors load up on silver and silver miners for the coming tax loss selling season.

Axsome Therapeutics Inc.

Last quarter, Chen doubled down his top pick from Q2, Axsom Therapeutics Inc. (AXSM:NASDAQ), a biopharmaceutical company that focuses on therapies for central nervous system conditions.

The company had been waiting on decisions from the FDA on drug candidates for major depressive disorder and migraine.

The FDA has approved the major depressive disorder drug, Auvelity, and Chen said he sold out his position when it was at about US$70.

Axsome’s top shareholders include Antecip Capital LLC at 18.22%, The Vanguard Group Inc. at 6.95%, BlackRock Institutional Trust Co. N.A. at 4.99%, RTW Investments LP at 4.02%, and PFM Health Sciences LP at 3.38%.

It has a market cap of US$1.95 billion with 40.3 million shares outstanding, 32.3 million of them free-floating. It trades in a 52-week range of US$71.98 and US$20.63.

Disclosures:

1) Steve Sobek wrote this article for Streetwise Reports LLC. He or members of his household own securities of the following companies mentioned in the article: None. He or members of his household are paid by the following companies mentioned in this article: None.

2) The following companies mentioned in this article are billboard sponsors of Streetwise Reports: None. Click here for important disclosures about sponsor fees.

3) Comments and opinions expressed are those of the specific experts and not of Streetwise Reports or its officers. The information provided above is for informational purposes only and is not a recommendation to buy or sell any security.

4) The article does not constitute investment advice. Each reader is encouraged to consult with his or her individual financial professional and any action a reader takes as a result of information presented here is his or her own responsibility. By opening this page, each reader accepts and agrees to Streetwise Reports’ terms of use and full legal disclaimer. This article is not a solicitation for investment. Streetwise Reports does not render general or specific investment advice and the information on Streetwise Reports should not be considered a recommendation to buy or sell any security. Streetwise Reports does not endorse or recommend the business, products, services or securities of any company mentioned on Streetwise Reports.

5) From time to time, Streetwise Reports LLC and its directors, officers, employees or members of their families, as well as persons interviewed for articles and interviews on the site, may have a long or short position in securities mentioned. Directors, officers, employees or members of their immediate families are prohibited from making purchases and/or sales of those securities in the open market or otherwise from the time of the decision to publish an article until three business days after the publication of the article. The foregoing prohibition does not apply to articles that in substance only restate previously published company releases. As of the date of this article, officers and/or employees of Streetwise Reports LLC (including members of their household) own securities of Silver X Mining Corp., a company mentioned in this article.

Expert Shares Three Stocks He Believes Are of ‘Great Value’

Source: Ron Struthers  (10/7/22)

Expert Ron Struthers believes TC Energy is a well-run pipeline company as it is yielding about 6.5% and has increased its dividend every year since the turn of the century. He also discusses how oil tanker rates are soaring as the market tightens more with the Ukraine war, but DHT Holdings is a laggard worth a look.

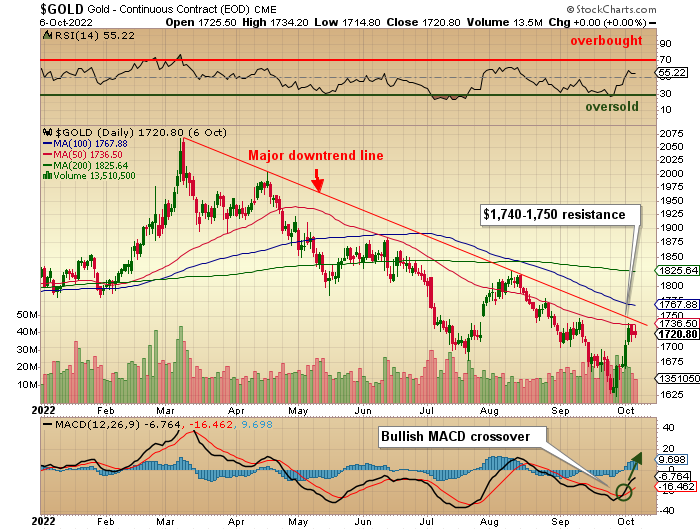
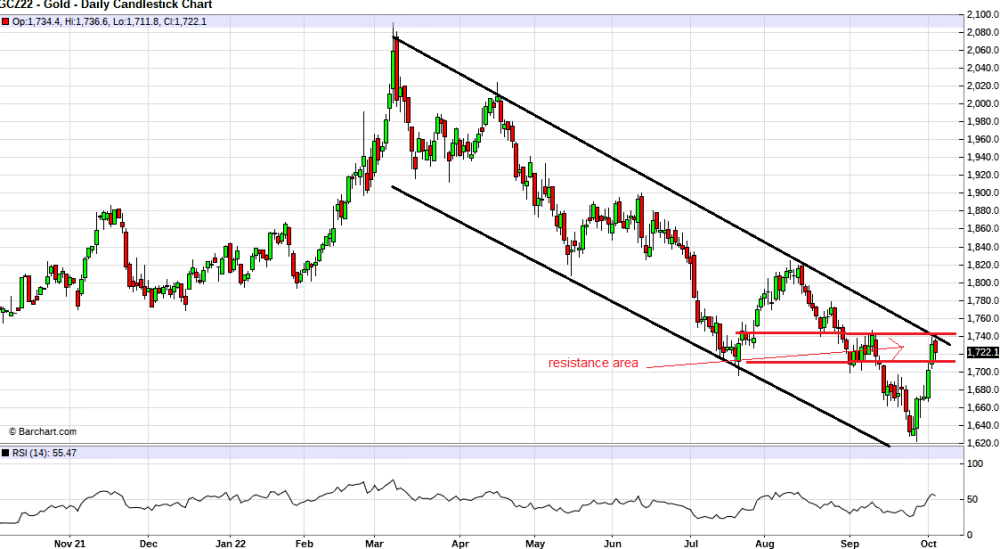
Has gold bottomed? It is possible, but it appears today it is retreating from its resistance area. We need a solid break above $1740 for more proof the bottom is in, which would also break the downtrend.
A good thing we got stopped out of most of our gold stocks in June. Near term, I believe there is more potential in the energy sector, where I have been making most of my new picks this year and two more below.

There is renewed interest in GICs and term deposits at the banks now that interest rates have gone up. A person can get 4% to 5% by locking into three to five year terms. Rates vary by type and bank, but that is a good ballpark number.

While this is a safe investment, the downfall is your money is tied up, and there is no chance of getting a higher rate or making a capital gain.

A better alternative is TC Energy Corp. (TRP:NYSE).

TC Energy Corp.

TC Energy offers more potential than GICs, with comparatively small risks. At CA$55.75 and an annual payout of $3.60, TC Energy yields 6.5%.

TC Energy owns and operates 93,300 kilometers of natural gas pipelines and 653 billion cubic feet of storage space in Canada, the United States, and Mexico. It also has a 4,900km network of oil pipelines, which supply Alberta crude to the U.S. market.

It also invests in several power-generation facilities, including wind, solar and nuclear. The current quarterly dividend is $0.90 per share. The company has raised its payout every year since the turn of the century.
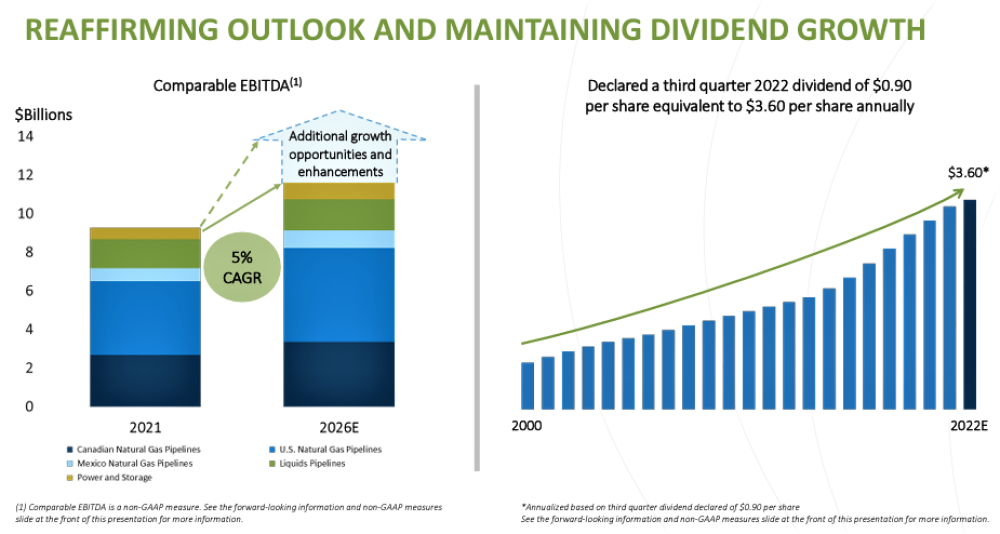
The company is projecting 5% annual growth, and I see no reason why dividends will not keep increasing. Second-quarter results came in slightly ahead of analysts’ expectations.

Net income attributable to shareholders was $889 million ($0.90 per share), compared with $975 million ($1 per share) in the same period of 2021.

For the first six months of the fiscal year, net income was $1.24 billion ($1.27 a share). In the same period of the prior year, the company reported a loss of $82 million.

TC Energy announced a major expansion into Mexico on August 4, 2022. TC Energy and Mexico’s state-owned electricity producer Comision Federal de Electricidad (CFE) announced the launch of a $4.5 billion pipeline that will deliver natural gas from the southwestern U.S. to southern Mexico.

TC Energy said the CFE’s decision to take a 15% share in the project — the 715-kilometer offshore Southeast Gateway pipeline — is a landmark transaction for the Mexican utility as its first public-private partnership.

The Southeast Gateway pipeline is expected to be operational by 2025, and TC Energy said the project enjoys broad-based support from all levels of government, environmentalists, and regulators.

The project will allow the CFE to replace power plants currently fuelled by high-sulfur oil with natural gas-fired facilities that produce half the greenhouse-gas emissions. Over the course of this decade, Mexico’s appetite for natural gas is expected to increase by 50%.

TC Energy is also expanding into what I see as a high-growth market with strong future growth, exporting Liquid Natural Gas (LNG). Their $40-billion LNG Canada project will have an export terminal in Kitimat, B.C., at the end of TC Energy’s Coastal GasLink pipeline and aims to be up and running by 2025.

This next graphic is from TC Energy’s presentation
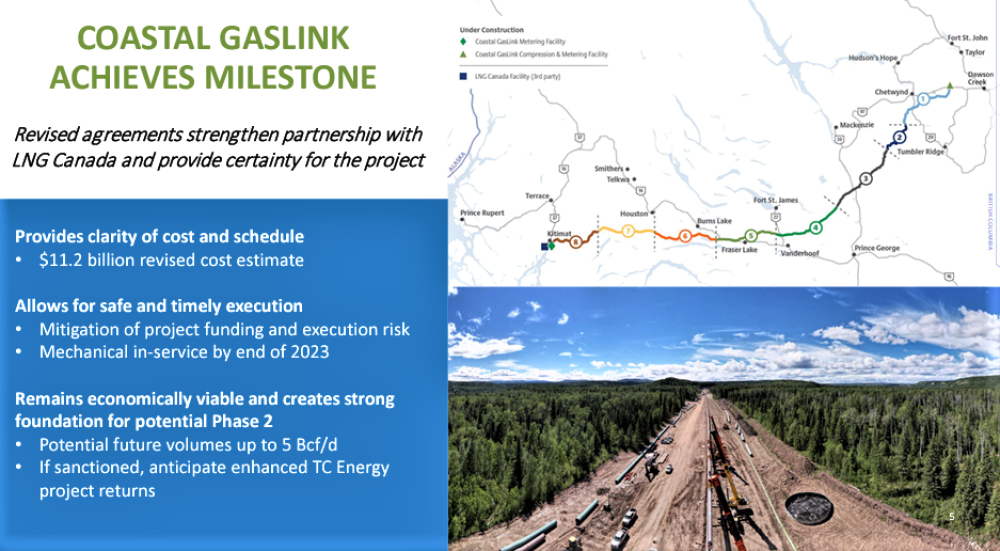
In March this year, TC Energy announced the signing of option agreements to sell a 10% equity interest in the Coastal GasLink Pipeline Limited Partnership to Indigenous communities across the project corridor.

The opportunity to become business partners through equity ownership was made available to all 20 Nations holding existing agreements with Coastal GasLink.

The formal establishment of these agreements comes from an interest expressed by Indigenous groups across the project corridor to become owners in Coastal GasLink alongside Alberta Investment Management Corporation, KKR, and TC Energy.

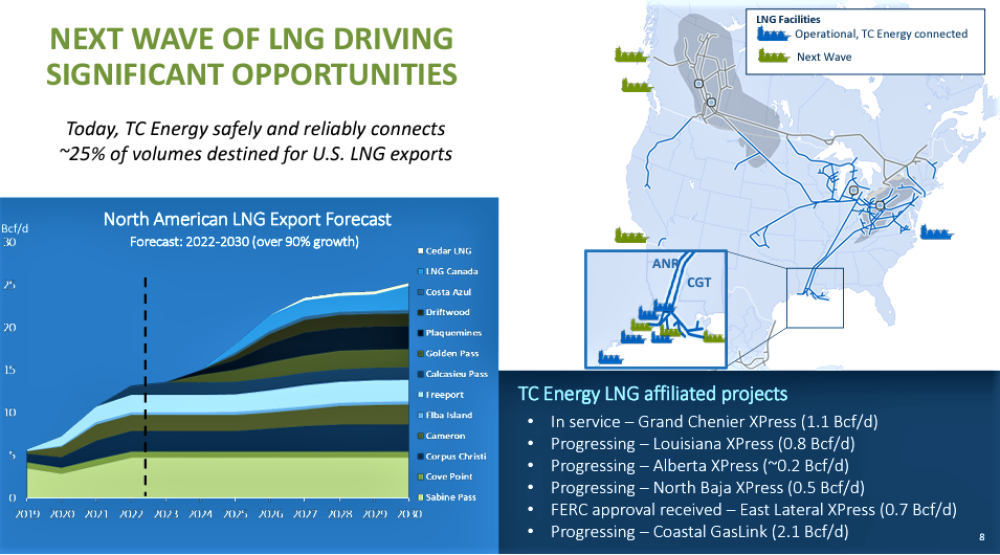
The next graphic from their presentation illustrates that TC Energy is already benefiting from the LNG boom and will continue to do so and especially with its own Kitimat terminal in 2025.
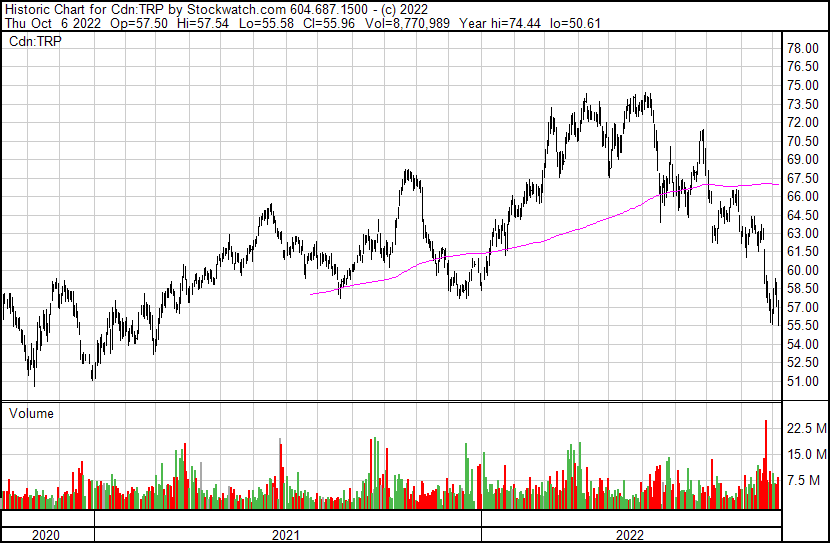
The stock has dropped to the lowest level in almost two years, simply correcting too far in sympathy with oil stocks.

It does not matter the price of oil and gas; TC Energy is paid to move it at whatever price. The stock is of great value here.
Atlas Corp.

With Atlas Corp. (ATCO:NYSE), we are sitting on a big gain from our $7.33 Buy price, and there currently is a cash offer of $15.50 per share to take Atlas private.

Assuming that happens in six months, an investor who buys the stock now would see a $1.40 return plus $0.25 in dividends for a total of $1.65 or 11.7%, not bad for six months in today’s markets.

I am surprised arbitrage traders have not bid the stock higher, but it may be a function of this terrible market.

To recap, in April 2022, Fairfax Financial Holdings Limited (“Fairfax”) exercised warrants to purchase 25.0 million common shares of Atlas. The warrants, which were originally issued on July 16, 2018, had an exercise price of $8.05 per common share for an aggregate exercise price of $201.3 million.

Immediately following this exercise, Fairfax and its affiliates held in aggregate 124,805,753 common shares, representing approximately 45.1% of the then-issued and outstanding common shares of Atlas.

Fairfax continues to hold 6.0 million warrants.

On August 4, 2022, Atlas’ Board of Directors received a non-binding proposal letter, dated August 4, 2022, from Poseidon Acquisition Corp., an entity formed by certain affiliates of Fairfax, certain affiliates of the Washington Family (“Washington”), David Sokol, Chairman of the Board of Atlas, and Ocean Network Express Pte. Ltd., and certain of their respective affiliates, to acquire all of the outstanding common shares of Atlas, other than common shares owned by Fairfax, Washington, Mr. Sokol and certain executive officers of the Company, for $14.45 cash per common share.

On Sept 28, 2022, Poseidon Acquisition Corp. revised its price upwards to $15.50 cash per common share.

On or about November 1, 2022, Atlas will pay another $0.125 dividend, and on Feb 1, 2023, another $0.125 dividend.
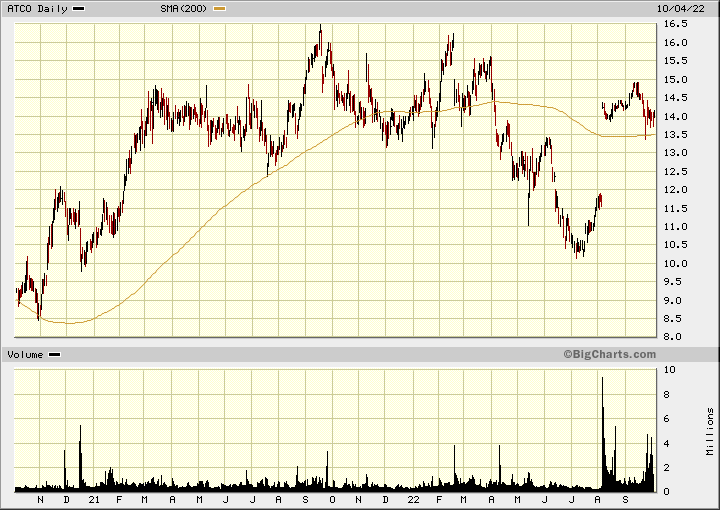
Atlas is our only shipping stock at this time, so I am suggesting replacing it with DHT Holdings.

DHT Holdings

DHT Holdings Inc. (DHT:NYSE) is an independent crude oil tanker company with a fleet trading internationally and consists of crude oil tankers in the VLCC segment.

On June 30, 2022, DHT had a fleet of 24 VLCCs, with a total dwt of 7,453,519. I have followed this company for many years and see now as a good time to buy.

A recovery in the VLCC market was expected in 2022 after two years of Covid restrictions affecting oil demand. Tankers International reported that the data shows a definite boost.

Globally they count an additional 27 monthly liftings in the VLCC spot market in the first half of this year compared to the 2021 annual average, and we are very close to reaching pre-Covid fixing volumes.

27 additional cargoes per month would employ more than 30 VLCCs full-time if they were all traded between the AG and Singapore. Of course, some travel shorter distances, and some travel further.

Then add in the Ukraine war, and we see more tankers heading to Europe to make up for Russia’s supply. All things combined have caused tanker rates to soar.

On September 12, 2022, Tradewinds reported spot tanker rates at $43,600 per day, and now they are at $49,000 per day. This is about double from a year ago. This will give a big boost to DHT’s cash flow and earnings late this year and in 2023.

September 8, 2022, DHT Holdings announced a new dividend policy with 100% of net income being returned to shareholders in the form of quarterly cash dividends. The new policy will be implemented in the third quarter of 2022.

Svein Moxnes Harfjeld, President & CEO, stated, “The key considerations behind the new policy are the strength of our balance sheet and liquidity position in combination with no current plans for significant capital expenditures. The timing of the decision and its implementation reflects our constructive market outlook.”

I expect this will result in a minimum dividend of $0.50 per year and could easily go well over $1.00 if tanker rates stay high. At a $7.40 share price and a $0.50 dividend is a 6.8% yield.

DHT had a good second quarter

Quarterly Highlights:

  • In the second quarter of 2022, the Company’s VLCCs achieved an average rate of $24,300 per day.
  • Adjusted EBITDA for the second quarter of 2022 was $32.5 million. Net profit for the quarter was $10.0 million, which equates to $0.06 per basic share.
  • In May 2022, the Company entered into agreements to sell DHT Hawk, built in 2007, and DHT Falcon, built in 2006, for $40 million and $38 million, respectively. The vessels were both delivered during the second quarter of 2022, and the sales generated a combined gain of $12.7 million. The Company repaid the outstanding debt of $13.3 million combined on the two vessels.
  • In June 2022, the Company prepaid $23.1 million under the Nordea Credit Facility. The voluntary prepayment was made under the revolving credit facility tranche and may be re-borrowed.
  • In the second quarter of 2022, the Company purchased 2,826,771 of its own shares in the open market for an aggregate consideration of $15.9 million at an average price of $5.6256. All shares were retired upon receipt.
  • For the second quarter of 2022, the Company declared a cash dividend of $0.04 per share of outstanding common stock, payable on August 30, 2022, to shareholders of record as of August 23, 2022. This marks the 50th consecutive quarterly cash dividend. The shares will trade ex-dividend from August 22, 2022.

So far, in the third quarter of 2022, 68% of the available VLCC days have been booked at an average rate of $23,600 per day on a discharge-to-discharge basis (not including any potential profit splits on time charters).

This is not much different than Q2, but as time goes on, the cheaper rates will drop off and be replaced with the higher rates that are currently in the market.

For example, in July 2022, the Company entered into a five-year time charter for DHT Osprey at $37,000 per day, with the charterer’s option to extend two additional years at $40,000 per day and $45,000 per day respectively. The vessel is expected to deliver into the contract in August.

DHT has a relatively new fleet of ships compared to most tanker companies, with only three of their 24 VLCCs pre-2011. Those three were built in 2007. Newer builds are more efficient, have less maintenance, and are not subject to discount rates that can be applied to older tankers.

At the end of 2020, Statista reports that 46% of oil tankers are 15 years old and older.

I like DHT because they are well-run and very efficient. The stock has pulled back and is not reflecting its new dividend policy, which few, if any, other tanker companies can afford to do.

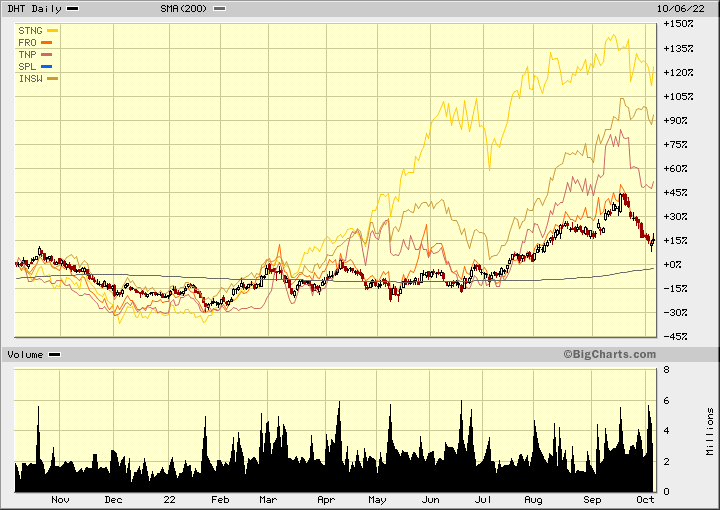
Most important is the low valuation of peers. Tanker stocks started to rally in April and May and have all pulled back in the past month. When I compared DHT to several other tanker stocks, it is at the bottom of the pack, with only a +15% gain in the past year. I see no good reason for this and believe the stock can play catch up and pay a good dividend too.
 

Struthers Stock Report Disclaimers: 

All forecasts and recommendations are based on opinion. Markets change direction with consensus beliefs, which may change at any time and without notice. The author/publisher of this publication has taken every precaution to provide the most accurate information possible. The information & data were obtained from sources believed to be reliable, but because the information & data source are beyond the author’s control, no representation or guarantee is made that it is complete or accurate.

The reader accepts information on the condition that errors or omissions shall not be made the basis for any claim, demand or cause for action. Because of the ever-changing nature of information & statistics the author/publisher strongly encourages the reader to communicate directly with the company and/or with their personal investment adviser to obtain up to date information.

Past results are not necessarily indicative of future results. Any statements non-factual in nature constitute only current opinions, which are subject to change. The author/publisher may or may not have a position in the securities and/or options relating thereto, & may make purchases and/or sales of these securities relating thereto from time to time in the open market or otherwise. Neither the information, nor opinions expressed, shall be construed as a solicitation to buy or sell any stock, futures or options contract mentioned herein. The author/publisher of this letter is not a qualified financial adviser & is not acting as such in this publication.

Disclosures: 

1) Ron Struthers: I, or members of my immediate household or family, own shares of the following companies mentioned in this article: TC Energy Corp. I personally am, or members of my immediate household or family are, paid by the following companies mentioned in this article: None. My company currently has a financial relationship with the following companies mentioned in this article: None. I determined which companies would be included in this article based on my research and understanding of the sector.

2) The following companies mentioned in this article are billboard sponsors of Streetwise Reports: None. Click here for important disclosures about sponsor fees. The information provided above is for informational purposes only and is not a recommendation to buy or sell any security.

3) Statements and opinions expressed are the opinions of the author and not of Streetwise Reports or its officers. The author is wholly responsible for the validity of the statements. The author was not paid by Streetwise Reports for this article. Streetwise Reports was not paid by the author to publish or syndicate this article. Streetwise Reports requires contributing authors to disclose any shareholdings in, or economic relationships with, companies that they write about. Streetwise Reports relies upon the authors to accurately provide this information and Streetwise Reports has no means of verifying its accuracy.

4) This article does not constitute investment advice. Each reader is encouraged to consult with his or her individual financial professional and any action a reader takes as a result of information presented here is his or her own responsibility. By opening this page, each reader accepts and agrees to Streetwise Reports’ terms of use and full legal disclaimer. This article is not a solicitation for investment. Streetwise Reports does not render general or specific investment advice and the information on Streetwise Reports should not be considered a recommendation to buy or sell any security. Streetwise Reports does not endorse or recommend the business, products, services, or securities of any company mentioned on Streetwise Reports.

5) From time to time, Streetwise Reports LLC and its directors, officers, employees, or members of their families, as well as persons interviewed for articles and interviews on the site, may have a long or short position in the securities mentioned. Directors, officers, employees, or members of their immediate families are prohibited from making purchases and/or sales of those securities in the open market or otherwise from the time of the decision to publish an article until three business days after the publication of the article. The foregoing prohibition does not apply to articles that in substance only restate previously published company releases.
 

NIO Stock declined by -7.76 percent from Thursday’s close – October 7th 2022

By InvestMacro.com | #stocks #NIO #technology

NIO Inc. End of Day Update: October 7th 2022

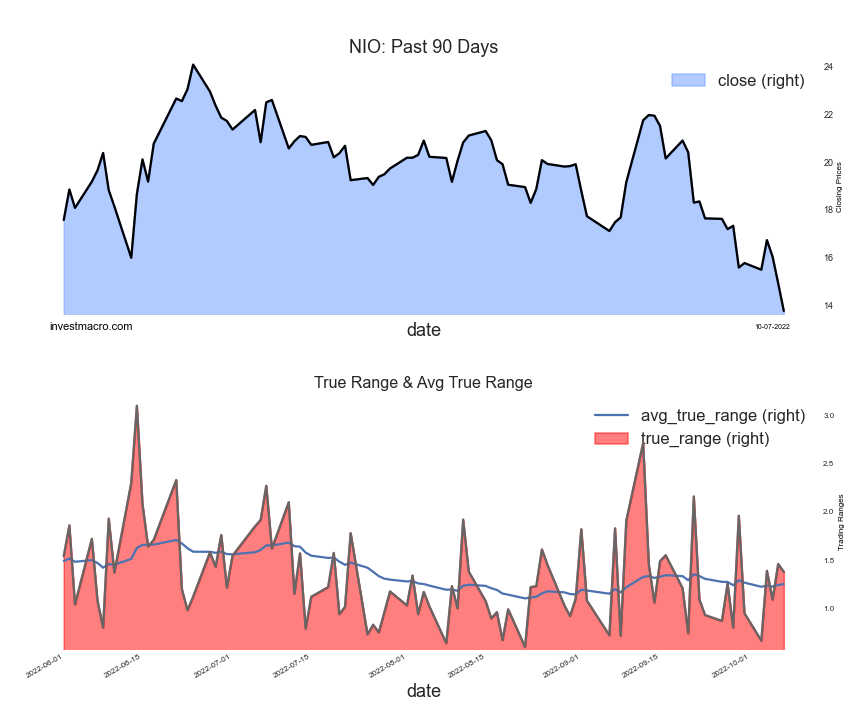
The NIO Inc. (NIO) stock finished the day with a fall of -7.76 percent compared to Thursday’s close and ended the day around the 13.76 price level, according to unofficial data at the New York close.

NIO, a Chinese technology and electric car company, gapped-lower to open the day trading at 14.29 with the high of the day being just a bit higher at 14.53 while the low of the day was at 13.54.

This was the second straight day the NIO stock fell sharply and it is currently trading at the lowest level since May.

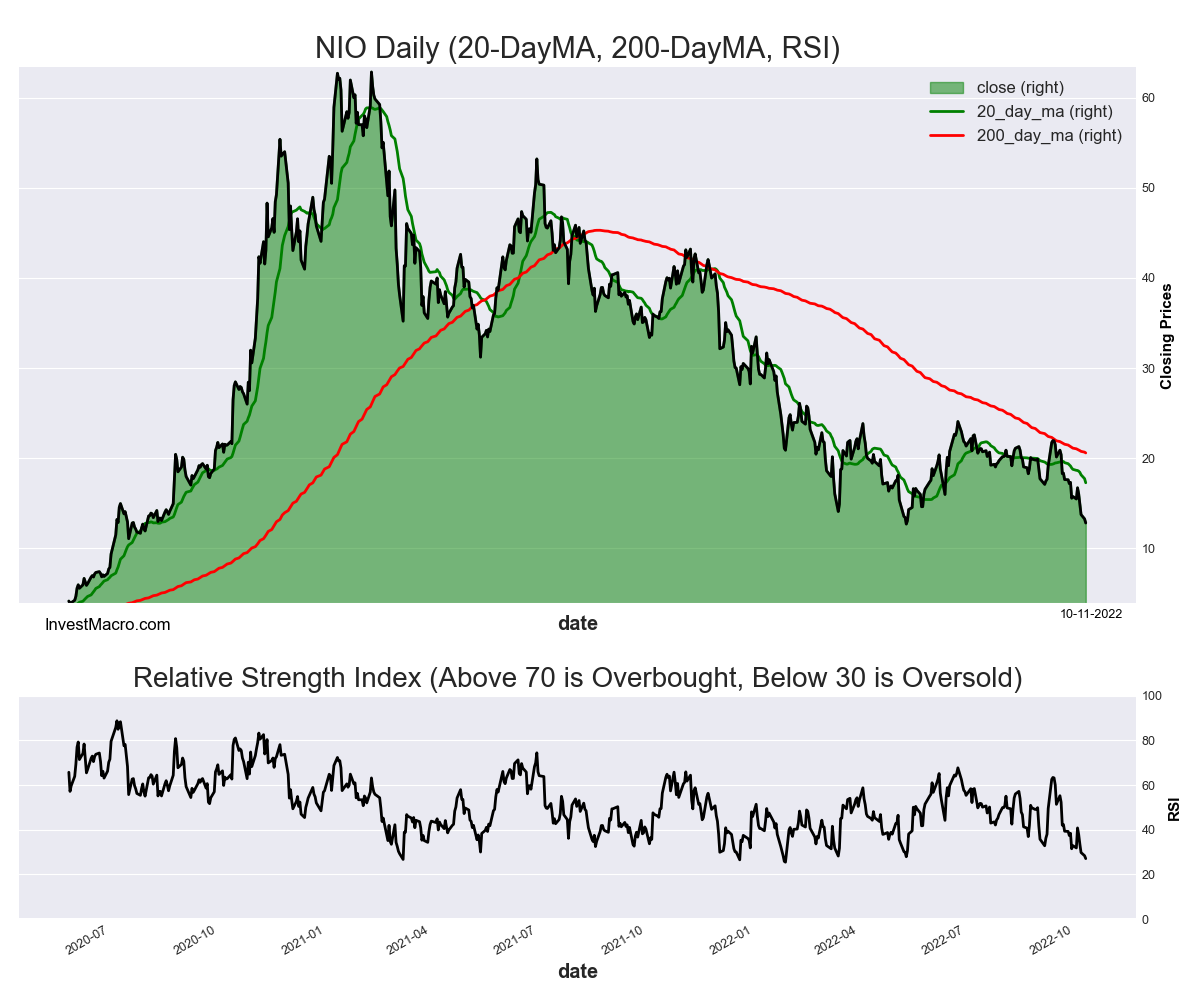
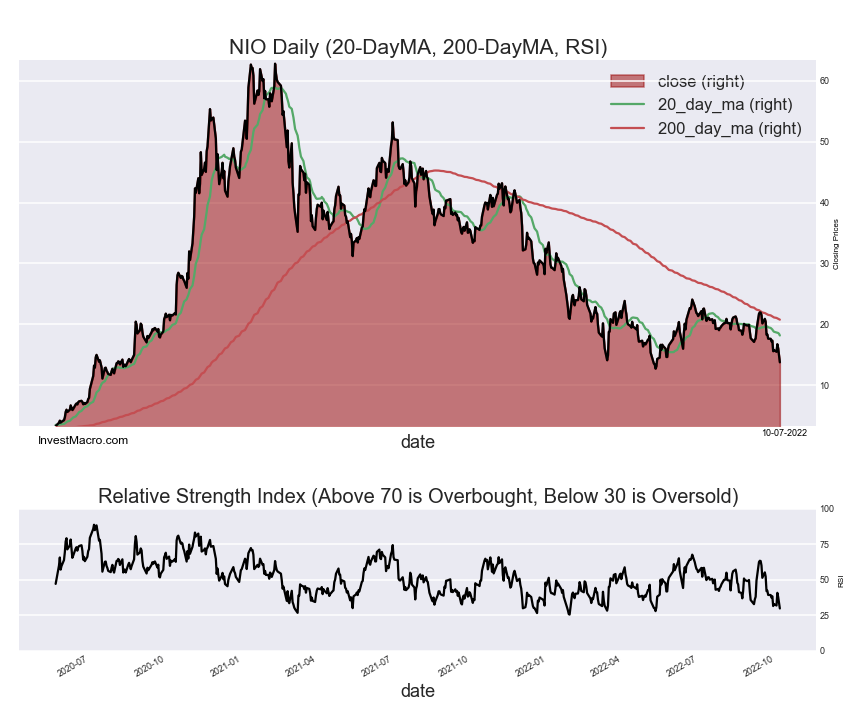
As you can see from the chart, the 200-day moving average has turned over and been trending lower since the 4th quarter of 2021 while the 20-day moving average is also currently trending down.

NIO Stock declined by -7.76 percent from Thursday's close

The NIO RSI level is Bearish-Oversold

The Relative Strength Index, an indicator that can indicate overbought (above 70) and oversold levels (below 30), shows that the current RSI score is at 29.8 for a Bearish-Oversold reading on the daily time-frame.

NIO Price Trends

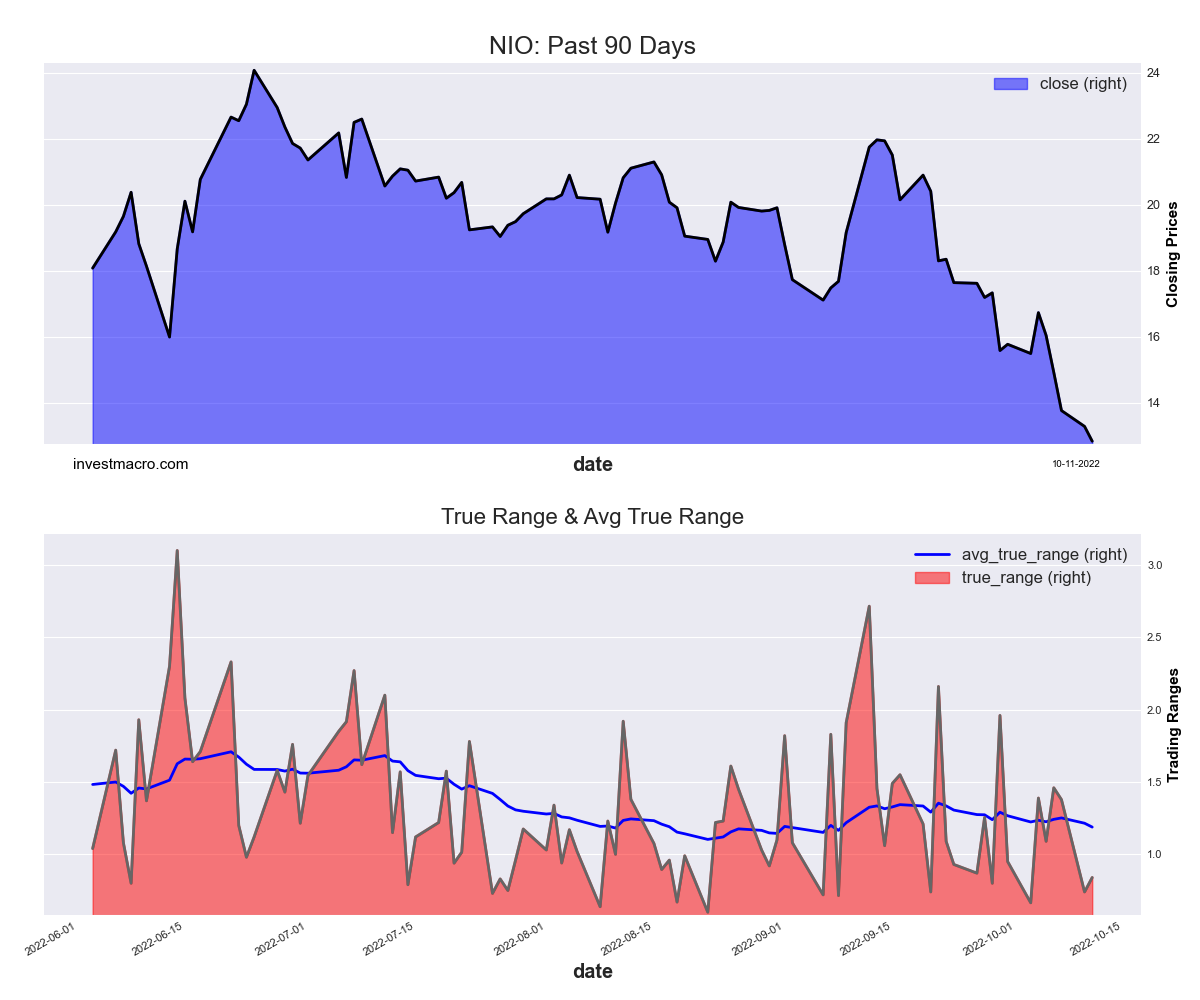
The NIO has declined by -22.00 percent over the past 10 days while seeing a fall of -31.47 over the past 30 days. The 90-day change is -20.87 while the 180-day return and the 365-day return are -52.76 and -66.59, respectively.

NIO has declined by -22.00 percent over the past 10 days while seeing a fall of -31.47 over the past 30 days.

By InvestMacro.com – Get our periodic stock market newsletter for news & updates on stocks

AMD Stock price dropped by -15.07 percent from Thursday close – October 7th 2022

By InvestMacro.com | #stocks #AMD

Advanced Micro Devices, Inc. End of Day Update: October 7th 2022

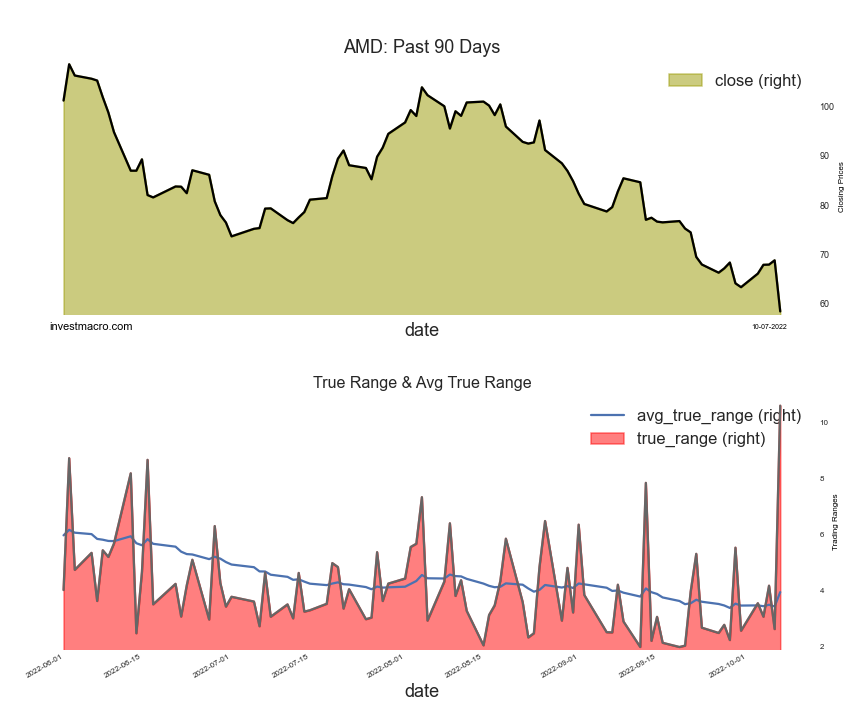
The Advanced Micro Devices, Inc. (AMD) stock finished the day with a decrease of -15.07 percent compared to yesterday’s closing price and closed the day around the 58.44 price level, according to unofficial data at the New York close.

AMD opened the day trading at 64.01, a gap down of about four dollars lower than Thursday’s closing, reaching a high of the day at 64.03 and with the low of the day at 58.22.

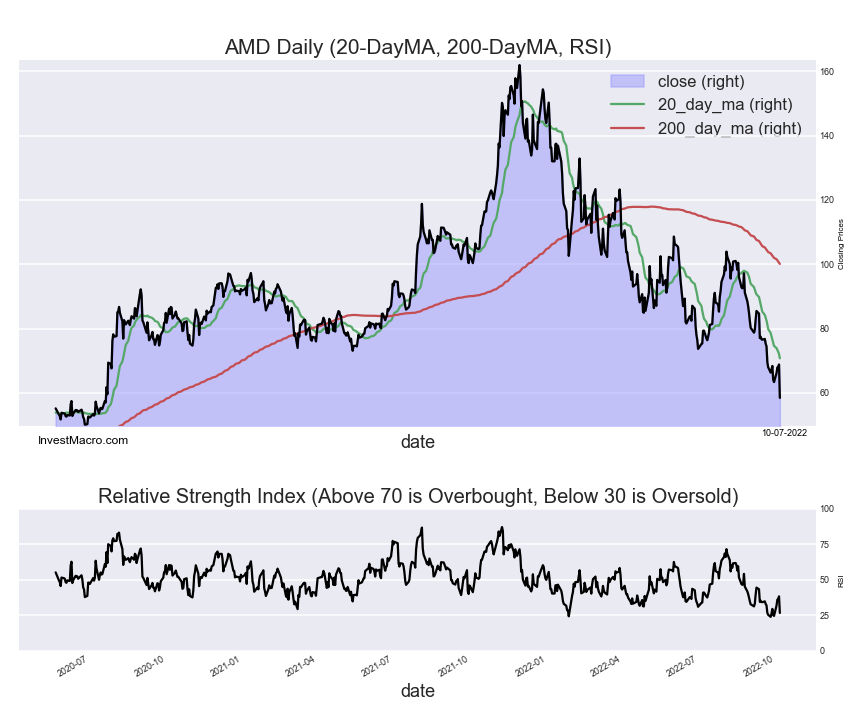
Advanced Micro Devices, a US technology company specializing in processing, has been on a strong downtrend since reaching a high above $160 in November of 2021. Today’s price hitting the lowest levels since July of 2020.

The stock is under the 20-day moving average and has been under the 200-day moving average since March.

AMD Stock price dropped by -15.07 percent from Thursday close

The AMD RSI level is Bearish-Oversold

The Relative Strength Index, an indicator that can indicate overbought (above 70) and oversold levels (below 30), shows that the current RSI score is at 26.6 for a Bearish-Oversold reading on the daily time-frame.

AMD Price Trends

The AMD is lower by -14.01 percent over the past 10 days while seeing a slide of -39.86 over the past 30 days. The 90-day change is -42.63 while the 180-day return and the 365-day return are -52.06 and -30.45, respectively.

AMD RSI level is Bearish-Oversold

By InvestMacro.com – Get our periodic stock market newsletter for news & updates on stocks

Lockheed Martin LMT Stock rose by 1.01 percent today – October 7th 2022

By InvestMacro.com | #stocks #LMT #Lockheed

Lockheed Martin Corporation End of Day Update: October 7th 2022

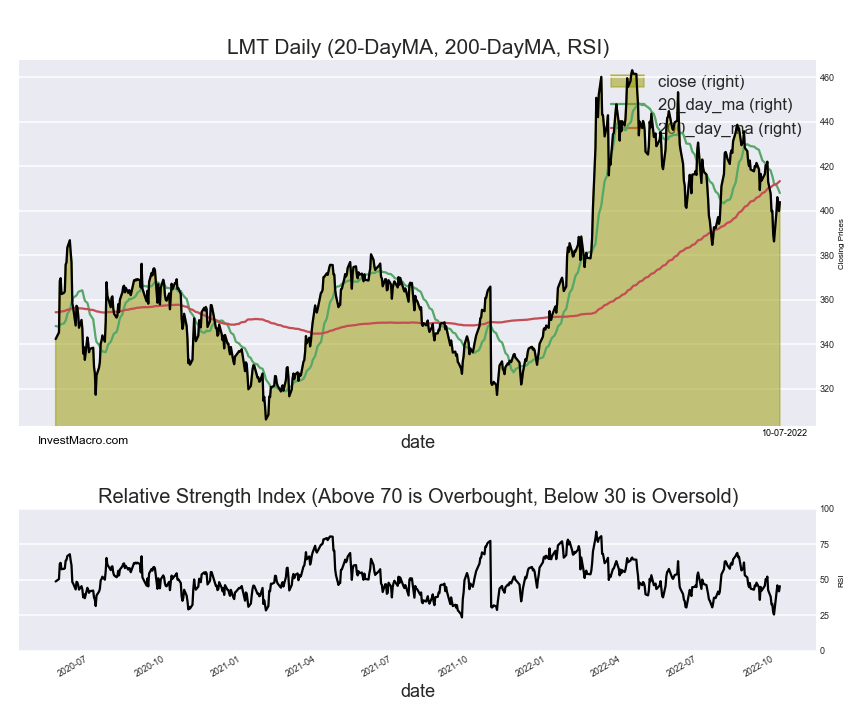
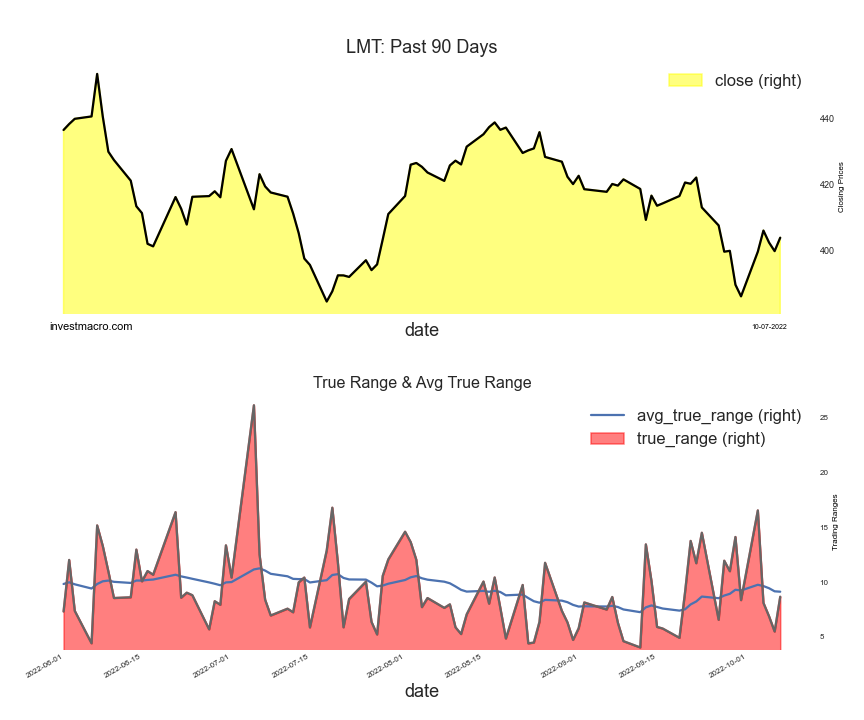
The Lockheed Martin Corporation (LMT) stock bucked the stock market down-trend for the day and finished the day with a gain of 1.01 percent. LMT closed the day around the 403.96 price level, according to unofficial data at the New York close.

Lockheed Martin, a US aerospace and defense company, opened the day trading at 398.56 with the high of the day being 404.67 and the low of the day touching 396.01.

LMT is currently trading below the 20-day moving average and just recently in late September fell below its 200-day moving average.

Lockheed Martin LMT Stock tose by 1.01 percent today

The LMT RSI level is Bearish

The Relative Strength Index, an indicator that can indicate overbought (above 70) and oversold levels (below 30), shows that the current RSI score is at 45.5 for a Bearish reading on the daily time-frame.

LMT Price Trends

The LMT has slid by -2.21 percent over the past 10 days while seeing a fall of -7.30 over the past 30 days. The 90-day change is -7.61 while the 180-day return and the 365-day return are 9.83 and 12.95, respectively.

LMT RSI level is Bearish

By InvestMacro.com – Get our periodic stock market newsletter for news & updates on stocks

NVDA Stock today dropped by -9.40 percent – October 7th 2022

By InvestMacro.com | #stocks #NVDA #NVIDIA

NVIDIA Corporation End of Day Update: October 7th 2022

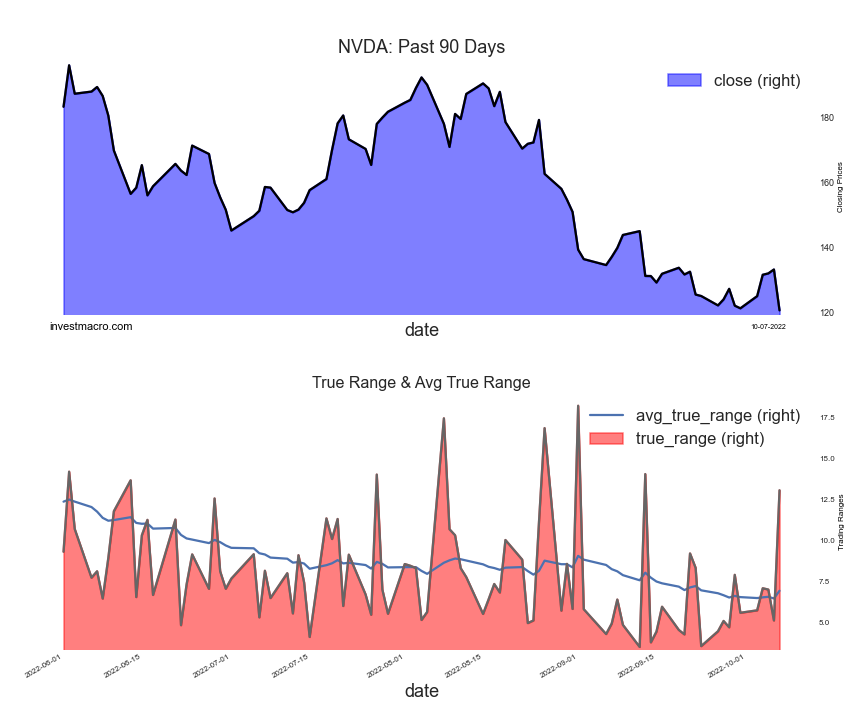
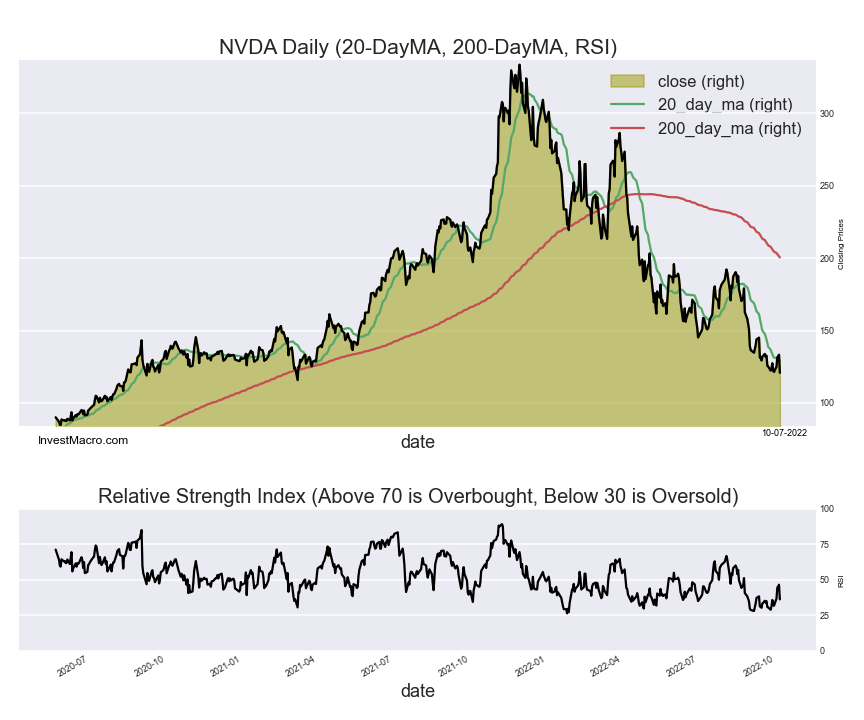
The NVIDIA Corporation (NVDA) stock finished the day with a lowering of -9.40 percent and closed the day around the 120.76 price level, according to unofficial data at the New York close.

NVDA, a US technology company known for its GPU parts in performance computing, opened the day trading at 125.05 with the high being 126.69 while the low of the day touched 120.22.

The stock is trading below both its 20-day and 200-day moving averages as NVDA has been in a steep downtrend and trades at almost a third of its 2021 high-point.

NVDA Stock today dropped by -9.40 percent

The NVDA RSI level is Bearish

The Relative Strength Index, an indicator that can indicate overbought (above 70) and oversold levels (below 30), shows that the current RSI score is at 36.2 for a Bearish reading on the daily time-frame.

NVDA Price Trends

NVDA has fallen by -3.52 percent over the past 10 days while seeing a fall of -32.59 over the past 30 days. The 90-day change is -35.31 while the 180-day return and the 365-day return are -49.98 and -20.87, respectively.

NVDA has fallen by -3.52 percent over the past 10 days

By InvestMacro.com – Get our periodic stock market newsletter for news & updates on stocks

TSLA Stock slid by -7.46 percent – October 7th 2022

By InvestMacro.com | #stocks #TSLA #tesla

Tesla, Inc. End of Day Update: October 7th 2022

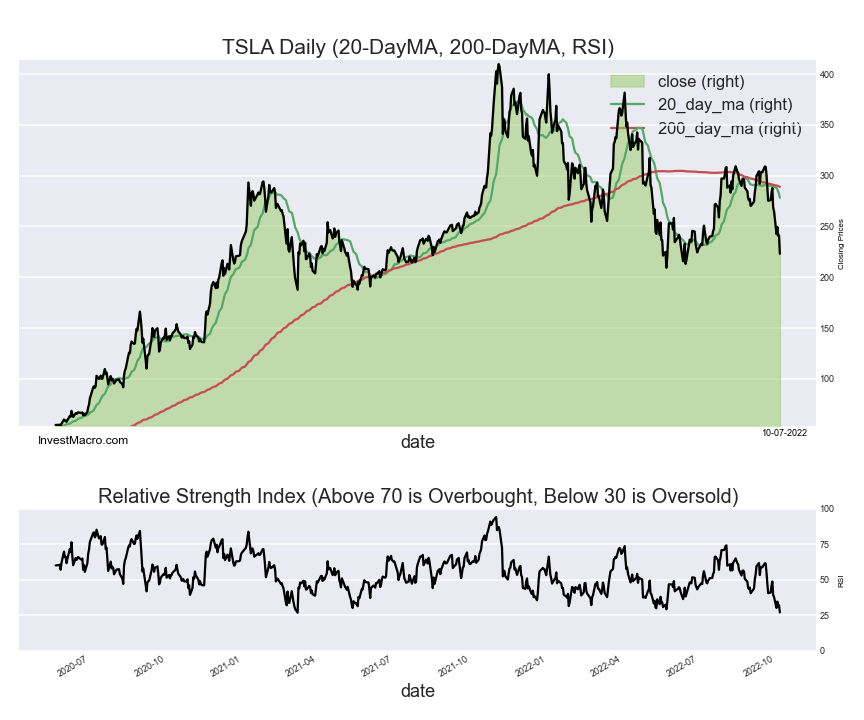
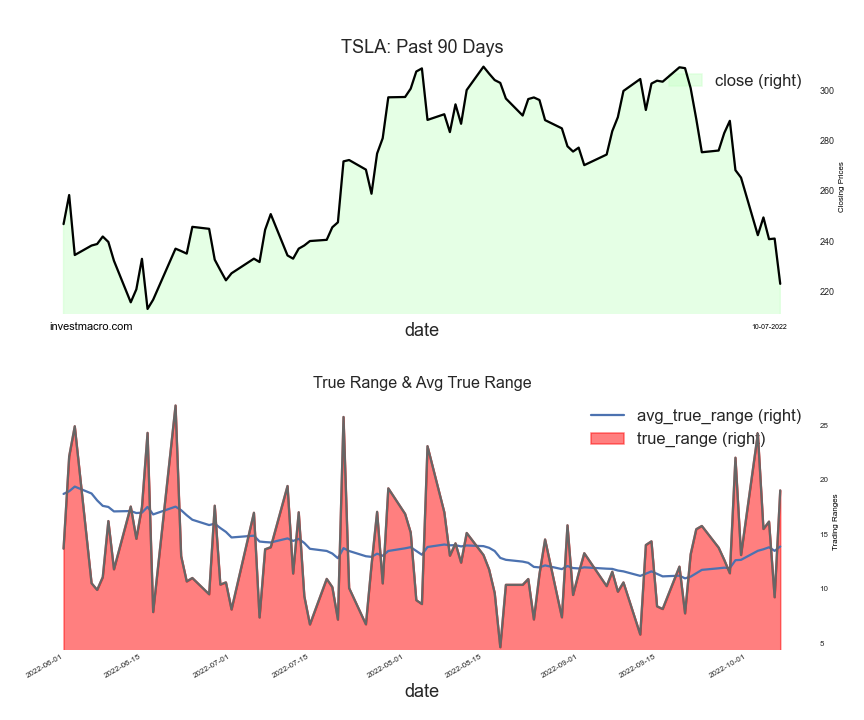
The Tesla, Inc. (TSLA) stock finished the day with a decline of -7.46 percent and closed the day around the 223.07 price level, according to unofficial data at the New York close.

TSLA opened the day trading at 233.93 with the high of the day being 234.57 and the low bottoming for the day at 222.02.

TSLA is below both the 20-day and 200-day moving averages currently after the stock dropped below the $300 price level and both moving averages in late September.
TSLA Stock slid by -7.46 percent - October 7th 2022

The TSLA RSI level is Bearish-Oversold

The Relative Strength Index, an indicator that can indicate overbought (above 70) and oversold levels (below 30), shows that the current RSI score is at 27.0 for a Bearish-Oversold reading on the daily time-frame.

TSLA Price Trends

The TSLA has declined by -18.98 percent over the past 10 days while seeing a step lower by -24.66 over the past 30 days. The 90-day change is -11.74 while the 180-day return and the 365-day return are -32.83 and -3.63, respectively.

By investmacro.com

Elon Musk argues Twitter is better off without a board of directors – is he right?

By Michael Withers, Texas A&M University and Steven Boivie, Texas A&M University 

After a wild ride, it looks like Elon Musk’s bid to buy Twitter may be back on.

Twitter’s board of directors had sued the Tesla billionaire in July 2022 when Musk tried to terminate the US$44 billion deal. The board has yet to drop its lawsuit, with a trial still scheduled to begin Oct. 17, 2022, which was intended to force Musk to complete the buyout.

The board has in fact been at the center of this saga since the beginning, when Musk launched his hostile takeover bid while criticizing board members for owning almost no shares of the company they oversee. Twitter founder Jack Dorsey called the board the “dysfunction of the company.”

As experts on corporate governance, we believe this feud raised two important corporate governance questions: What purpose does a board of directors serve? And does it matter if a member owns company stock or not?

‘A bad board will kill’

“Good boards don’t create good companies, but a bad board will kill a company every time.”

Venture capitalist Fred Destin wrote that in 2018, citing what he called an “old Silicon Valley proverb.” The quote has been making the rounds on Twitter recently in light of Musk’s hostile bid. It even seemed to get a nod from Dorsey himself when he replied to a tweet containing the quote with “big facts.”

This tweet and the general conversation that has emerged have important implications for understanding boards and their role in shepherding a company.

Broadly speaking, a board’s most important roles include hiring, paying and monitoring the chief executive officer.

Academic research suggests that board members at large companies – who typically receive generous compensation packages – may be limited in their ability to perform these tasks effectively. In our work, we found that boards often find it impossible to conduct adequate monitoring and rein in wayward CEOs because there’s just so much information for modern boards to process with their limited time. And the social dynamics involved in the board also make it difficult for directors to speak up and oppose other directors.

In a separate study involving face-to-face interviews with directors, we were consistently told that directors take their board service seriously and operate with their companies’ best interests in mind. But they do so with an eye toward collaborating with the CEO and the rest of the executive team rather than serving as impartial observers, as their “independent” status suggests they should.

While our work didn’t focus on this, if the board and the CEO fundamentally disagree about the direction of company – which was often the case between Dorsey and the Twitter board – it would certainly be problematic and could lead to less than optimal decisions being made.

In other words, a board that isn’t functioning effectively can definitely destroy a company’s value. And some reporting suggests that’s what happened to Twitter, whose shares were trading at less than half their 2021 peak before Musk disclosed he had amassed a 9% ownership stake.

A raider’s lament

That brings us to the next question: Does not owning a significant stake in a company you oversee make it more likely that you’ll run it into the ground, as Musk seemed to suggest?

A few days after making his takeover offer on April 14, the billionaire, responding to a tweet showing how few shares Twitter board members own, posted that its directors’ “economic interests are simply not aligned with shareholders.”

Musk’s arguments harked back to takeover bids from the 1980s in which activist investors – or “corporate raiders” – would argue that executives’ interests did not align with those of shareholders. As Gordon Gekko from the film “Wall Street” famously railed against executives of a business he wanted to take over, “Today, management has no stake in the company!”

Musk’s words echo Gekko’s “greed is good” speech, except in regard to independent directors, who comprise the vast majority of corporate boards. By definition, an independent or outside director is one who doesn’t hold an executive role in running the company, such as chief executive officer or chief financial officer.

‘Greed is good’

In reality, Twitter’s board share ownership is very similar to that of other companies.

Independent Twitter directors held a median ownership stake of 0.003% as of May 2022. For comparison, we looked at equity ownership of independent directors of companies listed in the S&P 500 stock index in 2021. We found the median stake was less than 0.01%, and all but a handful of directors held less than 1% of the company’s stock. Median ownership at Musk’s company Tesla is similarly minuscule, at 0.23%.

Whether this makes a difference to a company’s success is hard to assess because research on the topic is rather sparse, in large part because board members have so little equity.

Mixed research

Academic researchers on effective corporate governance in the 1970s argued that outside directors should avoid owning many shares in the companies they oversee to maintain objectivity. More recently, management scholars have suggested that higher stakes could provide a way to motivate directors to monitor management and make decisions more in line with shareholder interests.

Some researchers have found that boards with larger ownership stakes can improve a company’s operational performance and better align outside directors with the interests of shareholders.

But other work that examined multiple studies shows the impact of director stock ownership is mixed at best, with some studies suggesting higher stakes potentially lead to negative outcomes, such as excessive executive and director compensation.

Since the passage of the Sarbanes–Oxley Act of 2002 after massive accounting scandals at Enron, WorldCom and elsewhere, corporate governance issues such as board oversight have become increasingly important. This led to a number of changes intended to align the interests of managers and those of shareholders, including a focus on board independence and adjusting executive compensation.

Although our research shows boards are limited in their ability to monitor management, they’re still better than nothing.

In his original letter to shareholders announcing his bid, Musk vowed to “unlock” Twitter’s potential as a private company, without a public board. We may finally learn if he’s right.

This is article has been updated to reflect the changing status of the Twitter deal.The Conversation

About the Author:

Michael Withers, Associate Professor of Business, Texas A&M University and Steven Boivie, Professor of Management, Texas A&M University

This article is republished from The Conversation under a Creative Commons license. Read the original article.

XLU Utilities ETF decreased by -2.85 percent – October 06 2022

By InvestMacro.com | #stocks #XLU #utilities

Utilities Select Sector SPDR Fund End of Day Update: October 06 2022

The Utilities Select Sector SPDR Fund (XLU) ETF finished the day with a fall of -2.85 percent and closed the day not too far off the lows of the day near the 65.41 price level, according to unofficial data at the New York close.

The XLU, an ETF that tracks the SP500 Utilities Select Sector Index, opened the day trading at 67.04 with the high of the day being 67.15 and the low of the day at 65.32.

XLU has recently fallen below the 200-day moving average and has seen a deep descend after hitting a recent high over $78.00 in the middle of September.

XLU Utilities ETF decreased by -2.85 percent

The XLU RSI level is Bearish

The Relative Strength Index, an indicator that can indicate overbought (above 70) and oversold levels (below 30), shows that the current RSI score is at 31.0 for a Bearish reading on the daily time-frame.

XLU has fallen by -9.90 percent over the past 10 days while seeing a decrease by -14.41 over the past 30 days

XLU Price Trends

The XLU has fallen by -9.90 percent over the past 10 days while seeing a decrease by -14.41 over the past 30 days. The 90-day change is -12.52 while the 180-day return and the 365-day return are -3.64 and 3.40, respectively.

By investmacro.com