Archive for Stock Market News – Page 3

Would You Invest in a Despised Company?

Source: Chris Reilly (8/20/25)

Chris Reilly of RiskHedge takes a look at how some of the most influential market-changing businesses were once despised.

You’ve heard of the phrase “buy when there’s blood in the streets.”

Baron Rothschild invented this expression in 1815 during the Battle of Waterloo. While British forces clashed with Napoleon’s army, the Baron wagered his entire personal wealth on British government securities.

No one was willing to finance Britain when defeat seemed possible, but Rothschild deployed his capital when the streets were literally covered in blood.

And following Britain’s victory over Napoleon, he catapulted to the pinnacle of global wealth rankings.

Rothschild employed one of the most reliable strategies for financial success. He identified an asset everyone avoided . . .  Acquired it . . . And patiently waited for sentiment to shift in his direction.

Purchasing a disliked investment is challenging in practice. You’ll experience feelings of recklessness. Yet acquiring underappreciated gems frequently leads to substantial returns. Indeed, numerous revolutionary market leaders share an unusual characteristic — they were initially disliked.

Consider Netflix

We recognize Netflix Inc. (NFLX:NASDAQ) as the innovator that created online streaming. But previously. . .

Netflix began as the pioneer in digital DVD rental services. Remember ordering films online and receiving discs in your mailbox days later? Americans adored the original Netflix. You enjoyed unlimited films for merely $10 monthly.

Netflix eliminated the worst aspect of movie rentals: late penalties. In fact, it was so popular that many Americans barely noticed when Netflix introduced streaming in 2007. They preferred physical discs! By 2011, Netflix had surpassed 20 million subscribers. And they continued shipping millions of DVDs in their signature envelopes daily.

Additionally, they were spending $600 million on postal expenses. Netflix CEO Reed Hastings developed a strategic plan to transition customers away from physical media.

He recognized streaming would eventually eliminate physical formats. So Hastings decided it was time to make a decisive move toward streaming. Against his team’s recommendations, he divided Netflix subscriptions. Customers could now stream content for just $8 monthly.

However, those still wanting DVD rentals would need to pay $16 monthly — a 60% increase. While Netflix was prepared to commit fully to streaming, customers weren’t — and they rebelled. Netflix lost approximately one million subscribers within several months. And its stock value dropped 77%:

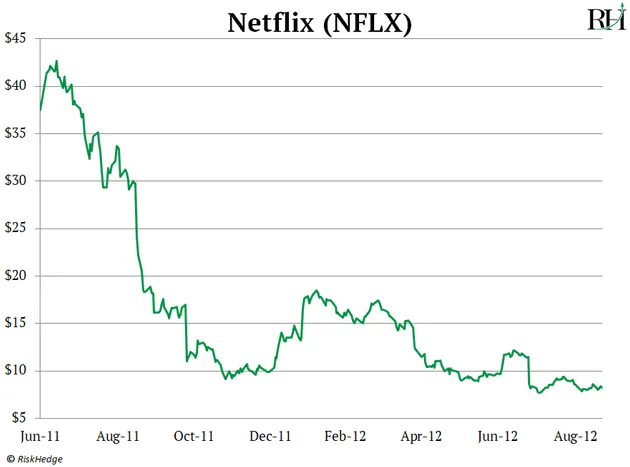
Hastings’ reputation plummeted. He transitioned from being named Fortune’s Businessperson of the Year in 2010 . . .  to The New York Times’ “Worst CEO” of 2011.

Interestingly, this presented an extraordinary opportunity to acquire Netflix shares. Hastings’ transition to streaming proved to be among the most brilliant corporate decisions. As streaming quality improved, most consumers discarded their DVD players.

Indeed, Netflix completely transformed our viewing habits. Physical DVDs now seem prehistoric. Netflix had 20 million paying subscribers in 2011 when they gambled everything on streaming. Today they exceed 300 million. And investors who purchased Netflix in 2011, when most avoided it, have realized enormous profits.

Now, Examine Tesla

During Tesla Inc.’s (TSLA:NASDAQ) initial decade, Tesla exclusively sold luxury electric vehicles exceeding $70,000. But in 2016, Musk unveiled their first mainstream vehicle, the Model 3. Tesla planned to price the Model 3 at just $35,000, making it accessible to millions of middle-income buyers.

This vehicle was poised to revolutionize the automotive industry. Its introduction should have marked Tesla’s defining moment. Instead, it nearly bankrupted the company. In 2015, Tesla was manufacturing approximately three vehicles daily.

To successfully produce the mainstream Model 3, they would need to manufacture 5,000 vehicles weekly. Tesla wasn’t prepared for this massive production increase and consistently missed targets.

Elon Musk worked 22 hours daily, seven days a week, addressing production challenges. He regularly slept at the factory because he “didn’t have time to go home and shower.” Yet almost a year after the Model 3 launch, Tesla still struggled to produce even 2,000 vehicles weekly. When earnings declined due to unexpectedly high production expenses, its stock plunged to nearly its lowest point since 2016:

Tesla’s shares had stagnated for five years, becoming Wall Street’s most despised stock. Investment bank Morgan Stanley reduced its worst-case projection to $10/share. Investors wagered a record $15 billion against Tesla’s stock. This was more than twice the amount bet against any other market stock.

Just as collapse seemed imminent, Tesla rebounded dramatically. In late 2019, they surprised Wall Street by delivering a record 97,000 vehicles. Tesla followed with another milestone, shipping over 100,000 vehicles in a single quarter for the first time. Investors who purchased Tesla at its lowest point have been handsomely rewarded.

What’s the Key To Investing in Despised Stocks?

Investing revolves around expectations. Stocks frequently rise — and fall — based on performance relative to investor expectations. When people believe a company will dominate globally, it creates a significant threshold that’s difficult to surpass.

For instance, in 2006, Alphabet Inc. Class A (GOOGL:NASDAQ)  announced a 97% revenue increase. You might assume the stock soared following exceptional earnings, correct?

Instead, it plummeted 16% at market opening. Essentially, Wall Street was disappointed because analysts expected Google to grow revenue by over 100%.

Conversely, when investors dislike a stock, they establish such minimal expectations that exceeding them becomes almost inevitable.

So when a disliked company — like Tesla — delivers more vehicles than investors anticipate, its value skyrockets. Ultimately, if you’re seeking substantial returns, you should consider investing in despised stocks.

For more insights, subscribe to our investing letter, The Jolt.

We publish fresh research and analysis on today’s big disruption investing opportunities.

Click here to subscribe.

Important Disclosures:

  1. As of the date of this article, officers and/or employees of Streetwise Reports LLC (including members of their household) own securities of Tesla Inc.
  2. Chris Reilly: I, or members of my immediate household or family, own securities of: None. My company has a financial relationship with: None. My company has purchased stocks mentioned in this article for my management clients: None. I determined which companies would be included in this article based on my research and understanding of the sector.
  3. Statements and opinions expressed are the opinions of the author and not of Streetwise Reports, Street Smart, or their officers. The author is wholly responsible for the accuracy of the statements. Streetwise Reports was not paid by the author to publish or syndicate this article. Streetwise Reports requires contributing authors to disclose any shareholdings in, or economic relationships with, companies that they write about. Any disclosures from the author can be found  below. Streetwise Reports relies upon the authors to accurately provide this information and Streetwise Reports has no means of verifying its accuracy.
  4.  This article does not constitute investment advice and is not a solicitation for any investment. Streetwise Reports does not render general or specific investment advice and the information on Streetwise Reports should not be considered a recommendation to buy or sell any security. Each reader is encouraged to consult with his or her personal financial adviser and perform their own comprehensive investment research. By opening this page, each reader accepts and agrees to Streetwise Reports’ terms of use and full legal disclaimer. Streetwise Reports does not endorse or recommend the business, products, services or securities of any company.

For additional disclosures, please click here.

Cleantech Co. Advances Innovative Systems for Data Centers

Source: Streetwise Reports (8/19/25)

Environmental and cleantech company BioLargo Inc. (BLGO:OTCQX) announces its financial results, including a huge increase in revenue in its engineering segment due to contracts to provide control compliance services.

Environmental and cleantech company BioLargo Inc. (BLGO:OTCQX) announced that new engineering contracts to provide air quality control compliance services has increased its engineering segment revenue by 517%.

However, due to decreased volume of sales of its pet odor product Poop, overall revenues fell to US$ 2.78 million in the second quarter of this year and US$6.046 million in the first half, the company said in a release on August 13.

The company had reported in its annual report that it had achieved record revenues in 2024, marking a 45% increase compared to the previous year, largely driven by the success of Pooph. For the year ending December 31, 2024, revenues reached US$17,779,000, reflecting a 45% increase over 2023 and marking the 10th consecutive year of revenue growth, according to the company.

“There are many important technologies and products in our portfolio that will have a major role in industry,” President and Chief Executive Officer Dennis P. Calvert said.

He continued, “Over the past few months and quarters, our team has done a tremendous job in progressing the overall value of the BioLargo portfolio … the unseen value is many multiples of our current US$50 million market cap, driven by our unmatched technologies, capital-conserving strategy, highly qualified people and high impact.”

“We are very optimistic with our emerging solutions surrounding surgical products, water treatment for the global PFAS contamination crisis and battery energy storage technology,” Calvert said. “Our team is focused on creating optimal partnerships to drive commercialization of these solutions across varying industries.”

Calvert noted that BioLargo’s investments in these technologies have yielded a suite of validated technical claims and product features that “we believe are unmatched in the marketplace.” This diversification strategy has proved “especially wise” as BioLargo advances its commercial efforts into high-growth opportunities like its Clyra and Cellinity technologies, Calvert has said.

According to the company, here are some of the other key highlights of the report:

  • Clyra Medical Technologies secured a series of sales and distribution agreements to make its products available to 6,100 hospitals, 6,300 ambulatory surgery centers, and 2,200 specialty wound care clinics in the U.S. alone.
  • An independent evaluation by U.S. BESS Corporation, a leading provider of advanced energy storage solutions, confirmed the breakthrough performance of BioLargo’s Cellinity battery technology for grid-scale energy storage.
  • Cellinity, our innovative battery technology, signed four memoranda of understanding (MOUs) with prospective joint venture partners interested in building and operating Cellinity battery factories.
  • Garratt Callahan, one of the company’s co-development technology partners, continued efforts in selling and business development, focusing on the reuse of cooling tower water, such as at data centers.
  • Engineering & Environmental Services is actively working with clients to develop scopes of work and budgets for several significant projects.
  • As of June 30, 2025, stockholders’ equity was $6,060,000, assets totaled $12,499,000, liabilities were $6,439,000, and the company held $3,471,000 in cash and cash equivalents.

Independent Evaluation Confirms Advantages of Cellinity

In June, BioLargo announced that an independent evaluation had confirmed the significant advantages of its Cellinity battery technology for grid-scale energy storage systems. The assessment was carried out by U.S. BESS Corp. is a leading provider of advanced energy storage solutions for critical infrastructure in utilities, defense, microgrids, and heavy industry, according to BioLargo.

“Based on our inspection and the evidence provided, U.S. BESS finds that the Cellinity Cell demonstrates a sufficient performance profile, with strong indications of high thermal stability, efficiency, energy and power density, and material sustainability, to suggest further investment in testing and commercialization,” the report stated. “These attributes position this technology as a potential solution for critical gaps in grid-scale energy storage markets.”

The senior technical team at U.S. BESS conducted a thorough review of Cellinity’s design and assembly processes, inspected the testing infrastructure, analyzed test data, and evaluated the methodologies used for performance characterization.

U.S. BESS Corp. further determined that it is reasonable to assert that: a) the cell would not undergo thermal runaway, b) the materials used in its construction are commonly available and can be sourced domestically, c) the cell does not incorporate rare earth elements, and d) the components of the cell are fully recyclable.

Analyst Maintains Rating, Price Target

In a July 23 research note, Oak Ridge Financial Analyst Richard Ryan noted, “BioLargo’s business model approach is to invent or acquire novel technologies, develop them into product offerings, and extend their commercial reach through licensing and channel partnerships to maximize their impact.”

This cleantech and life sciences innovator, according to the analyst, has several core products that address PFAS (also known as “forever chemicals” because of the time they take to break down) contamination, advanced water and wastewater treatment, odor and volatile organic compound control, air quality improvement, energy efficiency and safe onsite energy storage, and infection control. BioLargo remains a Buy, according to Ryan.

Ryan noted that in a letter to shareholders in July, Calvert noted that he believes Pooph will ultimately be successful. He added that it is difficult to forecast future Pooph results given the lack of visibility into the business and the short time (three years) its products have been on the market.

The Catalyst: More Energy for AI, Data Centers, and Grid Resilience

The global need for grid-scale energy storage is rapidly growing to support increasing demands. In 2024, the U.S. Energy Information Administration (EIA) noted a 66% rise in battery energy storage capacity in the U.S. While lithium-ion batteries currently lead this sector, they present several challenges, such as fire risks due to thermal runaway, efficiency loss over time, and sourcing difficulties related to rare and critical minerals.

BioLargo said its Cellinity battery technology tackles these issues by using innovative materials and designs to deliver exceptional thermal performance and operational efficiency without relying on rare earth elements.

According to a February report by the International Energy Agency (IEA), global electricity consumption is expected to grow at its fastest rate in recent years, increasing by nearly 4% annually through 2027 as power use rises across various sectors.

“The growth in global demand will be the equivalent of adding an amount greater than Japan’s annual electricity consumption every year between now and 2027,” the agency noted. This surge is largely driven by the robust use of electricity for industrial production, increased demand for air conditioning, accelerating electrification led by the transport sector, and the rapid expansion of data centers.

Streetwise Ownership Overview*

BioLargo Inc. (BLGO:OTCQX)

Retail: 85.36%
Insiders & Management: 14.6%
Institutions: 0.04%
85.4%
14.6%
*Share Structure as of 6/19/2025


In the United States, the total capacity for large-scale battery storage exceeded 26 gigawatts (GW) in 2024, as detailed in the EIA’s January 2025 Preliminary Monthly Electric Generator Inventory. That year, generators added 10.4 GW of battery storage capacity, marking the second-largest increase in generating capability after solar energy. Despite the rapid growth of battery storage, it accounted for just 2% of the total 1,230 GW of utility-scale electricity generation capacity in the country in 2024.

Looking forward to 2025, battery storage growth could potentially reach new heights, with operators planning to add 19.6 GW of large-scale battery storage to the electrical grid, as indicated in the January 2025 preliminary electric generator inventory data, the agency reported.

Ownership and Share Structure

About 14.6% of BioLargo is owned by insiders and management, according to Yahoo! Finance. They include Chief Science Officer Kenneth Code with 8.3%, CEO Calvert with 3.29%, and Director Jack Strommen with 1.6%, Refinitiv reported.

About 0.04% is held by the institution First American Trust, Refinitiv said.

The rest, about 85%, is retail.

Its market cap is US$56.12 million, with about 304.85 million shares outstanding and about 262.22 million free-floating. It trades in a 52-week range of US$0.32 and US$0.16.


Important Disclosures:

  1. BioLargo Inc. is a billboard sponsor of Streetwise Reports and pays SWR a monthly sponsorship fee between US$4,000 and US$5,000.
  2. As of the date of this article, officers and/or employees of Streetwise Reports LLC (including members of their household) own securities of BioLargo Inc.
  3. Steve Sobek wrote this article for Streetwise Reports LLC and provides services to Streetwise Reports as an employee.
  4. This article does not constitute investment advice and is not a solicitation for any investment. Streetwise Reports does not render general or specific investment advice and the information on Streetwise Reports should not be considered a recommendation to buy or sell any security. Each reader is encouraged to consult with his or her personal financial adviser and perform their own comprehensive investment research. By opening this page, each reader accepts and agrees to Streetwise Reports’ terms of use and full legal disclaimer. Streetwise Reports does not endorse or recommend the business, products, services or securities of any company.
  5. This article does not constitute medical advice. Officers, employees and contributors to Streetwise Reports are not licensed medical professionals. Readers should always contact their healthcare professionals for medical advice.

For additional disclosures, please click here.

Data centers consume massive amounts of water – companies rarely tell the public exactly how much

By Peyton McCauley, University of Wisconsin-Milwaukee and Melissa Scanlan, University of Wisconsin-Milwaukee As demand for artificial intelligence technology boosts construction and proposed construction of data centers around the world, those computers require not just electricity and land, but also a significant amount of water. Data centers use water directly, with cooling water pumped through pipes in and around the computer equipment. They also use water indirectly, through the water required to produce the electricity to power the facility. The amount of water used to produce electricity increases dramatically when the source is fossil fuels compared with solar or wind.

A 2024 report from the Lawrence Berkeley National Laboratory estimated that in 2023, U.S. data centers consumed 17 billion gallons (64 billion liters) of water, and projects that by 2028, those figures could double – or even quadruple. The same report estimated that in 2023, U.S. data centers consumed an additional 211 billion gallons (800 billion liters) of water indirectly through the electricity that powers them. But that is just an estimate in a fast-changing industry.

We are researchers in water law and policy based on the shores of Lake Michigan. Technology companies are eyeing the Great Lakes region to host data centers, including one proposed for Port Washington, Wisconsin, which could be one of the largest in the country. The Great Lakes region offers a relatively cool climate and an abundance of water, making the region an attractive location for hot and thirsty data centers.

The Great Lakes are an important, binational resource that more than 40 million people depend on for their drinking water and supports a US$6 trillion regional economy. Data centers compete with these existing uses and may deplete local groundwater aquifers.

Our analysis of public records, government documents and sustainability reports compiled by top data center companies has found that technology companies don’t always reveal how much water their data centers use. In a forthcoming Rutgers Computer and Technology Law Journal article, we walk through our methods and findings using these resources to uncover the water demands of data centers.

In general, corporate sustainability reports offered the most access and detail – including that in 2024, one data center in Iowa consumed 1 billion (3.8 billion liters) gallons of water – enough to supply all of Iowa’s residential water for five days.

The computer processors in data centers generate lots of heat while doing their work.

How do data centers use water?

The servers and routers in data centers work hard and generate a lot of heat. To cool them down, data centers use large amounts of water – in some cases over 25% of local community water supplies. In 2023, Google reported consuming over 6 billion gallons of water (nearly 23 billion liters) to cool all its data centers.

In some data centers, the water is used up in the cooling process. In an evaporative cooling system, pumps push cold water through pipes in the data center. The cold water absorbs the heat produced by the data center servers, turning into steam that is vented out of the facility. This system requires a constant supply of cold water.

In closed-loop cooling systems, the cooling process is similar, but rather than venting steam to the air, air-cooled chillers cool down the hot water. The cooled water is then recirculated to cool the facility again. This does not require constant addition of large volumes of water, but it uses a lot more energy to run the chillers. The actual numbers showing those differences, which likely vary by the facility, are not publicly available.

One key way to evaluate water use is the amount of water that is considered “consumed,” meaning it is withdrawn from the local water supply and used up – for instance, evaporated as steam – and not returned to the ecosystem.

For information, we first looked to government data, such as that kept by municipal water systems, but the process of getting all the necessary data can be onerous and time-consuming, with some denying data access due to confidentiality concerns. So we turned to other sources to uncover data center water use.

Sustainability reports provide insight

Many companies, especially those that prioritize sustainability, release publicly available reports about their environmental and sustainability practices, including water use. We focused on six top tech companies with data centers: Amazon, Google, Microsoft, Meta, Digital Realty and Equinix. Our findings revealed significant variability in both how much water the companies’ data centers used, and how much specific information the companies’ reports actually provided.

Sustainability reports offer a valuable glimpse into data center water use. But because the reports are voluntary, different companies report different statistics in ways that make them hard to combine or compare. Importantly, these disclosures do not consistently include the indirect water consumption from their electricity use, which the Lawrence Berkeley Lab estimated was 12 times greater than the direct use for cooling in 2023. Our estimates highlighting specific water consumption reports are all related to cooling.

Amazon releases annual sustainability reports, but those documents do not disclose how much water the company uses. Microsoft provides data on its water demands for its overall operations, but does not break down water use for its data centers. Meta does that breakdown, but only in a companywide aggregate figure. Google provides individual figures for each data center.

In general, the five companies we analyzed that do disclose water usage show a general trend of increasing direct water use each year. Researchers attribute this trend to data centers.

A closer look at Google and Meta

To take a deeper look, we focused on Google and Meta, as they provide some of the most detailed reports of data center water use.

Data centers make up significant proportions of both companies’ water use. In 2023, Meta consumed 813 million gallons of water globally (3.1 billion liters) – 95% of which, 776 million gallons (2.9 billion liters), was used by data centers.

For Google, the picture is similar, but with higher numbers. In 2023, Google operations worldwide consumed 6.4 billion gallons of water (24.2 billion liters), with 95%, 6.1 billion gallons (23.1 billion liters), used by data centers.

Google reports that in 2024, the company’s data center in Council Bluffs, Iowa, consumed 1 billion gallons of water (3.8 billion liters), the most of any of its data centers.

The Google data center using the least that year was in Pflugerville, Texas, which consumed 10,000 gallons (38,000 liters) – about as much as one Texas home would use in two months. That data center is air-cooled, not water-cooled, and consumes significantly less water than the 1.5 million gallons (5.7 million liters) at an air-cooled Google data center in Storey County, Nevada. Because Google’s disclosures do not pair water consumption data with the size of centers, technology used or indirect water consumption from power, these are simply partial views, with the big picture obscured.

Given society’s growing interest in AI, the data center industry will likely continue its rapid expansion. But without a consistent and transparent way to track water consumption over time, the public and government officials will be making decisions about locations, regulations and sustainability without complete information on how these massive companies’ hot and thirsty buildings will affect their communities and their environments.The Conversation

About the Authors:

Peyton McCauley, Water Policy Specialist, Sea Grant UW Water Science-Policy Fellow, University of Wisconsin-Milwaukee and Melissa Scanlan, Professor and Director of the Center for Water Policy, School of Freshwater Sciences, University of Wisconsin-Milwaukee

This article is republished from The Conversation under a Creative Commons license. Read the original article.

Speculator Extremes: Nasdaq-Mini & MSCI EAFE lead weekly Bullish Positions

By InvestMacro

The latest update for the weekly Commitment of Traders (COT) report was released by the Commodity Futures Trading Commission (CFTC) on Friday for data ending on August 12th.

This weekly Extreme Positions report highlights the Most Bullish and Most Bearish Positions for the speculator category. Extreme positioning in these markets can foreshadow strong moves in the underlying market.

To signify an extreme position, we use the Strength Index (also known as the COT Index) of each instrument, a common method of measuring COT data. The Strength Index is simply a comparison of current trader positions against the range of positions over the previous 3 years. We use over 80 percent as extremely bullish and under 20 percent as extremely bearish. (Compare Strength Index scores across all markets in the data table or cot leaders table)


Extreme Bullish Speculator Table


Here Are This Week’s Most Bullish Speculator Positions:

Nasdaq

Extreme Bullish Leader
The Nasdaq speculator position comes in as the most bullish extreme standing this week with the Nasdaq-Mini speculator level currently at a maximum 100 percent score of its 3-year range.

The six-week trend for the percent strength score totaled an increase by 22 percentage points this week. The overall net speculator position was a total of 42,312 net contracts this week with a gain of 8,476 contract in the weekly speculator bets.


Speculators or Non-Commercials Notes:

Speculators, classified as non-commercial traders by the CFTC, are made up of large commodity funds, hedge funds and other significant for-profit participants. The Specs are generally regarded as trend-followers in their behavior towards price action – net speculator bets and prices tend to go in the same directions. These traders often look to buy when prices are rising and sell when prices are falling. To illustrate this point, many times speculator contracts can be found at their most extremes (bullish or bearish) when prices are also close to their highest or lowest levels.

These extreme levels can be dangerous for the large speculators as the trade is most crowded, there is less trading ammunition still sitting on the sidelines to push the trend further and prices have moved a significant distance. When the trend becomes exhausted, some speculators take profits while others look to also exit positions when prices fail to continue in the same direction. This process usually plays out over many months to years and can ultimately create a reverse effect where prices start to fall and speculators start a process of selling when prices are falling.


MSCI EAFE MINI

Extreme Bullish Leader
The MSCI EAFE MINI speculator position comes next in the extreme standings this week. The MSCI EAFE-Mini speculator level is now at a 99 percent score of its 3-year range.

The six-week trend change for the percent strength score was 0 percentage points this week. The speculator position registered 7,794 net contracts this week with a weekly increase by 1,940 contracts in speculator bets.


Ultra U.S. Treasury Bonds

Extreme Bullish Leader
The Ultra U.S. Treasury Bonds speculator position comes up number three in the extreme standings this week. The Ultra Long T-Bond speculator level is at a 93 percent score of its 3-year range.

The six-week trend for the speculator strength score totaled a change of 7 percentage points this week. The overall speculator position was -209,132 net contracts this week with a rise of 19,235 contracts in the speculator bets.


Lean Hogs

Extreme Bullish Leader
The Lean Hogs speculator position rounds out the top four in this week’s bullish extreme standings. The Lean Hogs speculator level sits at a 83 percent score of its 3-year range. The six-week trend for the speculator strength score was a drop by -16 percentage points this week.

The speculator position was 73,927 net contracts this week with a small boost by 789 contracts in the weekly speculator bets.


Live Cattle


The Live Cattle speculator position rounds out the top five in this week’s bullish extreme standings. The Live Cattle speculator level sits at a 83 percent score of its 3-year range. The six-week trend for the speculator strength score was a gain of 2 percentage points this week.

The speculator position was 106,141 net contracts this week with a dip of -234 contracts in the weekly speculator bets.


Extreme Bearish Speculator Table


This Week’s Most Bearish Speculator Positions:

5-Year Bond

Extreme Bearish Leader
The 5-Year Bond speculator position comes in tied as the most bearish extreme standing this week as the 5-Year speculator level sits at a 0 percent score of its 3-year range.

The six-week trend for the speculator strength score was a decline of -4 percentage points this week. The overall speculator position was -2,566,369 net contracts this week with a drop by -29,492 contracts in the speculator bets.


WTI Crude Oil

Extreme Bearish Leader
The WTI Crude Oil speculator position comes in tied for the most bearish extreme standing on the week. The WTI Crude speculator level is at a 0 percent score of its 3-year range.

The six-week trend for the speculator strength score was a decrease by -51 percentage points this week. The speculator position was 116,742 net contracts this week with a reduction by -25,087 contracts in the weekly speculator bets.


US Dollar Index

Extreme Bearish Leader
The US Dollar Index speculator position comes in as third most bearish extreme standing of the week with the USD Index speculator level resides at a 2 percent score of its 3-year range.

The six-week trend for the speculator strength score was -5 percentage points this week. The overall speculator position was -6,247 net contracts this week with a gain of 783 contracts in the speculator bets.


Sugar

Extreme Bearish Leader
The Sugar speculator position comes in as this week’s fourth most bearish extreme standing. The Sugar speculator level is at a 2 percent score of its 3-year range.

The six-week trend change for the speculator strength score was 0 percentage points this week. The speculator position was -68,512 net contracts this week with a boost by 8,460 contracts in the weekly speculator bets.


2-Year Bond

Extreme Bearish Leader
Next, the 2-Year Bond speculator position comes in as the fifth most bearish extreme standing for this week. The 2-Year speculator level is at a 9 percent score of its 3-year range.

The six-week trend for the speculator strength score was a dip by -8 percentage points this week. The speculator position was -1,379,597 net contracts this week with a drop by -54,074 contracts in the weekly speculator bets.


Article By InvestMacroReceive our weekly COT Newsletter

*COT Report: The COT data, released weekly to the public each Friday, is updated through the most recent Tuesday (data is 3 days old) and shows a quick view of how large speculators or non-commercials (for-profit traders) were positioned in the futures markets.

The CFTC categorizes trader positions according to commercial hedgers (traders who use futures contracts for hedging as part of the business), non-commercials (large traders who speculate to realize trading profits) and nonreportable traders (usually small traders/speculators) as well as their open interest (contracts open in the market at time of reporting). See CFTC criteria here.

For America’s 35M small businesses, tariff uncertainty hits especially hard

By Peter Boumgarden, Washington University in St. Louis and Dilawar Syed, The University of Texas at Austin 

Imagine it’s April 2025 and you’re the owner of a small but fast-growing e-commerce business. Historically, you’ve sourced products from China, but the president just announced tariffs of 145% on these goods. Do you set up operations in Thailand – requiring new investment and a lot of work – or wait until there’s more clarity on trade? What if waiting too long means you miss your chance to pull it off?

This isn’t a hypothetical – it’s a real dilemma faced by a real business owner who spoke with one of us over coffee this past spring. And she’s not alone. As of 2023, of those U.S. companies that import goods, more than 97% of them were small businesses. For these companies, tariff uncertainty isn’t just frustrating – it’s paralyzing.

As a family business researcher and former deputy administrator of the U.S. Small Business Administration and entrepreneur, we hear from a lot of small-business owners grappling with these challenges. And what they tell us is that tariff uncertainty is stressing their time, resources and attention.

The data backs up our anecdotal experience: More than 70% of small-business owners say constant shifts in trade policy create a “whiplash effect” that makes it difficult to plan, a recent national survey showed.

Unlike larger organizations with teams of analysts to inform their decision-making, small-business owners are often on their own. In an all-hands-on-deck operation, every hour spent focusing on trade policy news or filling out additional paperwork means precious time away from day-to-day, core operations. That means rapid trade policy shifts leave small businesses especially at a disadvantage.

Planning for stability in an uncertain landscape

Critics and supporters alike can agree: The Trump administration has taken an unpredictable approach to trade policy, promising and delaying new tariffs again and again. Consider its so-called “reciprocal” tariffs. Back in April, Trump pledged a baseline 10% tariff on imports from nearly everywhere, with extra hikes on many countries. Not long afterward, it hit pause on its plans for 90 days. That period just ended, and the administration followed up with a new executive order on July 31 naming different tariff rates for about 70 countries. The one constant has been change.

Bloomberg TV covers the administration’s “surprise announcements” on trade the day before a key self-imposed deadline.

This approach has upended long-standing trade relationships in a matter of days or weeks. And regardless of the outcomes, the uncertainty itself is especially disruptive to small businesses. One recent survey of 4,000 small-business owners found that the biggest challenge of tariff policies is the sheer uncertainty they cause.

This isn’t just a problem for small-business owners themselves. These companies employ nearly half of working Americans and play an essential role in the U.S. economy. That may partly explain why Americans overwhelmingly support small businesses, viewing them as positive for society and a key path for achieving the American dream. If you’re skeptical, just look at the growing number of MBA graduates who are turning down offers at big companies to buy and run small businesses.

But this consensus doesn’t always translate into policies that help small businesses thrive. In fact, because small businesses often operate on thinner margins and have less capacity to absorb disruptions, any policy shift is likely to be more difficult for them to weather than it would be for a larger firm with deeper pockets. The ongoing tariff saga is just the most recent example.

Slow, steady policies help small-business owners

Given these realities, we recommend the final negotiated changes to trade policy be rolled out slowly. Although that wouldn’t prevent businesses from facing supply chain disruptions, it would at least give them time to consider alternate suppliers or prepare in other ways. From the perspective of a small-business owner, having that space to plan can make a real difference.

Similarly, if policymakers want to bring more manufacturing back to the U.S., tariffs alone can accomplish only so much. Small manufacturers need to hire people, and with unemployment at just over 4%, there’s already a shortage of workers qualified for increasingly high-skilled manufacturing roles.

Making reshoring a true long-term policy objective would require creating pathways for legal immigration and investing significantly in job training. And if the path toward reshoring is more about automation than labor, then preparing small-business owners for the changes ahead and helping them fund growth strategically will be crucial.

Small businesses would benefit from more government-backed funding and training. The Small Business Administration is uniquely positioned to support small firms as they adjust their supply chains and manufacturing – it could offer affordable financing for imports and exports, restructure existing loans that small businesses have had to take on, and offer technical support and education on new regulations and paperwork. Unfortunately, the SBA has slashed 43% of its workforce and closed offices in major cities including Atlanta, Chicago, Denver, New Orleans and Los Angeles. We think this is a step in the wrong direction.

Universities also have an important role to play in supporting small businesses. Research shows that teaching core management skills can improve key business outcomes, such as profitability and growth. We recommend business and trade schools increase their focus on small firms and the unique challenges they face. Whether through executive programs for small-business owners or student consulting projects, universities have a significant opportunity to lean into supporting Main Street entrepreneurs.

Thirty-five million small businesses are the engine of the U.S. economy. They are the job creators in cities and towns across this country. They are the heartbeat of American communities. As the nation undergoes rapid and profound policy shifts, we encourage leaders in government and academia to take action to ensure that Main Streets across America not only endure but thrive.

The authors would like to thank Gretchen Abraham and Matt Sonneborn for their support.The Conversation

About the Author:

Peter Boumgarden, Professor of Family Enterprise, Washington University in St. Louis and Dilawar Syed, Associate Professor of Instruction, Department of Business, Government and Society, The University of Texas at Austin

This article is republished from The Conversation under a Creative Commons license. Read the original article.


Speculator Extremes: EAFE, Nasdaq & Palladium lead Top Bullish Positions

By InvestMacro

The latest update for the weekly Commitment of Traders (COT) report was released by the Commodity Futures Trading Commission (CFTC) on Friday for data ending on August 5th.

This weekly Extreme Positions report highlights the Most Bullish and Most Bearish Positions for the speculator category. Extreme positioning in these markets can foreshadow strong moves in the underlying market.

To signify an extreme position, we use the Strength Index (also known as the COT Index) of each instrument, a common method of measuring COT data. The Strength Index is simply a comparison of current trader positions against the range of positions over the previous 3 years. We use over 80 percent as extremely bullish and under 20 percent as extremely bearish. (Compare Strength Index scores across all markets in the data table or cot leaders table)


Extreme Bullish Speculator Table


Here Are This Week’s Most Bullish Speculator Positions:

MSCI EAFE MINI

Extreme Bullish Leader
The MSCI EAFE MINI speculator position comes in at the top of the most extreme standings this week as the MSCI EAFE-Mini speculator level is at a 96 percent score of its 3-year range.

The six-week trend for the percent strength score was a dip by -2 percentage points this week. The speculator position registered 5,854 net contracts this week with a weekly decline of -2,860 contracts in speculator bets.


Speculators or Non-Commercials Notes:

Speculators, classified as non-commercial traders by the CFTC, are made up of large commodity funds, hedge funds and other significant for-profit participants. The Specs are generally regarded as trend-followers in their behavior towards price action – net speculator bets and prices tend to go in the same directions. These traders often look to buy when prices are rising and sell when prices are falling. To illustrate this point, many times speculator contracts can be found at their most extremes (bullish or bearish) when prices are also close to their highest or lowest levels.

These extreme levels can be dangerous for the large speculators as the trade is most crowded, there is less trading ammunition still sitting on the sidelines to push the trend further and prices have moved a significant distance. When the trend becomes exhausted, some speculators take profits while others look to also exit positions when prices fail to continue in the same direction. This process usually plays out over many months to years and can ultimately create a reverse effect where prices start to fall and speculators start a process of selling when prices are falling.


Nasdaq

Extreme Bullish Leader
The Nasdaq speculator position comes in next this week in the extreme standings. The Nasdaq-Mini speculator level resides at a 92 percent score of its 3-year range.

The six-week trend for the speculator strength score came in at a gain of 27 percentage points this week. The overall speculator position was 33,836 net contracts this week with a small decrease of -1,118 contracts in the weekly speculator bets.


Palladium

Extreme Bullish Leader
The Palladium speculator position takes the next position in the extreme standings this week with the Palladium speculator level sitting at a 87 percent score of its 3-year range.

The six-week trend for the speculator strength score totaled a rise of 16 percentage points this week. The overall speculator position was -2,335 net contracts this week with a drop of -482 contracts in the speculator bets.


Ultra U.S. Treasury Bonds

Extreme Bullish Leader
The Ultra U.S. Treasury Bonds speculator position slides in next in this week’s bullish extreme standings as the Ultra Long T-Bond speculator level sits at a 86 percent score of its 3-year range. The six-week trend for the speculator strength score was a decline of -7 percentage points this week.

The speculator position was -228,367 net contracts this week with a reduction of -11,554 contracts in the weekly speculator bets.


Extreme Bearish Speculator Table


This Week’s Most Bearish Speculator Positions:

Sugar

Extreme Bearish Leader
The Sugar speculator position comes in tied as the most bearish extreme standing of the week with the Sugar speculator level residing at a 0 percent score of its 3-year range.

The six-week trend for the speculator strength score was -8 percentage points this week. The overall speculator position was -76,972 net contracts this week with a reduction by -14,824 contracts in the speculator bets.


5-Year Bond

Extreme Bearish Leader
The 5-Year Bond speculator position comes in also tied as the most bearish extreme standing this week. The 5-Year speculator level is at a 0 percent score of its 3-year range.

The six-week trend for the speculator strength score was -3 percentage points this week. The overall speculator position was -2,536,877 net contracts this week with a decline of -24,994 contracts in the speculator bets.


US Dollar Index

Extreme Bearish Leader
The US Dollar Index speculator position also comes in tied for the most bearish extreme standing on the week as the USD Index speculator level is at a 0 percent score of its 3-year range.

The six-week trend for the speculator strength score was a dip by -2 percentage points this week. The speculator position was -7,030 net contracts this week with a drop of -2,874 contracts in the weekly speculator bets.


WTI Crude Oil

Extreme Bearish Leader
Next, the WTI Crude Oil speculator position comes in as the fourth most bearish extreme standing for this week. The WTI Crude speculator level is currently at a 2 percent score of its 3-year range.

The six-week trend for the speculator strength score was a drop by -43 percentage points this week. The speculator position was 141,829 net contracts this week with a reduction of -14,194 contracts in the weekly speculator bets.


Soybean Meal

Extreme Bearish Leader
The Soybean Meal speculator position comes in as this week’s fifth most bearish extreme standing. The Soybean Meal speculator level is at a 2 percent score of its 3-year range.

The six-week trend for the speculator strength score was an edge lower by -2 percentage points this week. The speculator position was -81,610 net contracts this week with a small increase of 1,061 contracts in the weekly speculator bets.


Article By InvestMacroReceive our weekly COT Newsletter

*COT Report: The COT data, released weekly to the public each Friday, is updated through the most recent Tuesday (data is 3 days old) and shows a quick view of how large speculators or non-commercials (for-profit traders) were positioned in the futures markets.

The CFTC categorizes trader positions according to commercial hedgers (traders who use futures contracts for hedging as part of the business), non-commercials (large traders who speculate to realize trading profits) and nonreportable traders (usually small traders/speculators) as well as their open interest (contracts open in the market at time of reporting). See CFTC criteria here.

Mag 7 Earnings Preview: Wall Street Faces $11 Trillion Test

By ForexTime 

  • 4 of “Magnificent 7” set to publish earnings
  • Combined market cap of 4 tech titans over $11 trillion 
  • Beyond earnings, key focus on tariff impact & AI spending  
  • Meta could move almost 6% ↑ or ↓ post earnings
  • Apple shares ↓ over 15% year-to-date

Four of the “Magnificent 7” tech giants with a combined market capitalization of over $11 trillion are set to publish their results this week.

And this could be pivotal for markets given the ongoing uncertainty around Trump’s tariff drama. Investors will be eager to learn from these titans how global trade developments have affected their businesses.

Note: A volley of country-specific tariffs will take effect on August 1st, with the United States only securing six trade deals as of writing. There could be a potential extension of a tariff pause between the US and China.

Fresh updates from Mag 7 companies Microsoft, Meta, Amazon and Apple will be in focus. 

Here is what you need to know:


1) Microsoft

Microsoft reports on its fiscal Q4 2025 earnings on Wednesday 30th July after US markets close. 

Shares of the tech giant have gained over 20% year-to-date, with Wall Street analysts expecting Microsoft to post revenue and income growth amid growing AI demand. Quarterly revenues are projected to jump by 14% to $73.9 billion, while earnings per share are forecast to increase to $3.37 from $2.95 the same time a year ago.

Beyond revenue growth, updates on the Azure cloud service and AI initiatives will be in focus. 

Markets are forecasting a 3.9% move, either up or down, for Microsoft shares post earnings.

Imagen
Microsoft cfd


2) Meta

Meta is set to report second-quarter earnings after US markets close on Wednesday 30th July.

Shares of this tech titan are up almost 20% since the start of 2025, powered by the hunger for AI. Quarterly revenues are forecast to rise $44.8 billion – marking a 15% jump from a year earlier while EPS are seen jumping to $5.89 from $5.16. 

Markets are forecasting a 5.8% move, either up or down, for Meta shares post earnings.

Imagen
Meta cfd


3) Amazon

Amazon is scheduled to report second quarter earnings after US markets close on Thursday 31st July.

The tech giant is expected to report a nearly 10% jump in revenues to $162.1 billion while earnings per share are projected to increase to $1.32 from $1.26 the same time a year ago. Amazon Web Services has shown dominance in the cloud computing space, so the AWS and advertising business will be in focus.

Markets are forecasting a 5% move, either up or down, for Amazon stocks post earnings.

Imagen
amazon cfd


4) Apple

Apple reports its quarterly results after the closing bell on Thursday 31st July. 

It has been a rough year for Apple thus far with its share down over 15% year-to-date. 

The iPhone maker is expected to report 4% revenue growth amid improving services revenue and iPhone sales. Still, investors will be looking for updates on investment in Apple Intelligence and sales in China.

Markets are forecasting a 3.5% move, either up or down, for Apple shares post earnings.

Imagen
Apple cfd

Forex-Time-LogoArticle by ForexTime

ForexTime Ltd (FXTM) is an award winning international online forex broker regulated by CySEC 185/12 www.forextime.com

Week Ahead: Heavy hitter line up to rock US500?

By ForexTime 

  • US500 ↑ over 8% YTD, recently touching ATH 
  • Microsoft, Meta, Amazon and Apple = nearly 20% of US500 weight
  • US GDP, PCE & NFP could influence Fed cut bets
  • Trump’s tariff deadline = Liberation Day 2.0? 
  • Technical levels: 6400, 6350 and 6300

If you thought the last few days were eventful, just wait until you see the calendar for the week ahead…

Rate decisions by major central banks, top-tier economic reports, corporate earnings from tech titans, and Trump’s tariff deadline will be in focus:

Sunday, 27th July 

  • CN50: China industrial profits

Monday, 28th July 

  • US-China trade talks in Stockholm

Tuesday, 29th July

  • AUD: Austria UniCredit Bank Austria manufacturing PMI
  • EUR: Eurozone consumers’ inflation expectations
  • SPN35: Spain GDP, retail sales
  • UK100: Barclays earnings.
  • US500: Conference Board, consumer confidence, job openings

Wednesday, 30th July

  • AUD: Australia CPI
  • CAD: Canada rate decision
  • EU50: Eurozone GDP, consumer confidence
  • GER40: Germany GDP
  • US500: US Fed rate decision, GDP, ADP employment, US Treasury quarterly refunding, Microsoft, Meta earnings

Thursday, 31st July

  • AUD: Australia retail sales
  • CAD: Canada GDP
  • CN50: China manufacturing PMI, non-manufacturing PMI
  • GER40: Germany CPI, unemployment
  • JP225: Japan rate decision, industrial production, retail sales
  • ZAR: South Africa rate decision, trade
  • US500: US consumer income/spending, PCE price index, jobless claims, Apple, Amazon earnings

Friday, 1st August 

  • AU200: Austria CPI
  • CN50: China S&P Global manufacturing PMI
  • EU50: Eurozone CPI, Germany HCOB manufacturing PMI
  • JPY: Japan unemployment, S&P Global manufacturing PMI
  • GBP: UK trade, S&P Global manufacturing PMI
  • US500: US NFP, S&P Global manufacturing PMI, ISM manufacturing, University of Michigan consumer sentiment
  • Trump-imposed deadline for the US tariff pause ends

The spotlight shines on FXTM’s US500, which has gained over 8% year-to-date. 

Imagen
US5002

Note: FXTM’s US500 tracks the underlying S&P 500 index

US equities have been pushing higher with the US500 recently touching fresh all-time highs amid optimism about trade deals.


Here are 4 factors that could trigger significant moves:


1) Fed rate decision

The Federal Reserve is widely expected to leave interest rates unchanged in July, but any clues about future moves may shape the US500’s outlook. 

Note: The latest US CPI report increased to 2.7% in June. 

  • The US500 could rise if the Fed strikes a dovish tone and signals lower rates down the road.
  • Should Powell strike a hawkish note and suggest that rates may remain steady, it could drag the US500.

US500 is forecasted to move 1.5% up or down 1.4% in a 6-hour window after the Fed rate decision. 


2) US data dump: Q2 GDP, PCE, ISM & NFP

A string of high-impact US data releases may influence Fed cut bets for the second half of 2025, impacting the US500 as a result.

Wednesday 30th July – Q2 GDP, ADP employment

  • Note: US500 is forecasted to move 0.5% up or down 0.8% in a 6-hour window after the US GDP report.

Thursday 31st July – US PCE price index, jobless claims

  • Note: US500 is forecasted to move 1.3% up or down 1.0% in a 6-hour window after the US PCE report.

Friday 1st August– US June NFP, ISM manufacturing

  • Note: US500 is forecasted to move 0.7% up or down 1.6% in a 6-hour window after the US NFP report.

Traders are currently pricing in one Fed rate cut in 2025 with the odds of a second cut by December at 70%. 

Any significant shifts in these bets may impact the US500.

  • A set of figures that support the argument around lower rates may boost the US500.
  • Should data cool bets around lower rates, this may weigh on the US500. 


3) Big tech set for big moves?

Four of the “Magnificent” 7 tech titans with a combined market cap of over $11 trillion are set to publish their latest results.

Quarterly results from Microsoft, Meta, Amazon and Apple could offer key insight into how the tech industry fared last quarter.

It is worth noting that the combined weight of Meta, Microsoft, Amazon and Apple makes up just under 20% of the US500!

  • A solid set of results and optimistic forward guidance from tech titans may push the US500 higher.
  • Should results disappoint and concerns be expressed about the business outlook, the US500 could fall.


4) Trump’s tariff deadline

A barrage of country-specific tariffs will take effect on Friday, August 1st, unless targeted partners reach a deal with the United States.

So far, a deal has been struck with the UK, Vietnam, Japan, Philippines, and Indonesia, while there is optimism around a US-EU trade deal. Talks are still ongoing with China, with the third round of negotiations kicking off on Monday 28th.

The US government has only secured 5 trade deals, well below what was pledged on “Liberation Day” back in April. So, the question is whether markets could be headed for “Liberation Day 2.0” as time runs out.

  • If risk aversion returns with a vengeance, this may drag the US500 lower. 


5) Technical forces

The US500 remains firmly bullish with prices closing above the 6350 psychological level. However, the Relative Strength Index (RSI) is signaling that prices are heavily overbought.

  • Should 6350 prove reliable support, this may push prices toward 6400 and 6450.
  • Weakness below 6350 may drag prices back toward 6300 and 6220. 
Imagen
US5007

Forex-Time-LogoArticle by ForexTime

ForexTime Ltd (FXTM) is an award winning international online forex broker regulated by CySEC 185/12 www.forextime.com

Taiwan Looks to Drones to Fight China

Source: Streetwise Reports (7/22/25)

Like with this island in East Asia, militaries around the world are increasingly using drones, a staple in their arsenal, in conflict or training. This trend could benefit companies in the sector, including New Horizon Aircraft Ltd. (HOVR:NASDAQ), AIRO Group Holdings Inc. (AIRO:NASDAQ), AML3D Ltd. (AL3:ASX), and Firestorm Labs Inc.

The constant threat that China will invade Taiwan at any moment has the island continuing to prepare for war against the powerful country.

“Beijing’s Chinese Communist Party government claims Taiwan as its territory, though it has never ruled the island, and China’s rapid military buildup and coercive actions in the Taiwan Strait have led its neighbor to boost defense spending and order a series of high-profile weapons systems from the U.S.,” wrote Newsweek on July 15.

Last month Taiwan tested a first person-view kamikaze sea drone called Overkill, according to Firstpost. The government aims to build up to 25,000 of these units, equipped with artificial intelligence-enabled targeting and a precision camera.

Also, Taiwan just completed the largest version ever of its annual Han Kuan military exercise, reported Business Insider on July 14. The dual focus was on countering a Chinese invasion and, for the possibility such an event is successful, carrying out contingency plans.

“This comes as Taipei’s current government, known for resisting Beijing, grows increasingly concerned about emerging hostilities with mainland China,” the article explained. “Chinese leader Xi Jinping has pledged to reunify the island under Beijing’s control, and said his country would never renounce its right to use force to reach that goal.”

Other countries in the Asia-Pacific are preparing for an eventual China-Taiwan conflict, too. The Philippines, for example, is advancing a US$35 billion military modernization program, noted Newsweek. One of its several goals is to integrate into ground operations command and control systems, drones, and intelligence, surveillance, reconnaissance (ISR) tools, noted Inquirer.net.

As with the China-Taiwan tensions and other recent geopolitical conflicts around the globe, drones are increasingly taking center stage. For example, in the ongoing Myanmar conflict, both sides are now using drones, and so much so, the country ranks third, after Ukraine and Russia, for the number of drone events, according to Armed Conflict Location & Event Data in a July 1 article.

“This isn’t a tactical shift — but rather the start of a military revolution, tearing apart the old rules of war,” wrote Antonio Salinas and Jason P. LeVay, U.S. military analysts, in a May article. “What was once ‘no man’s land’ between trenches is now a drone kill zone, patrolled by flying munitions that loiter, observe, and strike with terrifying accuracy.”

All armed forces must adapt to this new reality, the authors asserted, or suffer total defeat in war.

Companies that could stand to benefit from drones dominating the battlefield, as well as increasing conflicts around the globe, include:

New Horizon Aircraft

Based in Ontario, Canada, New Horizon Aircraft Ltd. (HOVR:NASDAQ) is an advanced aerospace engineering company doing business as Horizon Aircraft and developing hybrid electric vertical takeoff and landing, or eVTOL, aircraft, according to its website.

Its prototype, the Cavorite X7, can take off vertically, but once in flight, its wing system reverts to that of a conventional airplane, providing the same speed, range, and operational utility. This hybrid eVTOL prototype is designed to fly in bad weather, including icy conditions, and it emits 30% less hydrocarbons than a traditional plane. Currently, the prototype is in a flight-testing phase. After completing this, Horizon intends to obtain certification of the Cavorite X7 and then scale production to meet demand from customers, including the military.

Recently, Horizon and ZeroAvia, a global hydrogen-electric powertrain company, announced their plan to collaboratively develop regional hydrogen-electric VTOL air travel, noted a news release.

Richard Ryan, analyst at Oak Ridge Financial Research, noted in his June 16 research report that in mid-May, Horizon achieved a full wing transition flight of Cavorite X7. A U.S. Executive Order signed subsequently intends to accelerate the safe commercialization of drone and other emerging technologies, such as eVTOL aircraft.

In light of these internal and external developments, Oak Ridge increased its target price on New Horizon by 45%. The new target implies a 44% return from HOVR’s share price at the close on July 18. Oak Ridge rates the company Buy.

D. Boral Capital Analyst Jesse Sobelson has a Buy rating on New Horizon and a target price suggesting 16.3% uplift, as noted in his June 9 research report. The consensus target price, according to Refinitiv, reflects 11.6% upside.

Refinitiv also reports that 14 strategic entities own 46.59% of New Horizon. The Top 3 are Canso Group with 16.23%, Robinson Family Ventures Inc. with 7.63% and William Brumder with 7.29%. Six institutional investors hold 0.34%. The rest is in retail.

New Horizon has 31.39 million (31.39M) outstanding shares and 16.76M free float traded shares. Its market cap is US$53.98 million (US$53.98M). Its 52-week range is US$0.24–2.52 per share.

AIRO Group 

AIRO Group Holdings Inc. (AIRO:NASDAQ) is an aerospace and defense company headquartered in Albuquerque, N.M., whose four divisions are drones, avionics, electric air mobility and training, notes the website. The drones segment develops, manufactures and sells drones. Military drones are sold through the Sky-Watch brand.

In recent news, AIRO concluded a highly specialized 90-day training support mission for Naval Special Warfare, “building on strong revenue growth in 2024 and H1/25 in its military training division,” as announced in a news release. The company provides elite training solutions to the U.S. Navy and U.S. Marine Corps’ Joint Terminal Attack Controller program.

According to Refinitiv, the consensus target price on AIRO suggests 8% return from the company’s share price at the end of trading on July 18. TipRanks reports that three analysts cover AIRO, and all of them rate it Buy.

As for ownership, Refinitiv reports that nine strategic investors own 64.71% of AIRO. The Top 3 are AIRO Executive Chairman Dr. Chirinjeev Kathuria with 19.46%, New Generation Aerospace LLC with 15.37% and Carter Aviation Technologies LLC with 11.1%. The rest is in retail.

AIRO has 26.17M outstanding shares and 9.24M free float traded shares. Its market cap is US$688.13M. its 52-week range is US$12.90–38.07 per share.

AML3D Ltd. 

AML3D Ltd. (AL3:ASX; AMLDF:OTCPK), based in Australia, specializes in large-scale metal three-dimensional (3D) printing using its patented wire additive manufacturing process that combines welding science, robotics automation, materials engineering, and proprietary software, the company’s website explains. The company manufactures and sells industrial metal 3D printers under the ARCEMY brand as well as large, high-performance metal components and structures, to defense, aerospace, maritime, manufacturing, mining, and oil and gas customers.

Earlier this month, AML3D received a letter of intent (LOI) from the U.S. Navy to collaborate on several key additive manufacturing initiatives. “The LOI focuses on AML3D’s ability to support materials characterization, parts manufacturing and supply of large scale ARCEMY metal 3D printing systems,” the news release noted.

Daniel Laing, Bell Potter analyst, and Abraham Akra, Shaw and Partners analyst, both cover AML3D. In a July 20 flash note, Bell Potter analyst Daniel Laing gave the company a Buy rating an US$0.35 valuation.

According to Refinitiv, 17 strategic entities own 16.58% of AML3D. The insider with the largest share is Andrew Sales, AML3D’s executive director and chief technology officer, with 4.84%.

Two institutions hold 10.76%. They are Netwealth Investments Ltd. with 5.78% and Regal Funds Management Pty. Ltd. with 4.97%. The rest is in retail.

AML3D has 542.14M outstanding shares and 451.77M free float traded shares. Its market cap is AU$112.54M. Its 52-week range is AU$0.105–0.325 per share.

Firestorm Labs Inc.

Firestorm Labs, a private company headquartered in San Diego, Calif., develops modular, open-architecture drones for rapid deployment in combat and expeditionary environments, according to its website. Its products integrate ISR, electronic warfare/signals intelligence and kinetic payload capabilities. Firestorm’s drones are mission adaptable and can be built any time, anywhere.

“Our unique ability to 3D print modular airframes on site dramatically reduces production timelines, costs and logistical constraints, giving the U.S. and allied forces the adaptive technology they urgently need in complex and contested operational environments,” Dan Magy, Firestorm chief executive officer, said in a July 16 news release.

This release announced that Firestorm secured US$47M in Series A funding. Lockheed Martin Ventures, Decisive Point, Washington Harbour Partners, Booz Allen Ventures, and other defense-focused investors participated in the round led by New Enterprise Associates.

Firestorm will use the capital to advance its additive-manufacturing platform, accelerate in-theater drone production, and scale xCell. xCell produces UAS systems and any 3d printed assets as required, but it’s primary purpose is not to house the above. It serves as a modular micro factory.


Important Disclosures:

  1. As of the date of this article, officers and/or employees of Streetwise Reports LLC (including members of their household) own securities of Firestorm.
  2. Doresa Banning wrote this article for Streetwise Reports LLC and provides services to Streetwise Reports as an independent contractor.
  3.  This article does not constitute investment advice and is not a solicitation for any investment. Streetwise Reports does not render general or specific investment advice and the information on Streetwise Reports should not be considered a recommendation to buy or sell any security. Each reader is encouraged to consult with his or her personal financial adviser and perform their own comprehensive investment research. By opening this page, each reader accepts and agrees to Streetwise Reports’ terms of use and full legal disclaimer. Streetwise Reports does not endorse or recommend the business, products, services or securities of any company.

For additional disclosures, please click here.

FXTM’s JP225 soars on US-Japan trade deal

By ForexTime 

  • FXTM’s JP225 ↑ over 4% on trade deal, hits 12 month high
  • US to impose 15% tariffs on Japanese imports, lower than threatened 25%
  • Yen gains capped by political risk, despite trade ‘massive’ deal.
  • Japan PM Ishiba denies reports of stepping down
  • New FXTM JPC crosses tumble as JP225 surges

Japanese shares surged on Wednesday after President Donald Trump announced a ‘massive’ trade deal with Japan after eight rounds of negotiations!

FXTM’s JP225 which tracks the underlying Nikkei 225 index jumped more than 4% – hitting its highest level since July 2024. 

Imagen
jp225 - 33

More gains could be on the cards given how this removes uncertainty around trade and boosts sentiment toward the Japanese economy.


What are the details on the ‘massive’ deal?

  • US to impose 15% tariffs on all Japanese imports, including automobiles – lower than threatened 25% rate set to take effect August 1st.
  • Japan to also create US$550 billion fund for US-bound investments.
  • Japan to buy 100 Boeing aircrafts, increase rice purchases by 75%, buy US$8 billion of agricultural products.
  • Japan to spend US$17 billion per year on American defense firms – up from $ 8 billion annually.
  • Japan to be guaranteed lowest US tariffs on semiconductors and pharmaceuticals.


How did the Japanese Yen react?

The USDJPY dipped to its lowest level since July 11th on the positive trade news, as it raised the odds of a potential BoJ hike in 2025. 

Imagen
USDJPY 56

However, gains were surrendered following reports that Japanese Prime Minister Shigeru Ishiba intended to step down next month. Ishiba later denied these reports, which offered some support to the Yen.

Traders are currently pricing an 80% probability of a BoJ rate hike by the end of 2025. 

Watch out for political risk…

Last Sunday, Japan’s ruling coalition failed to gain a majority in the upper house elections as widely expected. It is worth noting that nine months ago, the coalition lost a majority in the more powerful lower chamber of parliament.

This will be the first time that the governing LDP has lost a majority in both chambers since its inception in 1955. 

Such a development may pressure Prime Minister Shigeru Ishiba to step down, resulting in fresh political uncertainty.


By the way… FXTM has launched 4 new JPC crosses!

And they are buzzing with activity following Trump’s ‘massive’ trade deal. 

The rally on the JP225 (Nikkei 225) has dragged these JPC crosses lower today: 

  • CHCJPC (CN50 vs JP225): ↓3.8%
  • DJCJPC (US30 vs JP225): ↓4.2%
  • NACJPC (NAS100 vs JP225): ↓3.7%
  • SPCJPC (US500 vs JP225): ↓3.7%

JPC crosses could experience steeper declines if the JP225 continues to surge on trade optimism. 

However, political risk down the road may limit the downside and spark a potential rebound.


Forex-Time-LogoArticle by ForexTime

ForexTime Ltd (FXTM) is an award winning international online forex broker regulated by CySEC 185/12 www.forextime.com