Archive for Stock Market News – Page 14

Week Ahead: US500 set for major pullback?

By ForexTime 

  • US500 gains 15% in first half of 2024
  • April only negative trading month this year
  • US CPI, Powell Testimony & Big bank earnings in focus
  • Bullish but RSI overbought on multiple timeframes
  • Technical levels – 5600, 5500 & 5460

The UK general election is done and dusted with Labour securing a landslide victory as widely expected.

But the political risks don’t end there…

Just across the English Channel, France will hold the second and final round of its legislative elections this Sunday. And if the far-right National Rally wins an absolute majority, that shocker could see the FRA40 plunging to its year-to-date low.

Speaking of indices, FXTM’s US500 continues to dazzle markets with record highs!

And could see more volatility this afternoon thanks to the US jobs report (Friday 5th July). But even as anticipation mounts, investors are bracing for more action in the week ahead:

Sunday, 7th July

  • FRA40: Second round of French legislative elections

Monday, 8th July

  • JP225: Japan current account

Tuesday, 9th July

  • AU200: Australia consumer confidence
  • CNH: China aggregate financing, money supply, new yuan loans
  • TWN: Taiwan trade
  • US500: Fed Chair Jerome Powell testimony

Wednesday, 10th July

  • CN50: China PPI, CPI
  • JP225: Japan PPI
  • NZD: RBNZ rate decision
  • US500: Fed Chair Jerome Powell testimony, Fed speech

Thursday,11th July

  • GER40: Germany CPI
  • JP225: Japan core machine orders
  • NZD: New Zealand food prices
  • ZAR: South Africa manufacturing production
  • UK100: UK industrial production
  • US500: US June CPI report, Fed speech

Friday, 12th July

  • SG20: Singapore GDP
  • CN50: China trade
  • JP225: Japan industrial production
  • USDInd: US University of Michigan consumer sentiment, PPI
  • US500: JPMorgan, Citigroup, Wells Fargo earnings

All eyes will be on the incoming US inflation data, Powell’s testimony and earnings announcements by big US banks which could move the US500.

With the Relative Strength Index (RSI) signalling that prices are heavily overbought, could a technical pullback be on the horizon?

Note: A pullback is a temporary pause or decline in an asset’s overall bullish trend.


These 3 factors may influence the US500 outlook in the week ahead:

    1) US June CPI report

The incoming US Consumer Price Index (CPI) is likely to impact bets around when the Fed will start cutting interest rates in H2.

Markets are forecasting: 

  • CPI year-on-year (June 2024 vs. June 2023) to cool 3.1% from 3.3% in the prior month.
  • Core CPI year-on-year to remain unchanged at 3.4%.
  • CPI month-on-month (June 2024 vs May 2024) to rise 0.1% from 0% in the prior month.
  • Core CPI month-on-month to remain unchanged at 0.2%.

Expectations around lower US interest rates have been one of the driving forces behind the US500 rally in 2024. This is because the index has a handful of tech stocks that remain sensitive to US rates. Digging deeper, tech accounts for 33% of the US500 value!

  • The US500 could dip if the inflation numbers print above market forecasts.
  • Should the CPI report show more evidence of disinflation, the US500 may receive a boost.

Note: Before the key US inflation data on Thursday, the US500 may be influenced by Fed Chair Jerome Powell’s congressional testimony earlier in the week. Should he strike a dovish tone, US equity bulls are likely to receive a boost, and vice versa.


    2) Big bank earnings

It’s that time of the year again…

Second quarter earnings season kicks off on Friday 12th July, led by the biggest US banks.

Heavyweights such as JPMorgan, Wells Fargo and Citigroup and will be under the spotlight. Investors will closely comb over their earnings for fresh insight into the health of US banks which can be used to gauge the health of the US economy.

When factoring in how financial stocks make up over 12% of the US500, the incoming bank earnings could spark some volatility.

  • US500 may push higher if bank earnings beat estimates.
  • Should earnings disappoint, US500 bears could return to the scene.


    3) Technical forces

The US500 is firmly bullish on the weekly and daily timeframe. However, the Relative Strength Index (RSI) is above 70 – indicating that prices are heavily overbought.

Note: US500 tracks the underlying S&P 500 index

After recently hitting record highs, the index is trading around unchartered territories.

  • Should 5500 prove to be reliable support, bulls could challenge 5600.
  • A decline below 5500 may open a path toward 5460 and 5400.


Forex-Time-LogoArticle by ForexTime

ForexTime Ltd (FXTM) is an award winning international online forex broker regulated by CySEC 185/12 www.forextime.com

COT Stock Market Charts: Speculator bets led by S&P500 & Nasdaq

By InvestMacro

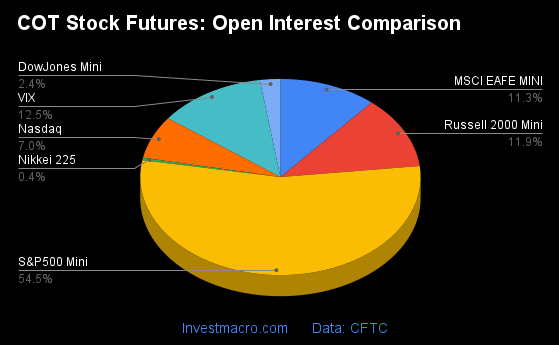
Here are the latest charts and statistics for the Commitment of Traders (COT) data published by the Commodities Futures Trading Commission (CFTC).

The latest COT data is updated through Tuesday June 25th and shows a quick view of how large traders (for-profit speculators and commercial entities) were positioned in the futures markets.

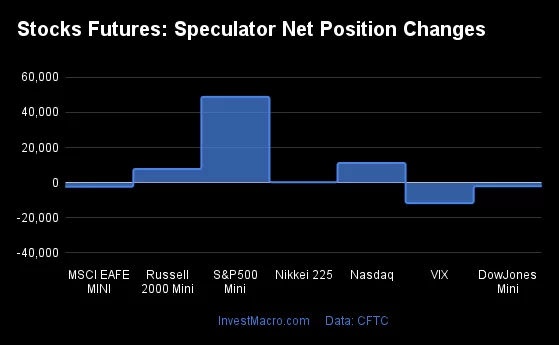
Weekly Speculator Changes led by S&P500-Mini & Nasdaq-Mini

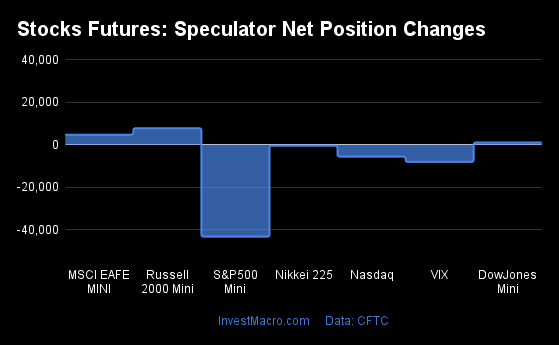
The COT stock markets speculator bets were slightly higher this week as four out of the seven stock markets we cover had higher positioning while the other three markets had lower speculator contracts.

Leading the gains for the stock markets was the S&P500-Mini (48,863 contracts) with the Nasdaq-Mini (11,220 contracts), the Russell-Mini (7,827 contracts) and the Nikkei 225 (288 contracts) also showing positive weeks.

The markets with the declines in speculator bets this week were the VIX (-11,606 contracts) with the MSCI EAFE-Mini (-2,331 contracts) and the DowJones-Mini (-2,038 contracts) also registering lower bets on the week.


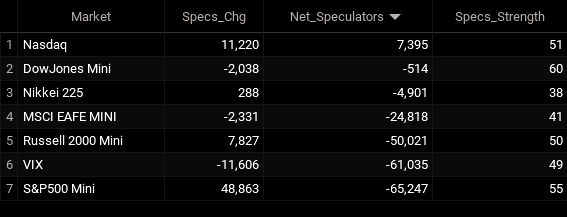
Stock Market Net Speculators Leaderboard
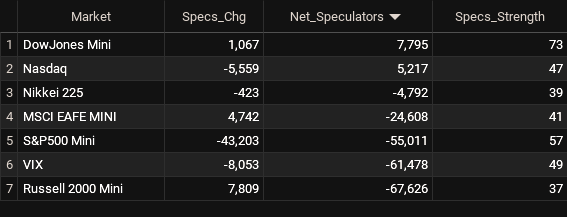
Legend: Weekly Speculators Change | Speculators Current Net Position | Speculators Strength Score compared to last 3-Years (0-100 range)


Strength Scores led by the DowJones-Mini

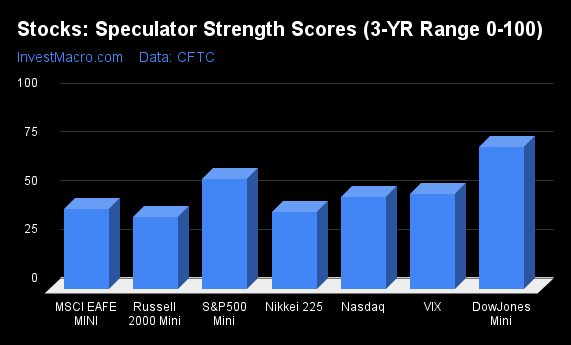
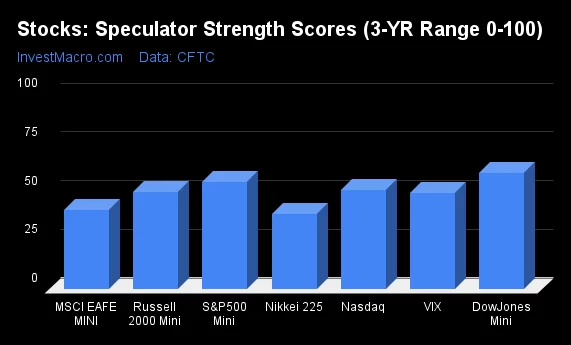
COT Strength Scores (a normalized measure of Speculator positions over a 3-Year range, from 0 to 100 where above 80 is Extreme-Bullish and below 20 is Extreme-Bearish) showed that the DowJones-Mini (59 percent) leads the stock markets this week. The S&P500-Mini (55 percent) and Nasdaq-Mini (51 percent) come in as the next highest in the weekly strength scores.

On the downside, the Nikkei 225 (38 percent) comes in at the lowest strength level currently with the next lowest strength score is the MSCI EAFE-Mini (41 percent).

Strength Statistics:
VIX (49.1 percent) vs VIX previous week (61.6 percent)
S&P500-Mini (55.0 percent) vs S&P500-Mini previous week (47.7 percent)
DowJones-Mini (59.5 percent) vs DowJones-Mini previous week (62.8 percent)
Nasdaq-Mini (50.6 percent) vs Nasdaq-Mini previous week (33.2 percent)
Russell2000-Mini (49.6 percent) vs Russell2000-Mini previous week (44.1 percent)
Nikkei USD (38.4 percent) vs Nikkei USD previous week (35.9 percent)
EAFE-Mini (40.7 percent) vs EAFE-Mini previous week (43.1 percent)


Nasdaq-Mini & MSCI EAFE-Mini top the 6-Week Strength Trends

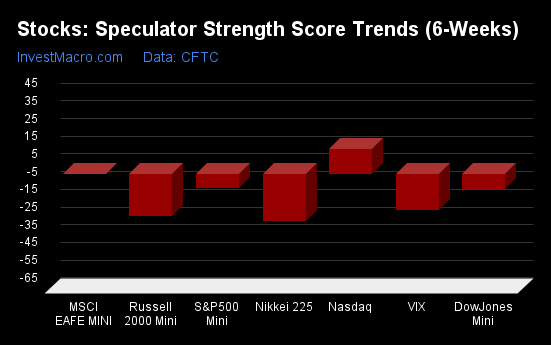
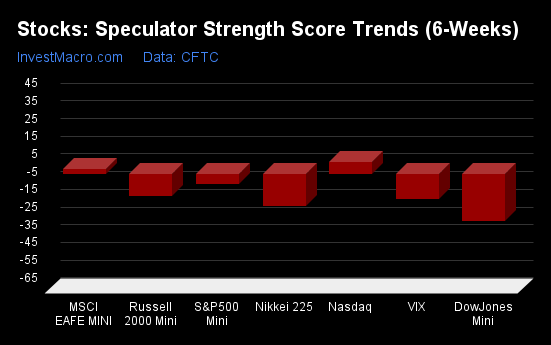
COT Strength Score Trends (or move index, calculates the 6-week changes in strength scores) showed that the Nasdaq-Mini (7 percent) leads the past six weeks trends for the stock markets. The MSCI EAFE-Mini (3 percent) was the next highest positive movers in the latest trends data.

The DowJones-Mini (-26 percent) leads the downside trend scores currently with the Nikkei USD (-18 percent) coming in as the next market with lower trend scores.

Strength Trend Statistics:
VIX (-14.0 percent) vs VIX previous week (-11.4 percent)
S&P500-Mini (-6.0 percent) vs S&P500-Mini previous week (-15.6 percent)
DowJones-Mini (-26.5 percent) vs DowJones-Mini previous week (-11.6 percent)
Nasdaq-Mini (6.5 percent) vs Nasdaq-Mini previous week (-12.8 percent)
Russell2000-Mini (-12.7 percent) vs Russell2000-Mini previous week (-14.1 percent)
Nikkei USD (-18.3 percent) vs Nikkei USD previous week (-15.2 percent)
EAFE-Mini (2.7 percent) vs EAFE-Mini previous week (-8.8 percent)


Individual Stock Market Charts:

VIX Volatility Futures:
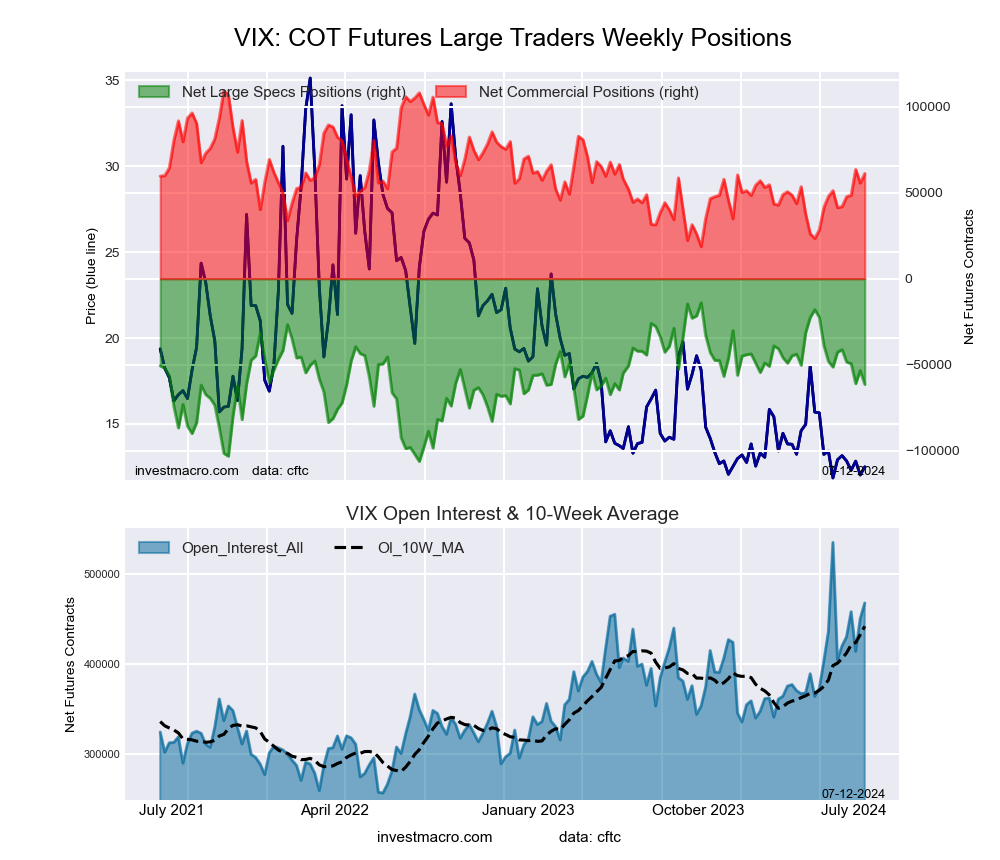
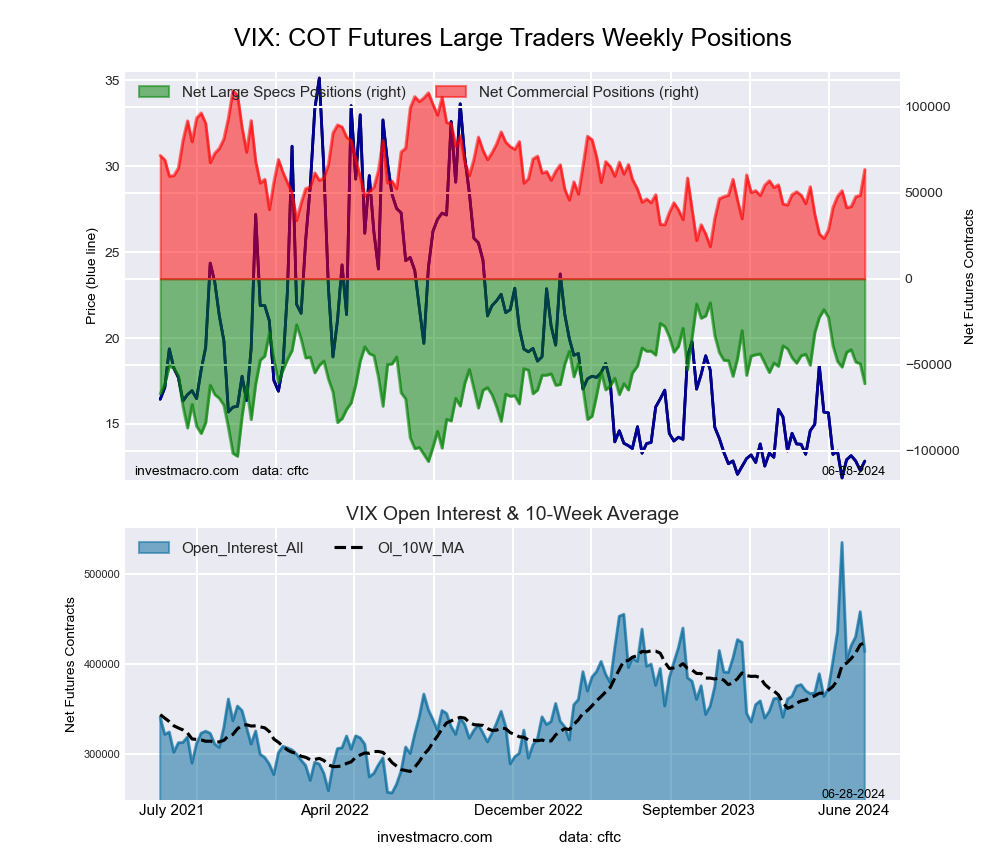
VIX Volatility Futures COT ChartThe VIX Volatility large speculator standing this week equaled a net position of -61,035 contracts in the data reported through Tuesday. This was a weekly lowering of -11,606 contracts from the previous week which had a total of -49,429 net contracts.

This week’s current strength score (the trader positioning range over the past three years, measured from 0 to 100) shows the speculators are currently Bearish with a score of 49.1 percent. The commercials are Bearish with a score of 49.4 percent and the small traders (not shown in chart) are Bullish-Extreme with a score of 80.7 percent.

Price Trend-Following Model: Strong Downtrend

Our weekly trend-following model classifies the current market price position as: Strong Downtrend. The current action for the model is considered to be: Hold – Maintain Short Position.

VIX Volatility Futures StatisticsSPECULATORSCOMMERCIALSSMALL TRADERS
– Percent of Open Interest Longs:18.645.76.5
– Percent of Open Interest Shorts:33.330.47.1
– Net Position:-61,03563,589-2,554
– Gross Longs:76,905189,46627,000
– Gross Shorts:137,940125,87729,554
– Long to Short Ratio:0.6 to 11.5 to 10.9 to 1
NET POSITION TREND:
– Strength Index Score (3 Year Range Pct):49.149.480.7
– Strength Index Reading (3 Year Range):BearishBearishBullish-Extreme
NET POSITION MOVEMENT INDEX:
– 6-Week Change in Strength Index:-14.017.3-13.4


S&P500 Mini Futures:

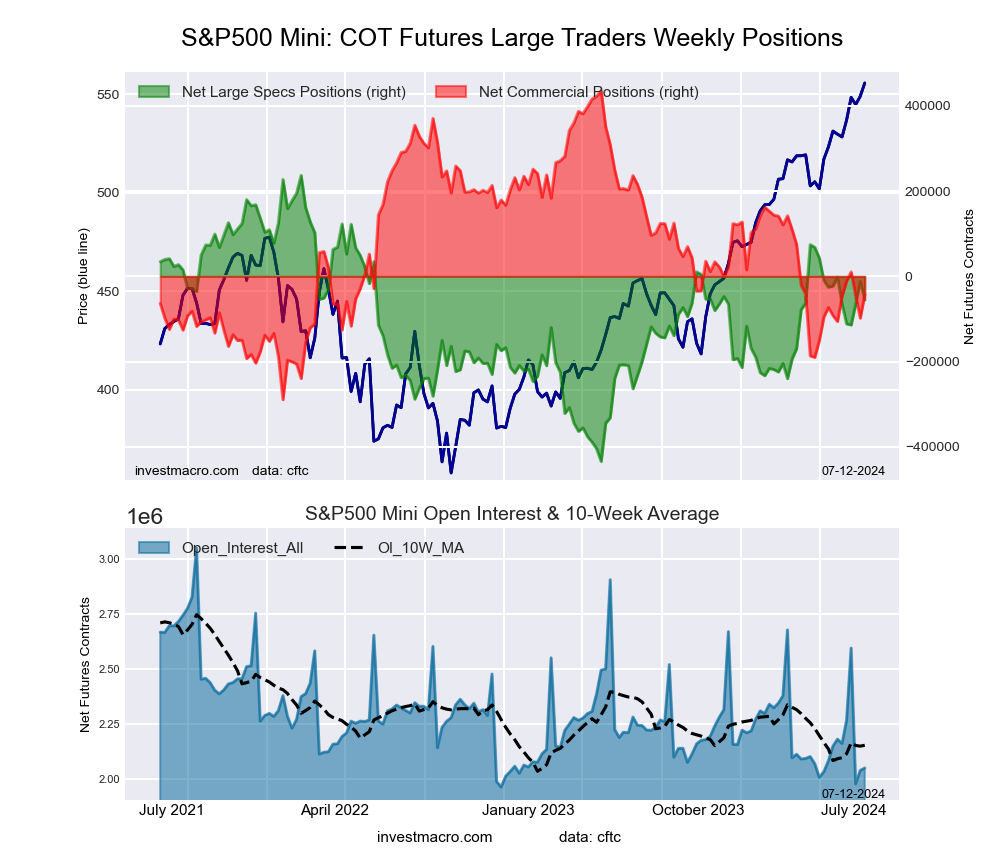
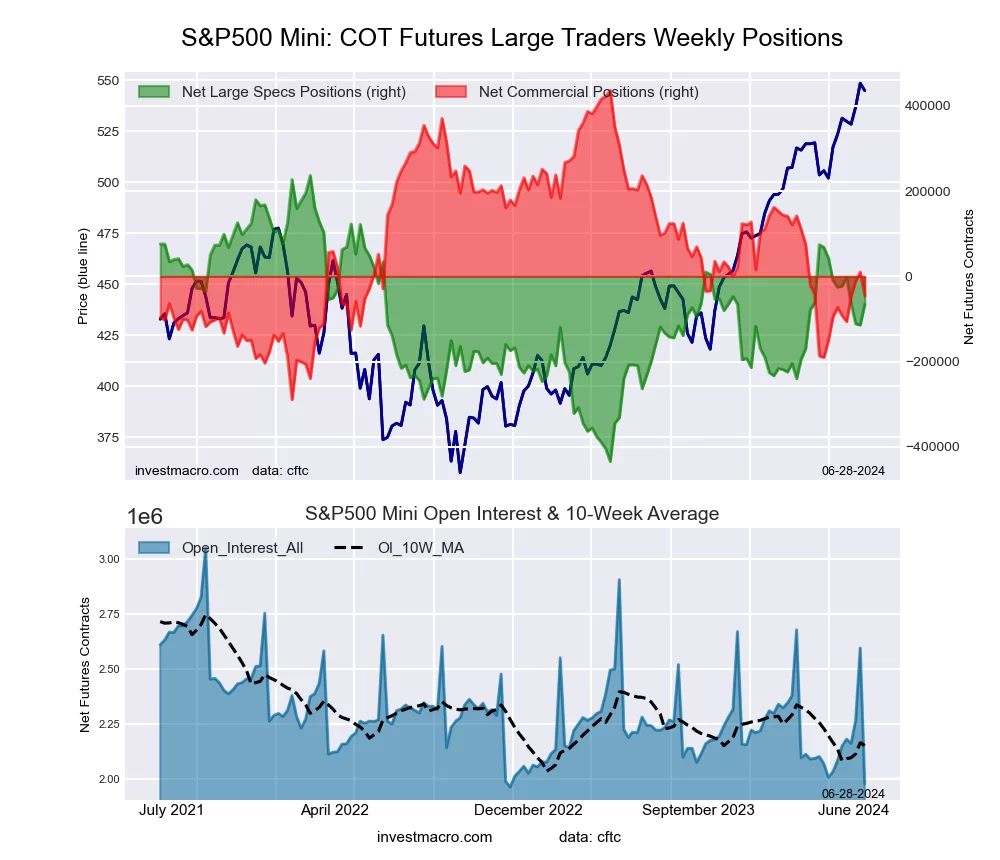
SP500 Mini Futures COT ChartThe S&P500 Mini large speculator standing this week equaled a net position of -65,247 contracts in the data reported through Tuesday. This was a weekly advance of 48,863 contracts from the previous week which had a total of -114,110 net contracts.

This week’s current strength score (the trader positioning range over the past three years, measured from 0 to 100) shows the speculators are currently Bullish with a score of 55.0 percent. The commercials are Bearish with a score of 33.5 percent and the small traders (not shown in chart) are Bullish-Extreme with a score of 83.1 percent.

Price Trend-Following Model: Strong Uptrend

Our weekly trend-following model classifies the current market price position as: Strong Uptrend. The current action for the model is considered to be: Hold – Maintain Long Position.

S&P500 Mini Futures StatisticsSPECULATORSCOMMERCIALSSMALL TRADERS
– Percent of Open Interest Longs:13.870.913.5
– Percent of Open Interest Shorts:17.173.27.9
– Net Position:-65,247-46,099111,346
– Gross Longs:271,9081,400,848266,961
– Gross Shorts:337,1551,446,947155,615
– Long to Short Ratio:0.8 to 11.0 to 11.7 to 1
NET POSITION TREND:
– Strength Index Score (3 Year Range Pct):55.033.583.1
– Strength Index Reading (3 Year Range):BullishBearishBullish-Extreme
NET POSITION MOVEMENT INDEX:
– 6-Week Change in Strength Index:-6.03.75.3


Dow Jones Mini Futures:

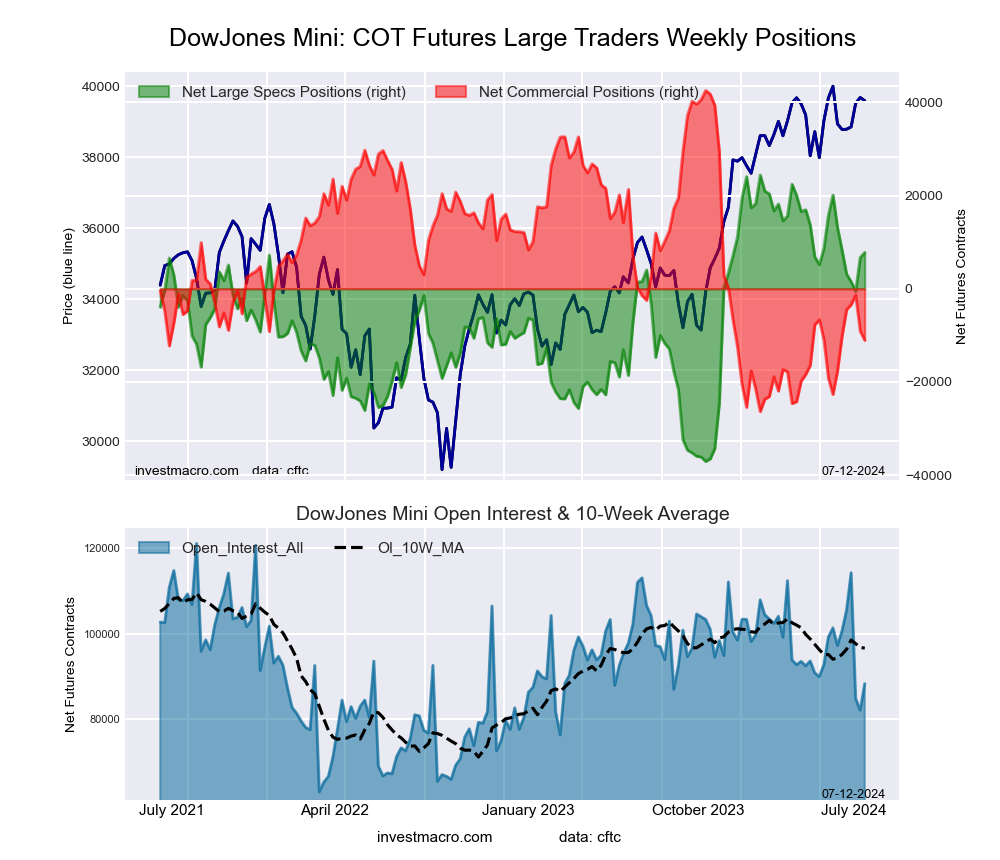
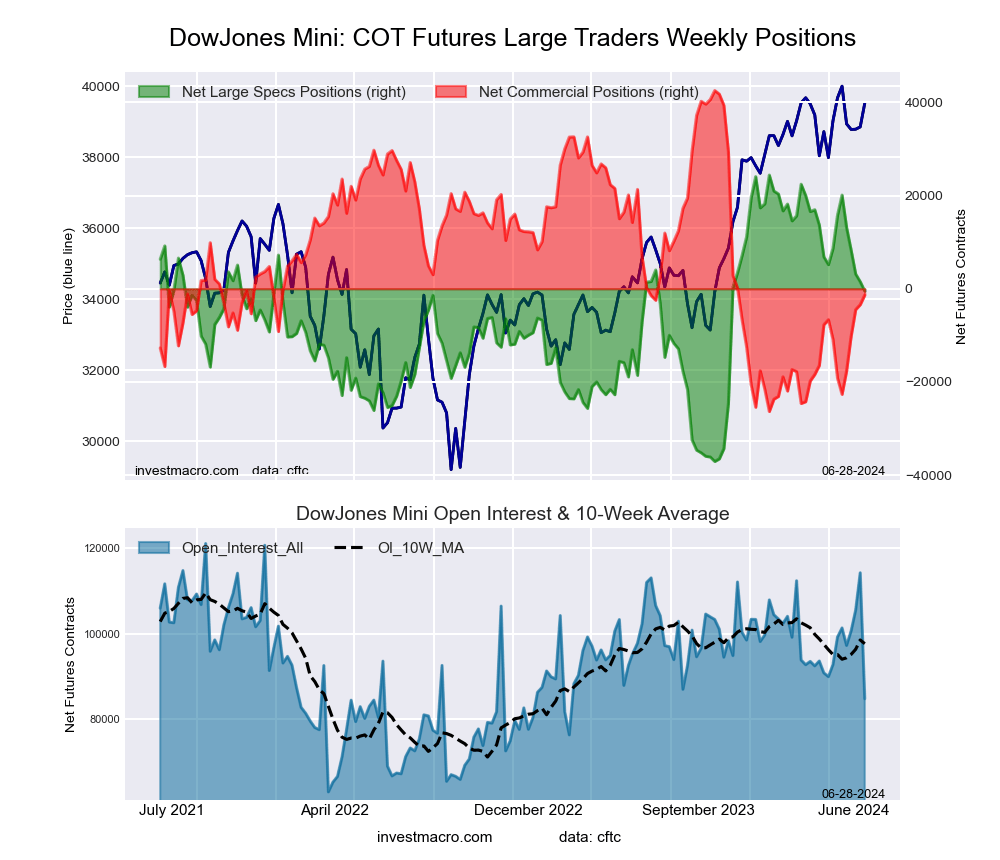
Dow Jones Mini Futures COT ChartThe Dow Jones Mini large speculator standing this week equaled a net position of -514 contracts in the data reported through Tuesday. This was a weekly decline of -2,038 contracts from the previous week which had a total of 1,524 net contracts.

This week’s current strength score (the trader positioning range over the past three years, measured from 0 to 100) shows the speculators are currently Bullish with a score of 59.5 percent. The commercials are Bearish with a score of 36.3 percent and the small traders (not shown in chart) are Bullish with a score of 57.1 percent.

Price Trend-Following Model: Strong Uptrend

Our weekly trend-following model classifies the current market price position as: Strong Uptrend. The current action for the model is considered to be: Hold – Maintain Long Position.

Dow Jones Mini Futures StatisticsSPECULATORSCOMMERCIALSSMALL TRADERS
– Percent of Open Interest Longs:19.160.616.0
– Percent of Open Interest Shorts:19.762.213.8
– Net Position:-514-1,3451,859
– Gross Longs:16,17051,41513,578
– Gross Shorts:16,68452,76011,719
– Long to Short Ratio:1.0 to 11.0 to 11.2 to 1
NET POSITION TREND:
– Strength Index Score (3 Year Range Pct):59.536.357.1
– Strength Index Reading (3 Year Range):BullishBearishBullish
NET POSITION MOVEMENT INDEX:
– 6-Week Change in Strength Index:-26.525.9-8.1


Nasdaq Mini Futures:

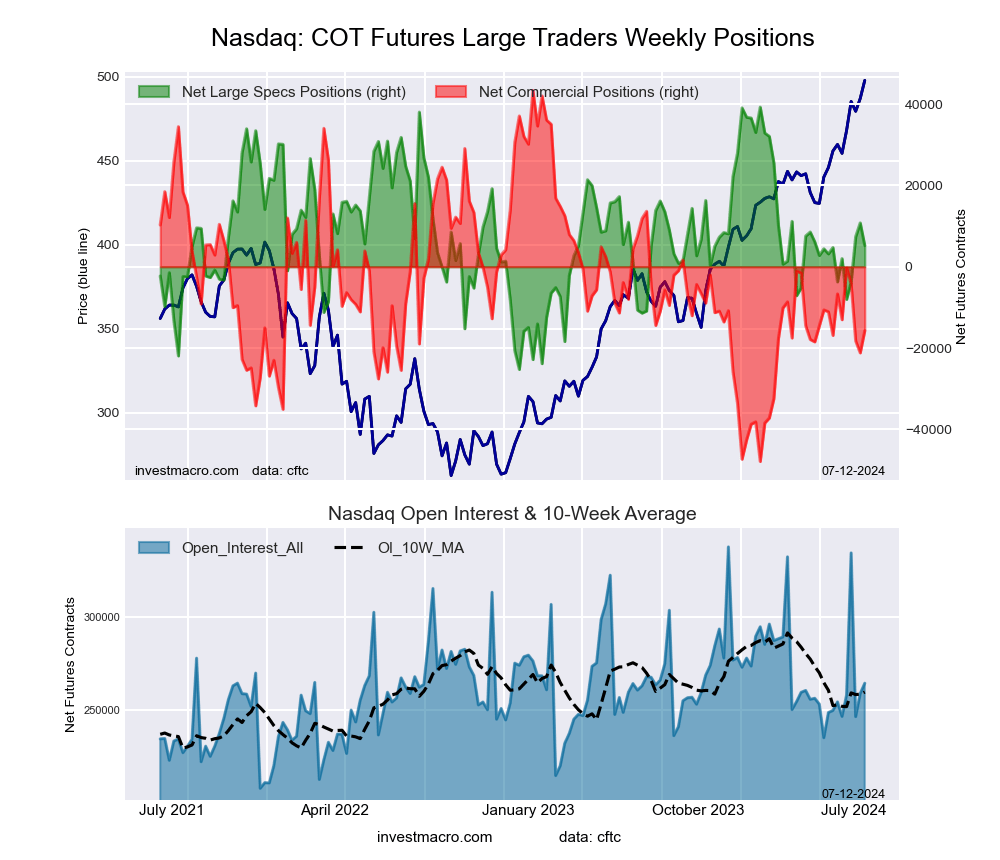
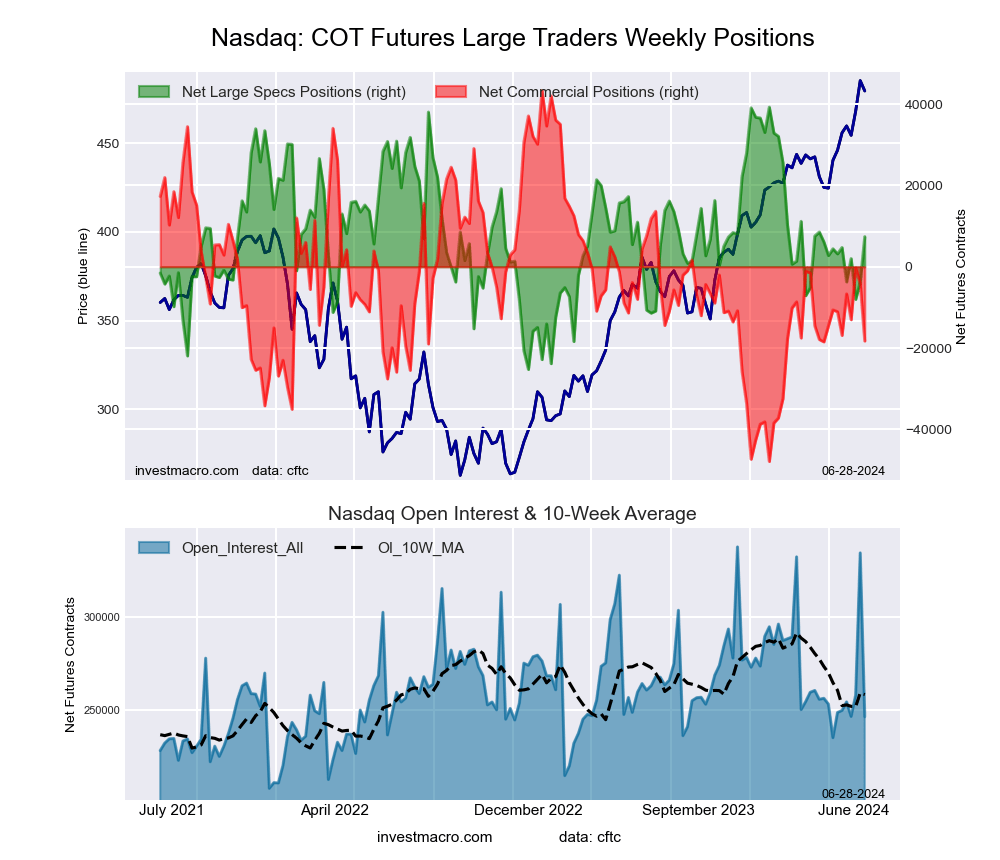
Nasdaq Mini Futures COT ChartThe Nasdaq Mini large speculator standing this week equaled a net position of 7,395 contracts in the data reported through Tuesday. This was a weekly boost of 11,220 contracts from the previous week which had a total of -3,825 net contracts.

This week’s current strength score (the trader positioning range over the past three years, measured from 0 to 100) shows the speculators are currently Bullish with a score of 50.6 percent. The commercials are Bearish with a score of 32.5 percent and the small traders (not shown in chart) are Bullish-Extreme with a score of 96.4 percent.

Price Trend-Following Model: Strong Uptrend

Our weekly trend-following model classifies the current market price position as: Strong Uptrend. The current action for the model is considered to be: Hold – Maintain Long Position.

Nasdaq Mini Futures StatisticsSPECULATORSCOMMERCIALSSMALL TRADERS
– Percent of Open Interest Longs:27.552.716.7
– Percent of Open Interest Shorts:24.560.112.2
– Net Position:7,395-18,26010,865
– Gross Longs:67,869129,88641,034
– Gross Shorts:60,474148,14630,169
– Long to Short Ratio:1.1 to 10.9 to 11.4 to 1
NET POSITION TREND:
– Strength Index Score (3 Year Range Pct):50.632.596.4
– Strength Index Reading (3 Year Range):BullishBearishBullish-Extreme
NET POSITION MOVEMENT INDEX:
– 6-Week Change in Strength Index:6.5-7.97.2


Russell 2000 Mini Futures:

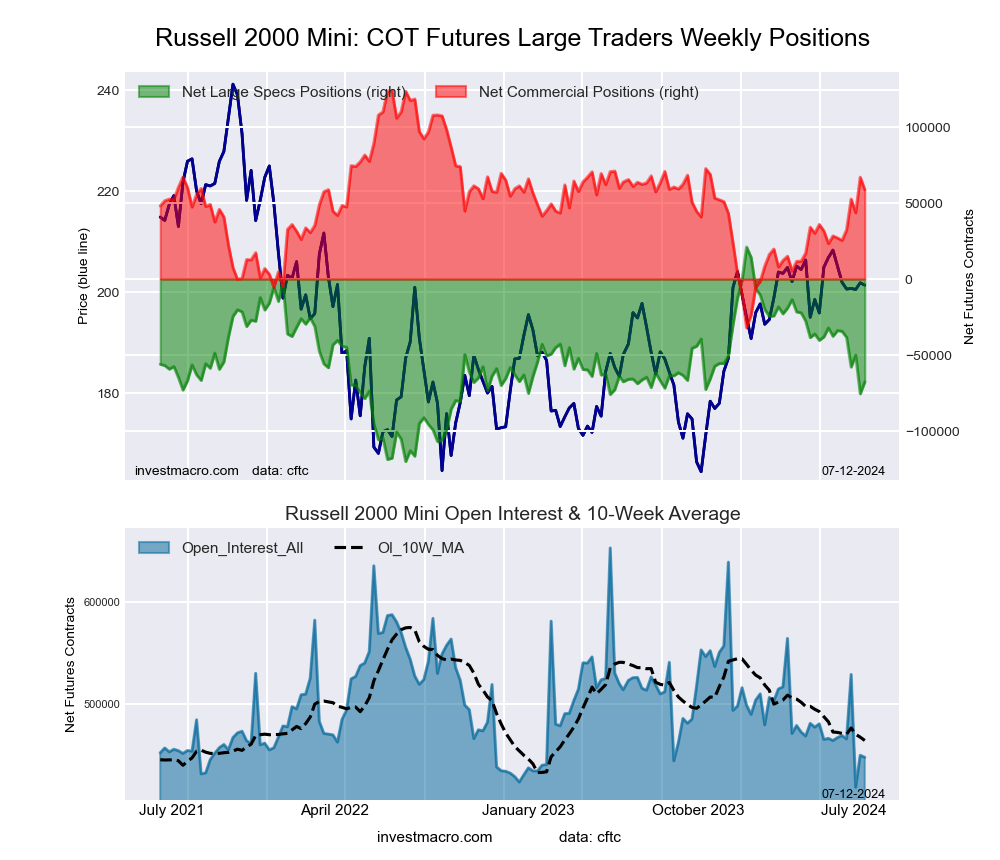
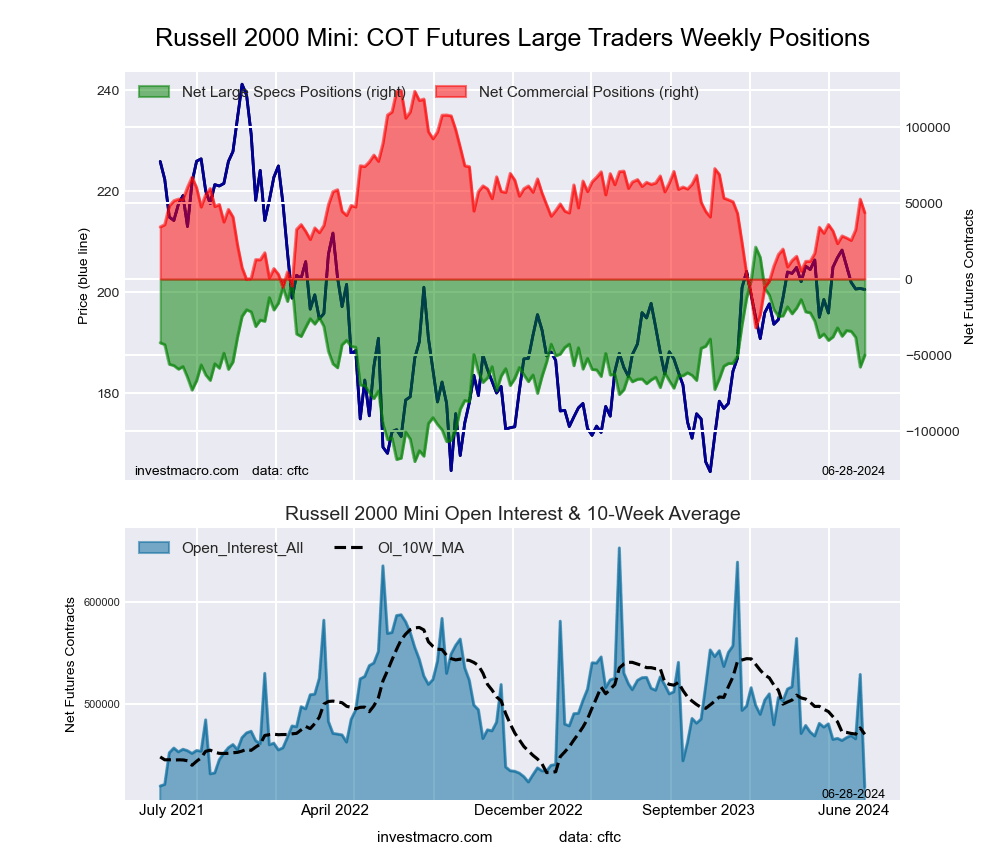
Russell 2000 Mini Futures COT ChartThe Russell 2000 Mini large speculator standing this week equaled a net position of -50,021 contracts in the data reported through Tuesday. This was a weekly rise of 7,827 contracts from the previous week which had a total of -57,848 net contracts.

This week’s current strength score (the trader positioning range over the past three years, measured from 0 to 100) shows the speculators are currently Bearish with a score of 49.6 percent. The commercials are Bearish with a score of 48.5 percent and the small traders (not shown in chart) are Bullish with a score of 50.4 percent.

Price Trend-Following Model: Weak Downtrend

Our weekly trend-following model classifies the current market price position as: Weak Downtrend. The current action for the model is considered to be: New Sell – Short Position.

Russell 2000 Mini Futures StatisticsSPECULATORSCOMMERCIALSSMALL TRADERS
– Percent of Open Interest Longs:14.378.16.2
– Percent of Open Interest Shorts:26.367.74.7
– Net Position:-50,02143,6496,372
– Gross Longs:59,883327,13226,052
– Gross Shorts:109,904283,48319,680
– Long to Short Ratio:0.5 to 11.2 to 11.3 to 1
NET POSITION TREND:
– Strength Index Score (3 Year Range Pct):49.648.550.4
– Strength Index Reading (3 Year Range):BearishBearishBullish
NET POSITION MOVEMENT INDEX:
– 6-Week Change in Strength Index:-12.713.0-8.0


Nikkei Stock Average (USD) Futures:

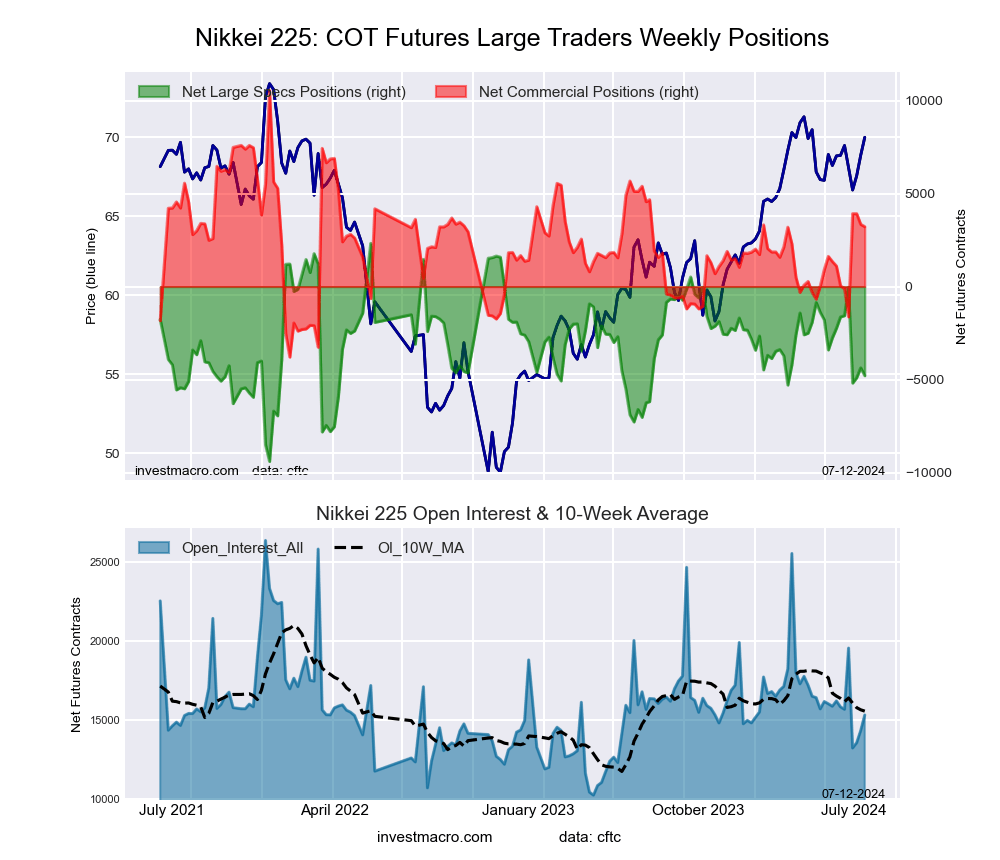
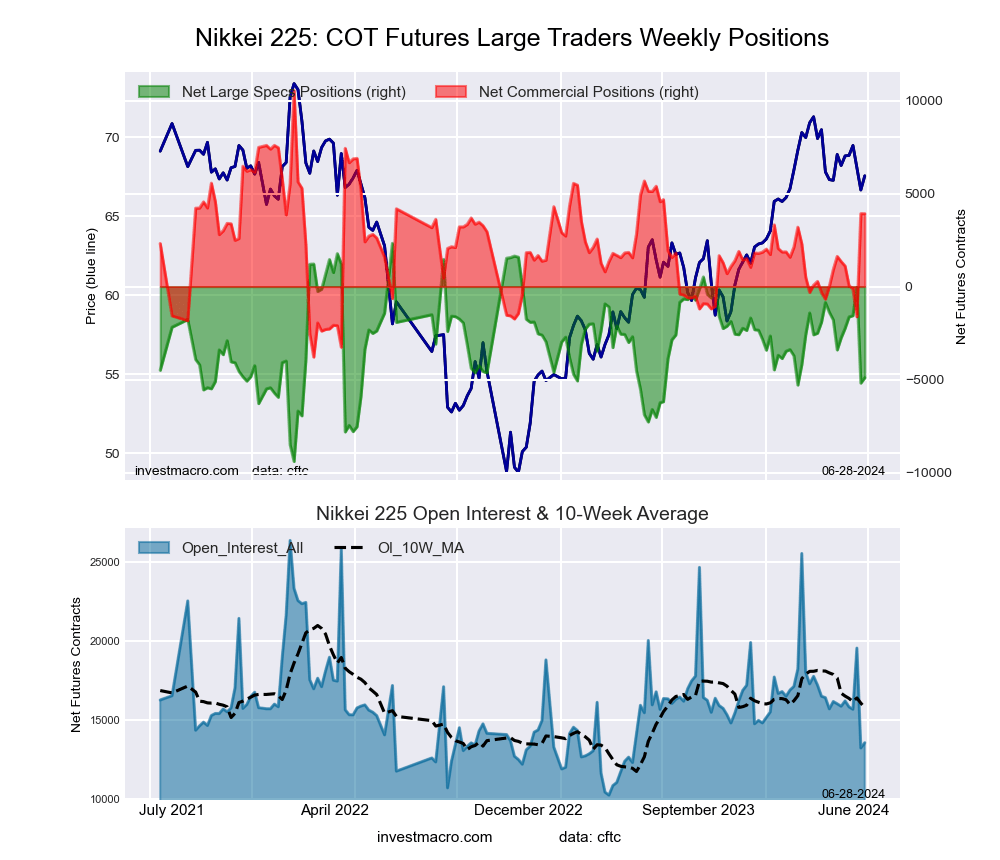
Nikkei Stock Average (USD) Futures COT ChartThe Nikkei Stock Average (USD) large speculator standing this week equaled a net position of -4,901 contracts in the data reported through Tuesday. This was a weekly increase of 288 contracts from the previous week which had a total of -5,189 net contracts.

This week’s current strength score (the trader positioning range over the past three years, measured from 0 to 100) shows the speculators are currently Bearish with a score of 38.4 percent. The commercials are Bullish with a score of 53.8 percent and the small traders (not shown in chart) are Bullish with a score of 53.8 percent.

Price Trend-Following Model: Downtrend

Our weekly trend-following model classifies the current market price position as: Downtrend. The current action for the model is considered to be: Hold – Maintain Short Position.

Nikkei Stock Average Futures StatisticsSPECULATORSCOMMERCIALSSMALL TRADERS
– Percent of Open Interest Longs:5.467.527.1
– Percent of Open Interest Shorts:41.638.619.8
– Net Position:-4,9013,918983
– Gross Longs:7349,1513,667
– Gross Shorts:5,6355,2332,684
– Long to Short Ratio:0.1 to 11.7 to 11.4 to 1
NET POSITION TREND:
– Strength Index Score (3 Year Range Pct):38.453.853.8
– Strength Index Reading (3 Year Range):BearishBullishBullish
NET POSITION MOVEMENT INDEX:
– 6-Week Change in Strength Index:-18.318.0-7.1


MSCI EAFE Mini Futures:

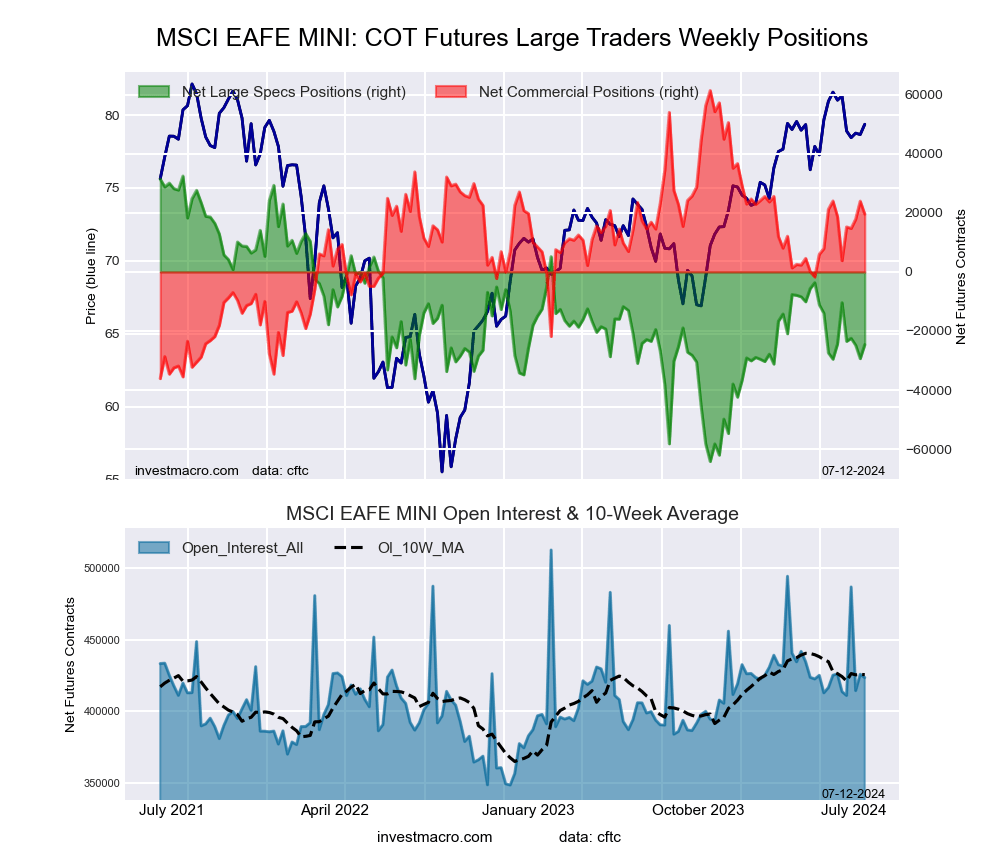
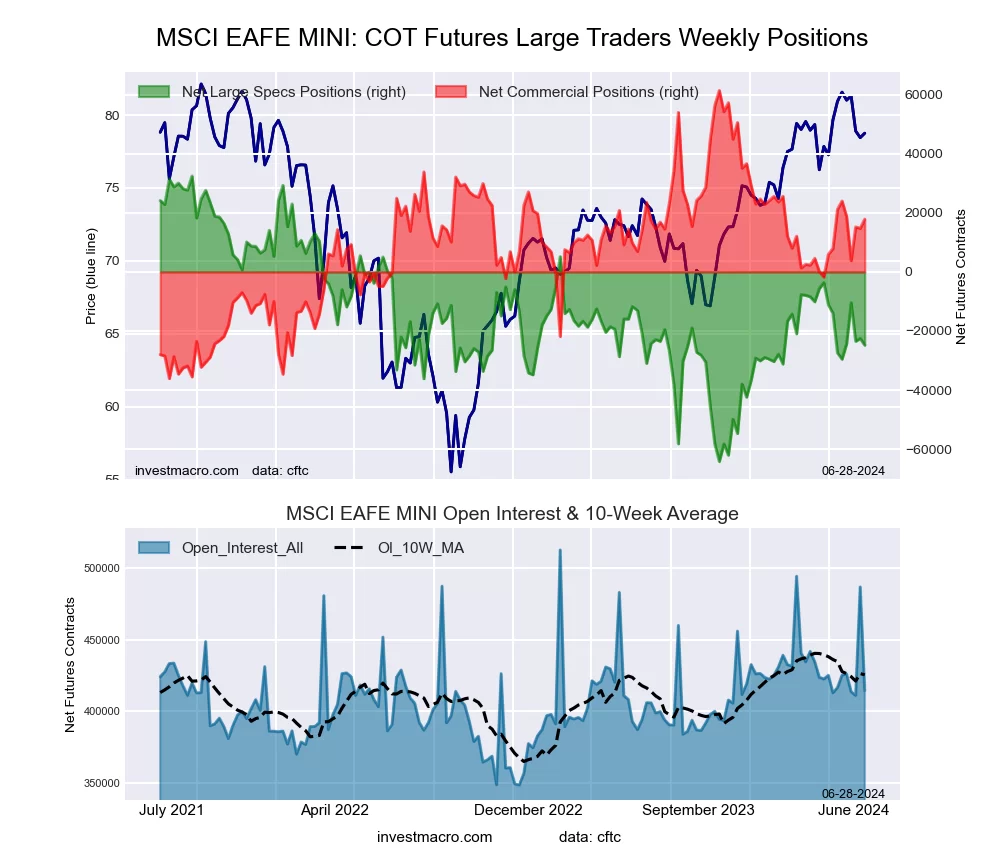
MSCI EAFE Mini Futures COT ChartThe MSCI EAFE Mini large speculator standing this week equaled a net position of -24,818 contracts in the data reported through Tuesday. This was a weekly fall of -2,331 contracts from the previous week which had a total of -22,487 net contracts.

This week’s current strength score (the trader positioning range over the past three years, measured from 0 to 100) shows the speculators are currently Bearish with a score of 40.7 percent. The commercials are Bullish with a score of 55.4 percent and the small traders (not shown in chart) are Bullish with a score of 51.6 percent.

Price Trend-Following Model: Weak Uptrend

Our weekly trend-following model classifies the current market price position as: Weak Uptrend. The current action for the model is considered to be: Hold – Maintain Long Position.

MSCI EAFE Mini Futures StatisticsSPECULATORSCOMMERCIALSSMALL TRADERS
– Percent of Open Interest Longs:7.689.22.8
– Percent of Open Interest Shorts:13.684.91.1
– Net Position:-24,81817,8706,948
– Gross Longs:31,609369,93511,558
– Gross Shorts:56,427352,0654,610
– Long to Short Ratio:0.6 to 11.1 to 12.5 to 1
NET POSITION TREND:
– Strength Index Score (3 Year Range Pct):40.755.451.6
– Strength Index Reading (3 Year Range):BearishBullishBullish
NET POSITION MOVEMENT INDEX:
– 6-Week Change in Strength Index:2.7-3.43.6


Article By InvestMacroReceive our weekly COT Newsletter

*COT Report: The COT data, released weekly to the public each Friday, is updated through the most recent Tuesday (data is 3 days old) and shows a quick view of how large speculators or non-commercials (for-profit traders) were positioned in the futures markets.

The CFTC categorizes trader positions according to commercial hedgers (traders who use futures contracts for hedging as part of the business), non-commercials (large traders who speculate to realize trading profits) and nonreportable traders (usually small traders/speculators) as well as their open interest (contracts open in the market at time of reporting). See CFTC criteria here.

Week Ahead: FRA40 braced for French elections

By ForexTime 

  • H2 kicks off with French/UK elections, ECB forum & NFP
  • FRA40 ↓ 5.4% since Macron call for snap election
  • National Rally currently leading polls
  • Index bearish on D1 but RSI near oversold
  • Key points of interest – 7700, 200-day SMA, 7470

An exceptional list of high-risk events may rattle global markets in the week ahead!

The second half of 2024 kicks off with elections in France and the United Kingdom, to the ECB forum and US jobs report among other key data:

Sunday, 30th June

  • CN50: China manufacturing & non-manufacturing PMIs
  • USDInd: New York Fed President John Williams speech
  • FRA40: First round of French legislative elections

Monday, 1st July  

  • CN50: China Caixin manufacturing PMI
  • AU200: Australia retail sales, Melbourne Institute inflation
  • EU50: Eurozone Manufacturing PMI
  • FRA40: France Manufacturing PMI
  • GER40: Germany Manufacturing PMI, CPI
  • UK100: UK Manufacturing PMI
  • US500: ISM Manufacturing

Tuesday, 2nd July

  • AU200: RBA meeting minutes
  • EU50: Eurozone CPI, unemployment, ECB President Lagarde speech
  • US500: Fed Chair Jerome Powell speech

Wednesday, 3rd July

  • CN50: China Caixin service PMI
  • EU50: Eurozone Services PMI, PPI
  • USDInd: US FOMC minutes, ISM services, initial jobless claims, Fed speak

Thursday, 4th July    

  • GER40: Germany factory orders
  • EU50: ECB meeting minutes
  • UK100: UK general elections
  • US Markets closed – Independence Day holiday

Friday, 5th July

  • CAD: Canada unemployment
  • EU50: Eurozone retail sales
  • FRA40: France trade, industrial production
  • GER40: Germany industrial production
  • SG20: Singapore retail sales
  • TWN: Taiwan CPI
  • US500: US June NFP report

FXTM’s FRA40 demands our attention due to the first round of French parliamentary elections over the weekend.

The FRA40 tracks the underlying CAC 40 index, which represents the 40 largest companies listed on the Paris Stock Exchange.

The lowdown…

The French political scene was thrown into chaos on June 9th after President Macron unexpectedly dissolved parliament following his defeat by the far right in EU elections.

Since then, the FRA40 has tumbled as much as 6.5% and heading for its biggest monthly loss in almost two years.

The bigger picture

In a two-round process on 30th June and 7th July, France will go to the polls to elect a new parliament after Macron called for snap elections.

If one candidate gains more than 50% of the vote, representing at least 25% of registered voters, they automatically win the elections. But this is an unlikely outcome given the current polls.

Any party that has obtained more than 12.5% of the vote can advance to the second round.

  • National Rally (far-right): 36%
  • New Popular Front (left-wing): 29%
  • Renaissance and allies (centrist): 21%

Note: President Macron belongs to Renaissance and allies.

Taking a deeper dive

President Macron will remain president regardless of how the election plays out.

However, he could be stuck with a prime minister and a government from a different party. This is the crux of the matter, especially when considering how unaligned Macron and the National Rally are on economic policies.

What does this mean?

This snap election could not have come at a worse time for the French economy.

Just last month its credit rating was downgraded by S&P Global Ratings, while the economy continues to experience subdued growth. If Macron is rendered powerless and unable to push reforms, this could mean more trouble for the French economy as political uncertainty becomes a key theme.

How will the elections impact the FRA40?

Investors have already been given a taste of how political jitters can rock the FRA40.

  • A shock outcome that sees an absolute majority for either the National Rally or New Popular Front could send the FRA40 tumbling as uncertainty over France’s policy future intensifies.
  • An outcome where all 3 parties make it into the second round of voting may also trigger volatility.

Technical outlook

The FRA40 is under intense pressure on the daily charts with prices respecting a bearish channel. Although the candlesticks are trading below the 50, 100 and 200-day SMA, the Relative Strength Index (RSI) is signalling that prices are approaching oversold levels.

  • Sustained weakness below the 200-day SMA, may signal a decline toward 7470, 7400 and 7290.
  • Should prices push back above the 200-day SMA, bulls could challenge 7700 and 7790.


Forex-Time-LogoArticle by ForexTime

ForexTime Ltd (FXTM) is an award winning international online forex broker regulated by CySEC 185/12 www.forextime.com

Is It Time To Unload Nvidia?

Source: Streetwise Reports (6/26/24)

Some financial experts say yes, others no. Read on to learn the rationale behind the conclusions and stance of several.

The movement of Nvidia Corp.’s (NVDA:NASDAQ) stock during June, rising to its all-time high and then plunging, has investors debating now whether to jump into it, bolster their existing position, or abandon it altogether. Whereas financial analysts and other experts generally agree the information technology (IT) stock has been overbought since early June, they differ, some radically, in their current recommendations on it.

“Nvidia has likely become one of the most overheated stocks we’ve witnessed in a quarter century,” Eric Fry of Fry’s Investment Report said in an InvestorPlace interview.

On June 18, Nvidia ousted Microsoft Corp. (MSFT:NASDAQ) from its spot as the world’s most valuable company, and last week, Nvidia’s stock peaked at US$140.76 per share. Since, it dropped to third place, therein suffering a loss of about US$500 billion ($500B) in value, Seeking Alpha reported on June 25. However, NVDA maintains about a 140% year-to-date gain and thus is the second-best performer in the Standard & Poor’s (S&P) 500 Index.

Is it OK To Buy?

None of the factors behind the stock’s recent descent into its current correction constitutes a sound reason to “turn gloomy on Nvidia,” Garfield Reynolds, Bloomberg’s Markets Live Asia team leader, wrote in a June 24 article. The five causes were expiring options, insider sales, the stock’s technically overbought state, investor reassessment of the stock after it dethroned Apple Inc. (AAPL:NASDAQ) and Microsoft, and a long squeeze.

“The bull case for the artificial intelligence (AI) darling along with the broader tech sector remains strong over the short to medium term, at the very least,” he wrote.

It would take a major event, such as a broad economic slump or a big earnings miss, to keep Nvidia down for long, asserted Reynolds.

Certainly, numerous analysts recommend Nvidia as a Buy. According to TipRanks, of the 41 analysts who rated the stock at some point in the last three months, 38 have it Buy, three Hold, and none Sell. Zacks Investment Research, for instance, has a Strong Buy rating on it.

“Even with those concerns about overconcentration lingering,” he added, “the selloff would need to extend significantly further to change the narrative away from the consensus call that the AI revolution will keep going and that Nvidia stands to benefit hugely as a result.”

As such, Reynolds expects new buyers of the stock on future price dips, he wrote.

Certainly, numerous analysts recommend Nvidia as a Buy. According to TipRanks, of the 41 analysts who rated the stock at some point in the last three months, 38 have it Buy, three Hold, and none Sell. Zacks Investment Research, for instance, has a Strong Buy rating on it.

In a June 22 article, The Motley Fool’s Edward Shelton suggested that investors should consider three points when deciding what to do regarding Nvidia.

One, Nvidia stock being overbought does not preclude it from climbing further. Case in point, he said, is the stock’s last pullback, in March, of 20%, after which the price soared to its highest point ever.

Two, NVDA is not in a bubble, despite what analysts say, because the fundamentals support its valuation.

Three, the company’s earnings per share (EPS) guidance for 2025 of US$3.61 could be conservative. Should earnings turn out to be higher (some analysts predict US$5), the stock would look cheap.

Ballanger Says Think Twice Before Buying

According to Michael Ballanger, editor & publisher of GGM Advisory Inc., investors should take seriously Nvidia’s recent shift into a correction. The stock is coming down from its peak “with a full bearish moving average convergence/divergence (MACD) rollover and ‘sell signal’ now complete,” he described in a June 24 email alert.

A sector rotation out of tech stocks and into more conservative Dow Jones Industrial Average blue chip stocks is underway, he noted, but the whiplashing of this a long-time market leader into a correction could be a harbinger of what is to come.

“If ‘AI’ starts to correct,” Ballanger warned, “the entire market is going with it, including the Dow and the S&P 500.”

Newsletter Writers Say Do Not Buy Now

Chris Johnson, Money Morning qualitative specialist, implied that it might be better to wait to Buy Nvidia as there is a good chance the stock will present a short-term opportunity to do so on a future pullback.

“If ‘AI’ starts to correct,” Michael Ballanger of GGM Advisory Inc. warned, “the entire market is going with it, including the Dow and the S&P 500.”

These opportunities often arise with heavily traded stocks after they experience persisting overbought conditions and the pullbacks that typically follow.

“Investors looking for a deeper correction in the stock should consider the US$100 price target as an ideal price for longer-term support for Nvidia shares,” he noted in a June 24 article. (At close today, the tech company was at US$126 per share.)

Kimberley Koenig with Investor’s Business Daily flat out advised against buying Nvidia right now. Instead, she recommended on June 25, “Wait for selling to subside and another base to form or follow-on buy point to present itself to buy the AI chip stock.”

One Expert Says Sell It All Today

The advice of Technical Analyst Clive Maund, based on his interpretations of the stock’s 10-year and two-year charts, is to sell Nvidia.

“The main takeaways for us are that Nvidia should be ‘avoided like the plague’ simply because it has gone up so much and is massively overbought,” he wrote in a June 23 report. “Anyone holding should, of course, take profits soon.”

He explained that on the charts, the MACD indicator shows the stock has become “insanely overbought.” However, he noted, “Recent volume does not look terminal as it has not (yet) risen to become climactic, and the accumulation line remains strong.” These indicators suggest that rather than immediately plunging, the stock may form a large top pattern over some months, during which time it could even creep higher.

Eric Fry of Fry’s Investment Report suggested investors follow the lead of the country’s billionaires and unload not just Nvidia stock but also the other tech giants’ stock now because, he said, an entire tech market crash is coming.

“There’s an undeniable tension gripping the markets right now, and if your gut is telling you that something monumental is lurking just over the horizon, trust me, your instincts are dead on,” he said.

Fry likened Nvidia stock today to Cisco stock in the 1990s. Though Cisco then had nearly twice the earnings power of Nvidia today, he said, when the dot-com bubble burst, it dropped about 87% from its peak.

Yes, there is room for growth in the AI market, and yes, Nvidia could be an AI star over the long term, said Fry. However, world-changing stocks go through their own boom and bust periods.

“I do want people to be aware of the cyclical risks involved here, at these crazy valuations,” he added.

Fry forecasted a future “tidal wave of selling to engulf the tech titans of Wall Street — Nvidia, Apple, Microsoft, Google, Meta and more” — in what he’s calling The 2024 Tech Reset. Billionaires, including Jeff Bezos, Warren Buffet, Elon Musk, and Mark Zuckerberg, have already started selling tech stocks, even their own company’s stock. They are moving their money into next-gen stocks, which Fry defined as “stocks of businesses that are essential for the growth and prosperity of society as a whole.”

This massive selloff Fry predicted will cause tech stocks to plummet from their record highs and will, in the process, drag down thousands of other stocks, he warned. It will “erase years of investors’ gains, in the blink of an eye.”

Sector to Hit $29 Trillion by 2030

Currently IT is facing some challenges, and in the short term “the demand environment remains uncertain as enterprises add more scrutiny to the budgeting process and reduce discretionary IT spending,” CIBC wrote in a June 20 report. The current environment has dampened the expectation held since last year that demand would start improving in H2/24.

The report asserted that the initial “gen AI boom” is in the rear-view mirror, and what is happening now is a “period of resetting expectations.” Despite most companies knowing they need AI strategies, they are still deciding on what these will be, the analysts said.

The long-term outlook for IT is brighter. Growth for the IT market is forecasted up to 2030, at a 15% compound annual growth rate, according to Exactitude Consultancy, a market research and consulting services firm. By 2030, the market is projected to increase to US$28.99 trillion ($28.99T) in value from US$10.9T in 2023.

Streetwise Ownership Overview*

Nvidia Corp. (NVDA:NASDAQ)

Institutions: 67.7%
Retail: 28.02%
Management & Insiders: 4.23%
Strategic Investors: 0.05%
67.7%
28.0%
4.2%
*Share Structure as of 6/26/2024


Accelerated advancement in AI, cloud computing, the Internet of Things and cybersecurity is the primary growth driver, noted Exactitude.

Ownership and Share Structure

According to Reuters, 4.23% of the company is held by management and insiders.

0.05% is with strategic investors. Milestone Resources Group Ltd. has 0.02%, with 4.39 million, and Banco Santander SA has 0.01%, with 2.10 million.

67.70% is held by institutions. The VanGuard Group Inc. has 8.63%, with 2,122.88 million shares. BlackRock Institutional Trust Company N.A. has 4.82%, with 1,186.45 million. Fidelity Management & Research Company LLC. has 4.51%, with 1,109.18 million.

The rest is with retail investors.

Nvidia has 24.6 billion (24.6B) shares outstanding and 23.5B free float traded shares.

The company’s market cap is US$3.1 trillion. Its stock has traded between US$39.23 and US$140.76 per share over the past 52 weeks.


Important Disclosures:

  1. Doresa Banning wrote this article for Streetwise Reports LLC and provides services to Streetwise Reports as an independent contractor.
  2.  This article does not constitute investment advice and is not a solicitation for any investment. Streetwise Reports does not render general or specific investment advice and the information on Streetwise Reports should not be considered a recommendation to buy or sell any security. Each reader is encouraged to consult with his or her personal financial adviser and perform their own comprehensive investment research. By opening this page, each reader accepts and agrees to Streetwise Reports’ terms of use and full legal disclaimer. Streetwise Reports does not endorse or recommend the business, products, services or securities of any company.

For additional disclosures, please click here.

Young investors: Here’s some tips for getting into the market

By Sorin Rizeanu, University of Victoria 

You’ve likely heard of Minecraft. It’s a simple game where you slowly place blocks and craft items from containers to castles and entire cities. You’ve probably also heard of the first-person shooter Call of Duty (COD), where players navigate fast-paced war zones.

Like gaming, investing is all about how you approach it. You can build slow but safe, like in Minecraft, or you can go fast and risk more, like in COD.

If you’re a young person who has just gotten your first paycheck or saved a tidy sum from your first job, you might be thinking about how to invest your money.

However, the stock market can be a daunting place. Fortunes are built and lost in days. You can take the fast approach and risk it all on getting the big win. Or, with the proper temperament, you can build a significant source of additional income one block at a time. But where to start? And how does it all work?

Investing 101

You’ve probably heard of investment apps like Robinhood or Wealthsimple, or ones like Coinbase that allow you to invest in crypto currencies.

Investing is pretty much what you make of it. It can be like Minecraft, slowly placing blocks to develop a long-term diversified set of assets through investment funds, like exchange traded funds (ETFs) or mutual funds.

Most investment funds hold portfolios of stocks, bonds and other investments. ETFs trade on exchanges just like stocks, and most passively track an index, with little or no active management by fund managers. Mutual funds are more actively managed and they generally have higher fees than ETFs.

If you’re more of a risk-taker, investing can also be fast-paced like COD: shooting with options, penny stocks, crypto and other speculative tools.

Similar to gaming, you are only one participant in a much bigger world. There are days when you will lose and days when you win. Strategies that work in some situations but not in other situations. Expert players and novices.

If you’re completely new to things, try out an investing simulation. Some trading platforms allow you to use a version of their app or website where you can make simulated investments. Some of them are free or cost around $10-$15, like TradingView and eToro. MarketWatch even lets you create an investing game that you can invite your friends to participate in.

Next, you’ll need an investment account. Most big banks offer self-managed investment accounts. If you want to save a bit, check out discount brokers that charge lower or no commission (but read the fine print and know what other fees they might charge you).

Be sure to check out any tax-free investing accounts available in your country, like the TFSA in Canada or Roth IRA in the United States. These are a valuable way to grow your net worth without paying additional tax.

What kind of investing should I get into?

Take a lesson from Bob, the world’s worst market timer. He starts investing at 22, and every time he does, the market crashes. You’d guess he loses all his money, right? Not really, over his working life Bob invests $184,000, but ends up with a total of $1.1 million at retirement.

How? Bob put his money into an S&P 500 index fund and kept it to retirement, through good or bad.

The moral of the story is that you don’t have to be lucky or very savvy. Most important is to have a diverse portfolio and stay in the market. Don’t sell or buy in a panic, keep contributing. Buy diversified funds, rather than individual stocks, at least in the beginning. Then, as you learn, you can pick stocks and even invest part of your portfolio in riskier assets.

You still have decades to slowly get your millions.

Some strategies that have proven their worth

The value investing strategy, made famous by financial analyst Benjamin Graham and championed by the likes of American investor Warren Buffett, is summarized by with the motto: “This too will pass.”

Basically, pick a good company, in a moment when it’s undervalued for some reason: bad news, lost contract, temporary mismanagement etc. Buffett has likened good companies to castles with a deep moat around them – that is they have a competitive edge durable in time, an unique product, customer loyalty or pricing power. Think Apple, American Express or Coca Cola.

The growth investing strategy, championed by fund manager Cathie Wood, tries to identify companies whose earnings will grow very fast (but could crash equally fast). Companies like Tesla, Coinbase, UiPath, Roku etc. AI has given a huge boost to this strategy recently, but in long term, it’s hard to tell if it’s better than the value strategy.

A different approach, favoured by investors that prefer a more stable stream of income, is the dividend strategy. Dividends are the money distributed to shareholders from company’s profits.
Historically, dividend stocks have outperformed the S&P 500, and with less volatility. Think about it: you get a return on investment from stock price growth as well as dividends that you can reinvest.

In sum, pick a strategy that fits you and get to work. You can pick stocks, or you can pick diversified funds. As investor Peter Lynch insisted, “know what you own, and know why you own it.” Invest in stocks or funds whose business model you understand. Love cars? Study different manufacturers, see what different companies are working on, what customers like this year, and figure out who’s making money before quarterly statements are pointing out the winners and losers.

What should I be careful about?

Many new investors buy on the hype. Imagine there’s some good news coming up about Tesla. You wake up, and while having your coffee, you see the news and buy the stock.

But think. Investors following TSLA already know what the article is about. By the time you’ve read the news, people with deep pockets on Wall Street are already placing their bets. By the time you buy the stock, the market will have already integrated that news and now the price will probably go down.

Same with the long-term hype: when your cab driver is giving stock or crypto advice it’s time to get out of the market.

Another pitfall is the quick money, speculation, dopamine addiction. Subreddits like r/wallstreetbets provide many great examples of this. If you turn your life into a casino, you will win some times, but in the end the house always wins. A bet here and there can be fun though.

As a young person, you have an advantage: time. As you get older you will understand the long-term trends and market drivers — economy, geo-politics, innovation and so forth. As you progress in your career, you will understand more about your industry and this too may turn into profits. Over the years, eight per cent per year, with compounding, goes very far.

Finally, as ethical people, we need to walk the talk. We can’t pretend to want to save the Earth if our money is going to heavy polluters. Beware of pretenders — many are just deceptively mimicking behaviours to get high environmental, social and governance scores.

Research well your investment and its entire supply chain. Think about what goes into making the product, the people behind it and what impact it has on our world. Are you morally comfortable giving your money to certain companies?

Put in the time and don’t rush in, some investments are for life.The Conversation

About the Author:

Sorin Rizeanu, Assistant Professor, Gustavson School of Business, University of Victoria

This article is republished from The Conversation under a Creative Commons license. Read the original article.


Chevron vs. NextEra Energy: Which Dividend Stock is the Better Buy?

By The Ino.com Team

Despite the industry challenges, Chevron Corporation (CVX) and NextEra Energy, Inc. (NEE) are both gaining significant traction and rewarding shareholders with reliable dividends. But if you had to choose between them, which would be the better buy?

Chevron’s Dividend Strength Over 37 Years

Chevron is one of the largest integrated energy majors globally, with operations spanning oil production, transportation, and processing. This strategic spread helps cushion the inherent volatility in oil and gas markets, ensuring stability and sustained growth.

Recently, oil prices dipped after hitting seven-week highs. Brent crude futures slipped to $85.27 a barrel, while U.S. West Texas Intermediate crude dropped to $81.47 per barrel. Despite the cyclical nature of the oil sector, Chevron’s solid operational and financial performance continues to shine through.

In its latest earnings release, the company reported a double-digit increase in worldwide production and returned $6 billion in cash to shareholders. CVX beat first-quarter earnings estimates, with an adjusted EPS of $2.93, surpassing analysts’ expectations of $2.87. U.S. production surged to 1.57 million barrels of oil and gas per day, a 35% increase from a year ago, thanks to strong output from the Permian and Denver-Julesburg basins.

What truly sets Chevron apart is its financial muscle. The company’s debt-to-equity ratio is a mere 0.12, the lowest among its peers. This low leverage gives CVX the flexibility to support its operations and sustain its dividends even during downturns, providing a significant competitive advantage.

In the first quarter of 2024, Chevron’s return on capital employed exceeded 12%, reflecting efficient management and strategic investments. The company increased its quarterly dividend by 8% sequentially to $1.63 per share and repurchased nearly $3 billion worth of its shares.

With 36 consecutive years of dividend growth and a forward dividend yield of 4.16%, Chevron offers investors a compelling mix of income and growth potential. CVX has a four-year average yield of 4.35%, and its dividend payouts have grown at a CAGR of 6.4% over the past three years.

Moreover, the company aims to grow its annual free cash flow (FCF) by nearly 10% through 2027, even if Brent crude prices fall to $60 per barrel. With Brent crude currently around $83 per barrel, Chevron has ample room for growth. CVX’s strategy focuses on improving ROCE by investing in high-return areas like the Permian Basin, expected to drive substantial cash flow growth.

Increasing cash flow and robust dividend growth make CVX an attractive long-term investment. The company’s ability to navigate market fluctuations and maintain financial stability positions it as a top choice for investors seeking security and growth in the energy sector. Shares of CVX have gained over 4% over the past six months and nearly 5% year-to-date.

How Is NEE Positioned to Reward Shareholders?

NextEra Energy is a dual force in the energy sector, uniquely positioned with substantial operations in regulated utilities and renewable energy. As one of the largest regulated utility companies in the U.S., NEE enjoys stable earnings through its main subsidiary, Florida Power & Light (FPL).

FPL’s recent expansion efforts, including the addition of 1,640 megawatts of new solar capacity, underscore its commitment to clean energy and meeting the growing electricity demands. In the first quarter that ended March 31, 2024, FPL reported a net income of $1.17 billion or $0.57 per share, reflecting an increase of 9.5% and 7.5% year-over-year, respectively.

Simultaneously, NextEra Energy Resources, the company’s renewable energy arm, continues to advance in sustainable energy production. The segment had a record quarter, adding approximately 2,765 megawatts of new renewables and storage projects to its backlog. Its adjusted earnings for the quarter were $828 million and $0.40 per share, up from $732 million and $0.36 per share in the first quarter of 2023.

Financially, NEE’s performance remains robust. During the quarter, the company’s adjusted earnings amounted to $1.87 billion or $0.91 per share, reflecting an increase of 11.6% and 8.3%, respectively. Its adjusted EBITDA was $462 million, and $164 million cash was available for distribution. Moreover, its revenue and EPS have grown at respective CAGRs of 16.6% and 20.2 over the past three years.

Looking forward, NEE sees significant growth potential in the U.S. renewables and storage market, expecting it to triple over the next seven years from 140 gigawatts to around 375-450 gigawatts. With an existing 74-gigawatt operating fleet, split between FPL and Energy Resources, the company aims to expand to over 100 gigawatts by 2026, further strengthening its operational scale and creating additional value for its stakeholders.

On June 17, NEE paid its shareholders a quarterly dividend of $0.52 per share. With 28 consecutive years of dividend growth and a forward dividend yield of 2.84%, NEE offers an attractive proposition for income-oriented investors seeking exposure to the clean energy sector. Also, it has a four-year average dividend yield of 2.23% and has grown its dividend payouts at a CAGR of 10.2% over the past three years.

All said, NEE stands at the forefront of the energy transition, leveraging its dual strengths in regulated utilities and renewable energy to drive sustainable growth and value creation. The stock has gained over 21% over the past six months and over 19% year-to-date.

Should You Buy Chevron or NextEra Energy?

Analysts are bullish on these dividend-paying giants, each presenting significant upside potential. So, how do these two stack up?

Mizuho gave Chevron a Buy rating and raised the price target from $200 to $205, implying a substantial 23.59% upside from the current price of $156.64. This sentiment is echoed by other prominent analysts, with HSBC and Scotiabank setting price targets of $178 and $195, respectively. This results in an average price target of $186.95, suggesting a potential 16% upside.

On the other hand, NextEra Energy has also caught the eye of analysts. BMO Capital recently maintained an Overperform rating on the stock and raised the price target from $78 to $79, suggesting an 8.3% upside from the current price of $72.46.

In terms of dividend yield as a rough measure of value, CVX’s 4.2% yield is far more attractive compared to NEE’s modest 2.8%. While both stocks historically offered higher yields during oil downturns, NextEra Energy’s current yield is comparatively lower. This positions CVX as a stronger income play and suggests it may be the more attractive stock between the two.


By Ino.com – See our Trader Blog, INO TV Free & Market Analysis Alerts

Source: Chevron vs. NextEra Energy: Which Dividend Stock is the Better Buy?

Why Broadcom’s (AVGO) 10-for-1 Stock Split Could Attract a New Wave of Investors

By The Ino.com Team

Broadcom Inc. (AVGO), a prominent player in the semiconductor industry, announced a 10-for-1 forward stock split set to take effect on July 15, 2024, taking advantage of a rally in its shares this year. This decision comes on the heels of an outstanding second-quarter performance, underscoring Broadcom’s strategic positioning amid the burgeoning artificial intelligence (AI) revolution.

Understanding Stock Split Mechanics and Strategic Implications for Broadcom

A stock split involves dividing each existing share into multiple shares, effectively lowering the share price proportionally while maintaining the company’s total market capitalization. In AVGO’s case, each shareholder will receive nine additional shares for every one share held, resulting in a tenfold increase in the number of outstanding shares.

The primary objective of a stock split is to make shares more affordable and accessible to a wide range of retail investors by reducing the nominal share price. Given Broadcom’s share price surpassing $1,800 recently, the split aims to address perceived affordability barriers that may have deterred investors.

The increased accessibility can broaden AVGO’s investor base, potentially stimulating demand for its shares. Consequently, a higher number of outstanding shares resulting from the stock split typically leads to higher trading volumes. This enhanced liquidity can benefit both existing and new investors, allowing for easier entry and exit from positions.

Comparison with NVIDIA’s Recent Similar Move

Broadcom’s stock split mirrors a similar move by NVIDIA Corporation (NVDA), its rival in the AI hardware market. With more individual investors gaining access to Nvidia’s shares post-split, which came into effect at the close of trading on June 7, increased trading activity and demand were observed, potentially driving share prices higher.

NVIDIA’s stock is trading above its 50-day and 200-day moving averages of $99.28 and $68.61, respectively. NVDA’s successful split this month was preceded by significant market gains, highlighting the strategic timing of Broadcom’s decision to capitalize on investor sentiment surrounding the AI and semiconductor sectors.

Historically, stock splits are viewed as a bullish signal. According to data from BofA research, total returns for companies announcing stock splits are about 25% in the 12 months after a stock split compared to 12% gains for the S&P 500 index.

Broadcom’s Unprecedented Growth Amid the AI Boom

With a $839.05 billion market cap, AVGO is a technology leader that develops and supplies semiconductor and infrastructure software solutions. The company manufactures sophisticated networking chips for handling vast amounts of data used by AI applications such as OpenAI’s ChatGPT, positioning it as one of the beneficiaries of increased enterprise investments in the boom.

According to Grand View Research, the global AI market is projected to reach $1.81 trillion by 2030, growing at a CAGR of 36.6% during the forecast period (2024-2030). As AI continues to revolutionize industry verticals, including automotive, healthcare, retail, finance, and manufacturing, chipmakers like Broadcom are at the forefront, providing the essential chips that power AI applications.

Broadcom’s second-quarter results were primarily driven by AI demand and VMware. For the quarter that ended May 5, 2024, AVGO’s net revenue increased 43% year-over-year to $12.49 billion. Its revenue surpassed the consensus estimate of $12.01 billion. Revenue from its AI products was a record $3.10 billion during the quarter. Broadcom reported triple-digit revenue growth in the Infrastructure Software segment to $5.29 billion as enterprises increasingly adopted the VMware software stack to build their private clouds.

AVGO’s gross margin grew 27.2% from the year-ago value to $7.78 billion. Its non-GAAP operating income rose 32% year-over-year to $7.15 billion. Furthermore, the company’s non-GAAP net income came in at $5.39 billion or $10.96 per share, up 20.2% and 6.2% year-over-year, respectively. Its EPS exceeded the analysts’ expectations of $10.84.

Also, the company’s adjusted EBITDA grew 30.6% from the prior year’s quarter to $7.43 billion. It reported a free cash flow, excluding restructuring and integration, of $4.45 billion, up 18% year-over-year. As of May 5, 2024, AVGO’s cash and cash equivalents were $9.81 billion.

After an outstanding financial performance, Broadcom raised its fiscal year 2024 guidance. The company expects full-year revenue of nearly $51 billion. Its adjusted EBITDA is expected to be approximately 61% of projected revenue.

Favorable Analyst Estimates

Analysts expect AVGO’s revenue for the third quarter (ending July 2024) to grow 45.6% year-over-year to $12.92 billion. The consensus EPS estimate of $12.11 for the current quarter indicates a 14.9% year-over-year increase. Moreover, the company has surpassed the consensus revenue and EPS estimates in each of the trailing four quarters, which is impressive.

For the fiscal year ending October 2024, Street expects Broadcom’s revenue and EPS to grow 43.4% and 13% year-over-year to $43.37 billion and $47.74, respectively. In addition, the company’s revenue and EPS for the fiscal year 2025 are expected to increase 15.3% and 25.6% from the previous year to $59.22 billion and $59.95, respectively.

Bottom Line

As AI continues to revolutionize several sectors, chipmakers such as Broadcom are at the forefront, offering essential semiconductor and infrastructure software solutions powering this technology. Driven by robust AI demand and VMware, AVGO reported solid second-quarter performance, exceeding analysts’ estimates for revenue and earnings.

The management expressed confidence in the company’s growth prospects by raising the company’s fiscal year 2024 guidance for revenue to $51 billion and adjusted EBITDA to 61% of revenue. Moreover, AVGO’s strong financial health enabled it to approve a quarterly dividend of $5.25 per share, payable on June 28, 2024.

The company pays an annual dividend of $21 per share, which translates to a yield of 1.17% on the current share price, while its four-year average dividend yield is 2.69%. Its dividend payouts have grown at CAGRs of 12.9% and 17.5% over the past three and five years, respectively. Broadcom also raised its dividend payouts for 13 consecutive years.

In the last quarterly earnings release, AVGO announced a ten-for-one forward stock split of its common stock, making ownership of Broadcom stock more accessible to investors. The company’s decision to execute a stock split represents a strategic move to enhance shareholder value and broaden investor participation.

By making its shares more accessible and increasing liquidity, Broadcom positions itself to attract a diverse array of investors keen on capitalizing on the AI-driven semiconductor boom. The stock split is a pivotal catalyst that could propel AVGO’s growth trajectory forward, cementing its status as a critical player in the evolving tech industry.

In a report released on June 16, William Stein from Truist Financial maintained a Buy rating on AVGO, with a price target of $2,045. Further, Oppenheimer’s Rick Schafer increased the price target on Broadcom from $1,500 to $2,000 while maintaining a Buy rating on the stock.

In addition to Oppenheimer’s rating update, other analysts adjusted their price targets for AVGO. Goldman Sachs’ Toshiya Hari raised the price target from $1,550 to $1,850 and maintained a Strong Buy rating. Also, JP Morgan’s Harlan Sur raised the price target from $1,700 to $2,000 and maintained a Strong Buy rating on the stock.

In conclusion, for investors eyeing opportunities in the dynamic intersection of AI and semiconductor sectors, Broadcom’s ten-for-one stock split presents a compelling avenue to consider, backed by sound fundamentals and strategic foresight.


By Ino.com – See our Trader Blog, INO TV Free & Market Analysis Alerts

Source: Why Broadcom’s (AVGO) 10-for-1 Stock Split Could Attract a New Wave of Investors

FX, Stocks, Commodities, Cryptos… Learn How to Know When This Key Price Pattern is Over (Video)

By Elliott Wave International

“12345-ABC.” That’s a basic Elliott wave pattern in a nutshell. That “12345” is a so-called impulse, and it’s a key price pattern to know, because impulses point in the direction of the larger trend. In this clip from a recent Trader’s Classroom lesson, host Favio Poci shows you step-by-step how to spot an impulse and know when it’s likely over. (Market in focus: EUR/CHF, but you can apply this to any liquid market.)

Continue Your Education on Impulse Waves with this FREE Online Course!

For a very limited time, you can get free access to our online course, “How to Spot and Capitalize on Impulse Waves.” ($99 value)

In about 1 hour, you’ll learn:

  1. “What do I look for?” — just what, exactly, should you look for on a price chart? See an easy way to spot an impulse wave.
  2. “What does it tell me?” — Impulse waves are great at showing you the direction of the larger trend (which, as you know, is “your friend”!)
  3. “Are there variations?” — Most impulse waves are simple, but some are… well, different. You’ll see how to quickly distinguish one from another.

Start Watching Now

This article was syndicated by Elliott Wave International and was originally published under the headline FX, Stocks, Commodities, Cryptos… Learn How to Know When This Key Price Pattern is Over (Video). EWI is the world’s largest market forecasting firm. Its staff of full-time analysts led by Chartered Market Technician Robert Prechter provides 24-hour-a-day market analysis to institutional and private investors around the world.

Expert Says Lithium-Brine Stock on Course to New Highs

Source: Clive Maund (6/17/24) 

Technical Analyst Clive Maund shares why he believes American Salars Lithium Inc. (USLI:CSE) is a Strong Buy, including the recent news that it acquired a new project.

American Salars Lithium Inc. (USLI:CSE) is a lithium exploration company whose stock is viewed as a Strong Buy here for both fundamental and technical reasons.

First we will consider the fundamentals of the company before proceeding to review its latest stock chart.

The first point to make is a general one concerning the outlook for lithium itself. As you may recall, after a massive speculative runup in 2020 and especially in 2021, the lithium price fell victim to a severe bear market that ran from mid-2022 through the end of 2023, as we can see on the following 5-year chart. By the end of last year, this bear market had exhausted itself, and a basing process began that has continued up to the present.

Chart courtesy of tradingeconomics.com

The chart implies that perhaps after some further basing action, lithium prices will start higher again in a new bull market.

Turning now to the particulars of the company itself, American Salars has a range of projects in Argentina, Canada, and the U.S. Its flagship project is the 3000 Hectare Candela II Salar project in Argentina, which features a National Instrument 43-101 inferred resource of 457,000 tonnes of lithium carbonate that is open for expansion.

Other projects include the Blackrock South lithium brine project in Nevada, located just 72 miles north of the Tesla Gigafactory. The company also has a highly prospective portfolio of projects in British Columbia and Quebec, Canada.

The Incahuasi Salar Project, which is easily accessible by road, is located in the province of Salta in northwestern Argentina, and it supports conditions for quality lithium mines at depth. The region has been substantially explored and it has been found that the lithium brines are close to the surface. The following picture from the company’s website gives some general information about the project.

The following excerpt, also from the company website, sets out some highlights of the project.

This photo shows drilling in progress at the Incahuasi Salar.

Turning now to the company’s other projects, which are all in the exploration stage, we will start by looking briefly at the prospective Black Rock South property in Nevada.

This picture shows the location of the project in NW Nevada and its proximity to the Tesla Gigafactory, an obvious large nearby market for the lithium extracted by the company.

At the Black Rock South property, the recent mineral exploration on the Galt claim group under option to Surge Battery Metals Inc. (NILIF:OTCMKTS;NILI:TSX-V) located 11 Miles to the South includes 51 playa sediment samples collected for chemical analysis at ALS Geochemistry in Vancouver, B.C.

Results of aqua regia leaching of the samples show 68 to 852 parts per million lithium (mean 365 ppm), 5.3 to 201 ppm cesium (mean 72 ppm) and 35 to 377 ppm rubidium (mean 180 ppm). Results from two seven-foot-deep auger holes show lithium, cesium, and rubidium concentrations in the range of 143.5 to 773 ppm Li, 56.8 to 102.5 ppm Cs and 155 to 272 Rb.

The entire San Emidio Desert basin is a highly prospective lithium exploration zone and is about 38 km long and up to 11 km wide at the widest point, with the central playa measuring about 8.5 km north-south and 4.5 km east-west.

A proposed four-hole drill program at the Galt project is pending permitting approval. It is designed to test a tight grouping of highly anomalous surface sediment sampling locations, which returned assay values with a high of 312 ppm lithium and a mean value of 215 ppm lithium.

The following photo gives an idea of the terrain at Black Rock South.

With respect to the company’s Quebec Project, this excerpt from the company website gives some details about it.

Lastly the company’s La Isla property in British Columbia is not lithium but gold with some copper and this excerpt from the company website gives some details about it. Note that this description continues on and the balance of it can be read on the relevant page on the website, the important closing sentence of which reads.

“Results to date from the Isla property demonstrate strong potential for gold and copper bearing mineralization that warrants further geological, geochemical, and geophysical exploration.”

Now we will examine the latest stock chart for the company to see what it portends and we will use a 9-month chart which shows the entire history of the stock from its inception on this market.

As we can see, the stock was “dormant” from September through late February, marking out a low base with almost no trading. Hence the “fly specked” appearance of the chart up to that point, but in March, it suddenly came to life, blasting higher on strong volume to double in price in a matter of a few days. However, since that early March surge, it has meandered around in a rather erratic manner, dropping back hard during the second half of April and early May to successfully test the support shown at the breakout point.

Whilst some might interpret the erratic pattern from the early March surge to be some kind of top area, this is not thought to be the case at all. In the first place, the high volume breakout that we saw in early March has strong bullish implications and should mark the start of a major bull market.

Secondly, the recurrent heavy upside volume since early March is also bullish, especially as it has driven both volume indicators, the Accumulation line and the On-balance Volume line (not shown), to stage breakouts to clear new highs on the high volume advance late in May and early this month. This is a powerful indication that the stock is destined to break out above the resistance to clear new highs soon despite the dip of the past week or so, and with respect to this, we should recall that lithium itself is looking set to break out into a new bull market soon as we saw above.

Last, and certainly not least, there was big news out this morning (June 17) that AMERICAN SALARS ACQUIRES POCITOS LITHIUM SALAR PROJECT WITH INFERRED LITHIUM CARBONATE MINERAL RESOURCEThis is clearly a major positive development for the company because this project has an NI 43-101 Mineral Resource Estimate (“MRE”) prepared in December 2023, consisting of an inferred 760,000-tonne lithium carbonate equivalent (“LCE”).

The conclusion is that American Salars is on course to break out to new highs soon, so anyone holding should stay long, and it is rated a Strong Buy here. Upon breaking out to new highs, a likely initial target for the upleg that follows is the CA$0.60 area.

American Salars’ website.

American Salars Lithium Inc. (USLI:CSE) closed for trading at CA$0.33 on June 14, 2024.


Important Disclosures:

  1. American Salars Lithium Inc. has a consulting relationship with an affiliate of Streetwise Reports, and pays a monthly consulting fee between US$8,000 and US$20,000. For this article, the Company has paid Street Smart, an affiliate of Streetwise Reports, US$1,500 in addition to the monthly consulting fee.
  2. As of the date of this article, officers and/or employees of Streetwise Reports LLC (including members of their household) own securities of American Salars Lithium Inc.
  3. Author Certification and Compensation: [Clive Maund of clivemaund.com] was retained and compensated as an independent contractor by Street Smart to write this article. Mr. Maund is a technical analyst who analyzes historical trading data and he received his UK Technical Analysts’ Diploma in 1989.  The recommendations and opinions expressed in this content reflect the personal, independent, and objective views of the author regarding any and all of the companies discussed. No part of the compensation received by the author was, is, or will be directly or indirectly tied to the specific recommendations or views expressed.
  4. Statements and opinions expressed are the opinions of the author and not of Streetwise Reports, Street Smart, or their officers. The author is wholly responsible for the accuracy of the statements. Streetwise Reports requires contributing authors to disclose any shareholdings in, or economic relationships with, companies that they write about. Any disclosures from the author can be found below. Streetwise Reports relies upon the authors to accurately provide this information and Streetwise Reports has no means of verifying its accuracy.
  5. This article does not constitute investment advice and is not a solicitation for any investment. Streetwise Reports does not render general or specific investment advice and the information on Streetwise Reports should not be considered a recommendation to buy or sell any security. Each reader is encouraged to consult with his or her personal financial adviser and perform their own comprehensive investment research. By opening this page, each reader accepts and agrees to Streetwise Reports’ terms of use and full legal disclaimer. Streetwise Reports does not endorse or recommend the business, products, services, or securities of any company.

For additional disclosures, please click here.

Clivemaund.com Disclosures

The above represents the opinion and analysis of Mr. Maund, based on data available to him, at the time of writing. Mr. Maund’s opinions are his own, and are not a recommendation or an offer to buy or sell securities. As trading and investing in any financial markets may involve serious risk of loss, Mr. Maund recommends that you consult with a qualified investment advisor, one licensed by appropriate regulatory agencies in your legal jurisdiction, and do your own due diligence and research when making any kind of a transaction with financial ramifications. Although a qualified and experienced stock market analyst, Clive Maund is not a Registered Securities Advisor. Therefore Mr. Maund’s opinions on the market and stocks cannot be construed as a recommendation or solicitation to buy and sell securities.

Trade of the Week: UK100 index set for 1,000 pip move?

By ForexTime 

  • This week set to be UK100’s 2nd most-volatile period so far in 2024
  • UK100 may even see a 1000-pip intraday move
  • Traders brace for BOE decision, UK economic data
  • UK100 still holding on to QTD gains, but 3.8% lower from ATH
  • Wall Street predicts 15% future gains over next 12 months


This week could see big price swings for the UK100 stock index.

Markets currently predict this week to be the 2nd most-volatile period so far this year for this benchmark stock index.

The year-to-date peak was back in April, when Iran launched its unprecedented attacks on Israel, which stoked risk-off sentiment across global financial markets.

NOTE: FXTM’s UK100 stock index tracks the benchmark FTSE 100 index.


What could move the UK100 this week?

Traders will be highly tuned in to these 3 major economic events in the UK:

1) Wednesday, June 19th: UK May consumer price index (CPI)

The consumer price index, which measures headline inflation, is a key piece of economic data which tells investors and traders when the UK central bank can start cutting interest rates.

Here’s what economists predict for this week’s CPI releases:

  • CPI May 2024 vs. April 2024 (month-on-month): 0.4%
    If so, that would be an uptick from April’s 0.3% month-on-month figure.
  • CPI May 2024 vs. May 2023 (year-on-year): 2.0%
    If so, that would be considerably lower than April’s 2.3% year-on-year figure.
  • CPI core (excluding prices of energy, food, alcohol, and tobacco) year-on-year: 3.5%
    If so, that would be considerably lower than April’s 3.9% year-on-year figure.

As the CPI trends lower to the central bank’s 2% target, that increases the likelihood of a BOE rate cut.

In addition to the above, markets will also be shown the latest inflation rates on services, housing costs, retail prices, and producer prices.


POTENTIAL SCENARIOS:

  • UK100 index may push higher: if UK inflation does moderate lower towards the BOE’s 2% target, perhaps paving the way for a UK rate cut.
  • UK100 index may be dragged lower: if UK inflation proves higher-than-expected, taking its own sweet time in moderating towards the BOE’s 2% target, in turn delaying UK rate cuts.

Over the past 12 months, the UK CPI have triggered upside moves as much as 1.3%, or as much as 0.56% declines, in the 6 hours after the data release.


2) Thursday, June 20th: Bank of England (BOE) rate decision

To be clear, the BOE is not expected to lower its bank rate this week from its current 5.25% level.

If it does, that could be a major shocker for the UK100 index!

  • The odds for a rate cut on August 1st is down to a coin toss (47% chance).
  • Meanwhile, there’s an 84% chance currently given for a mid-September rate cut.


With those expectations in mind, investors and traders worldwide will be scouring for clues as to what the BOE might say about the timing of its eventual rate cut.

POTENTIAL SCENARIOS:

  • UK100 index may push higher: if the BOE signals that its rate cut might happen sooner (August?) rather than later (September?)
  • UK100 index may be dragged lower: if the BOE pushes back on the idea of imminent rate cuts, saying that its bank rate has to stay at the 5.25% peak for longer to convincingly subdue UK inflation.

Over the past 12 months, BOE rate decisions have triggered upside moves as much as 1.1%, or as much as 0.5% declines, in the 6 hours after the data release.


3) Friday, June 21st: UK May retail sales, June purchasing managers indexes (PMIs)

Overall, these data points are expected to show that the UK economy is on a steadier footing:

  • UK retail sales fared better in May, both on a month-on-month as well as year-on-year basis, compared to April 2024.
  • The manufacturing, services, and composite PMIs are expected to hold above the 50 line, which denotes expanding conditions (as opposed to a sub-50 reading which points to contracting conditions for that sector).

POTENTIAL SCENARIOS:

  • UK100 index may push higher: if the UK retail sales and PMI data come in below market expectations, forcing the BOE to proceed with rate cuts sooner rather than later.
  • UK100 index may be dragged lower: if the UK economic data exceeds market expectations and forces the BOE to delay its rate cuts.

Over the past 12 months, the UK retail sales data releases have triggered upside moves as much as 1.4%, or as much as 1.2% declines, in the 6 hours after the data release.


Political turmoil to inject more UK100 volatility?

As the French political turmoil has amplified investor angst surrounding European stock indexes (EU50, FRA40, etc.), the UK100 index has been able to hold on to its quarter-to-date (QTD) gains so far:

  • NETH25: +4.4%
  • UK100: +2.3%
  • GER40: -2.6%
  • EU50: -4.5%
  • FRA40: -8.5%

The above performance has enabled the UK stock market to reclaim the title as Europe’s largest stock market from France.

However, fundamental investors also note that the UK elections are set for merely two weeks away, on July 4th.

The closer we get to polling day, the more influence UK politics could hold over this benchmark stock index.


How might UK100 fare over the long term?

Wall Street analysts predict another 15% potential upside (12,000 pips / 1,200 index points) from the UK100’s current levels over the next 12 months.

But first, the above-mentioned near-term events must first be overcome before potentially crossing above the 9,300 level by this time in 2025, assuming Wall Street’s forecasts prove true.


From a technical perspective …

At the time of writing, the UK100 is trading about 3.8% below its all-time high (ATH), using intraday prices, of 8486.4 set on May 15th.

However, the 8120 level has provided support in recent sessions, with prices not straying far from its 50-day simple moving average (SMA) over the past week.


POTENTIAL RESISTANCE

  • 50-day SMA:  immediate resistance
  • 8250: upper downtrend line
  • 21-day SMA

POTENTIAL SUPPORT:

  • 8120 area: crucial support from recent sessions.
  • 8100: downward lower trendline
  • 8020 area: support in late-April 2024

However, such a drastic decline (to 8020) would have to come by way of an aggressively hawkish BOE or a serious bout of risk-off sentiment across global financial markets.


Forex-Time-LogoArticle by ForexTime

ForexTime Ltd (FXTM) is an award winning international online forex broker regulated by CySEC 185/12 www.forextime.com