By InvestMacro
Here are the latest charts and statistics for the Commitment of Traders (COT) reports data published by the Commodities Futures Trading Commission (CFTC).
The latest COT data is updated through Tuesday April 7th and shows a quick view of how large traders (for-profit speculators and commercial entities) were positioned in the futures markets.
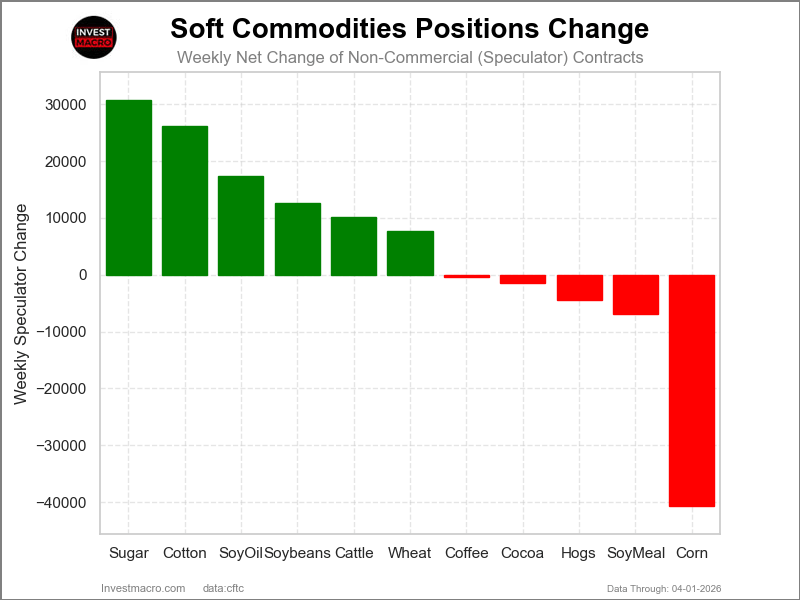
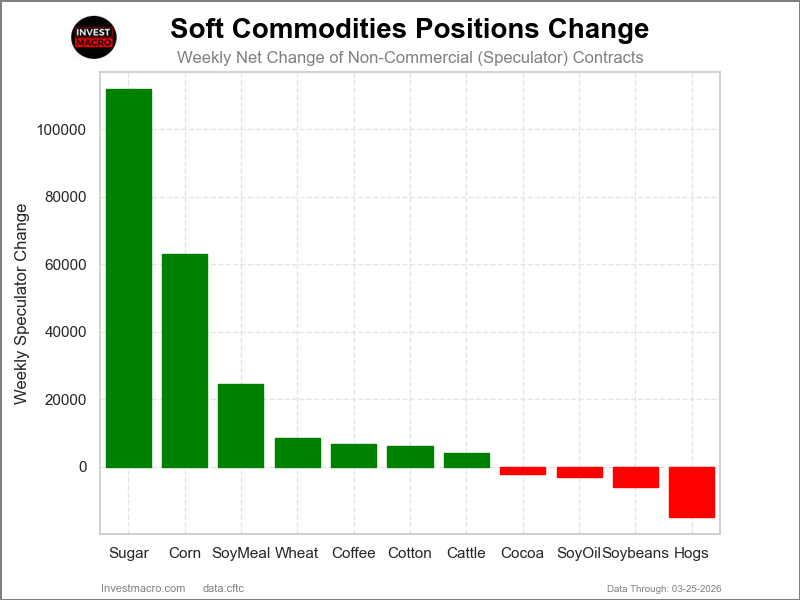
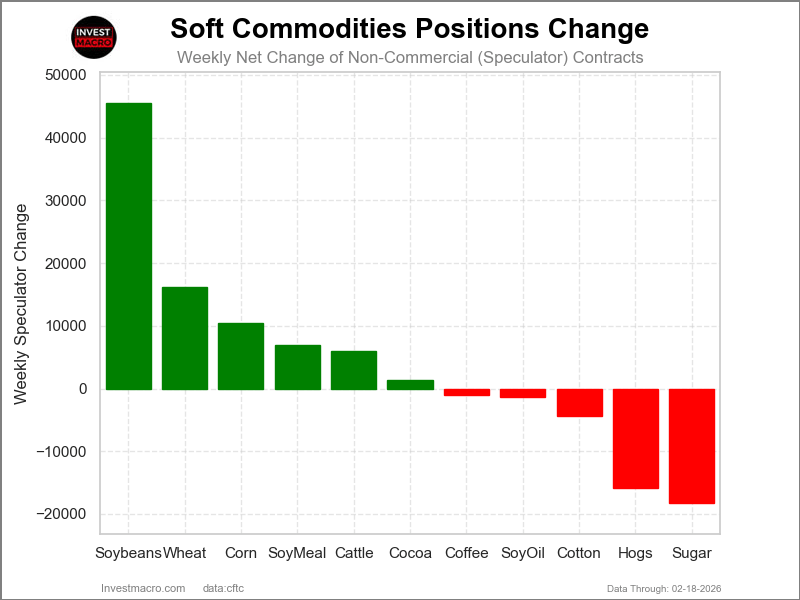
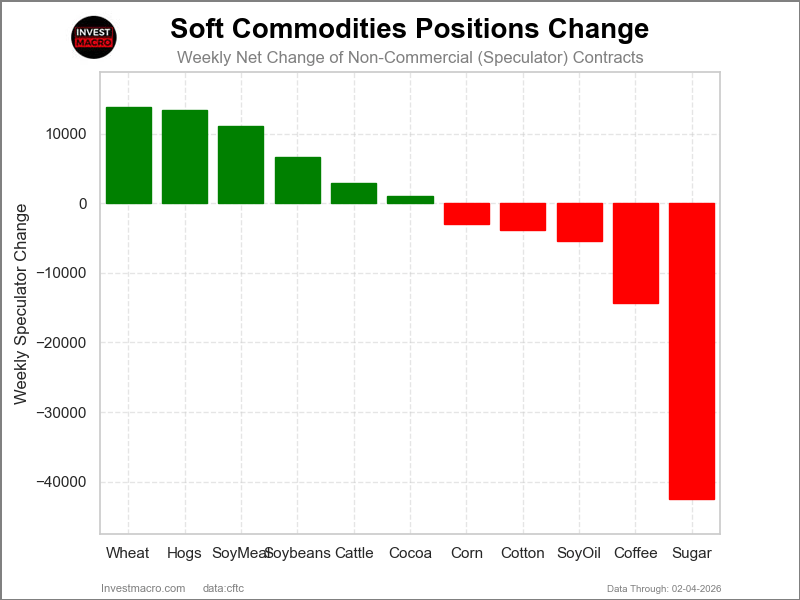
Weekly Speculator Changes led by Soybean Oil, Cotton & Live Cattle
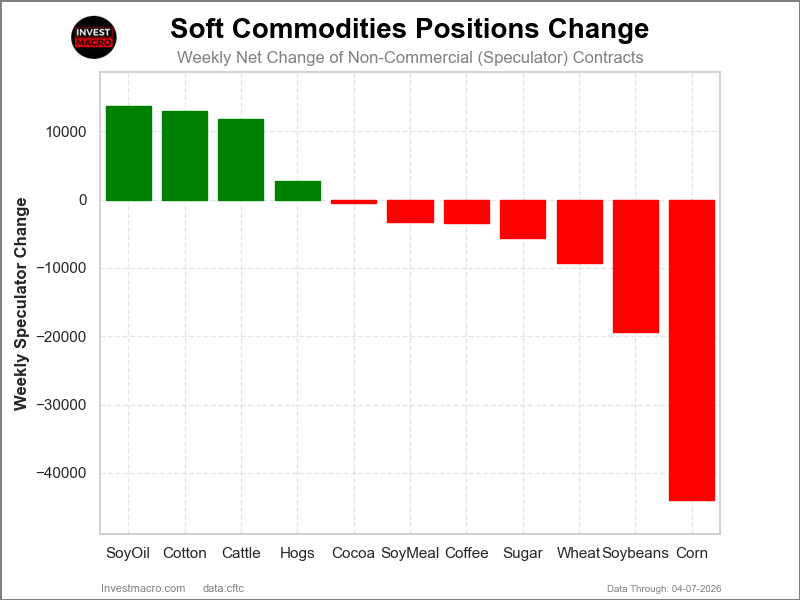
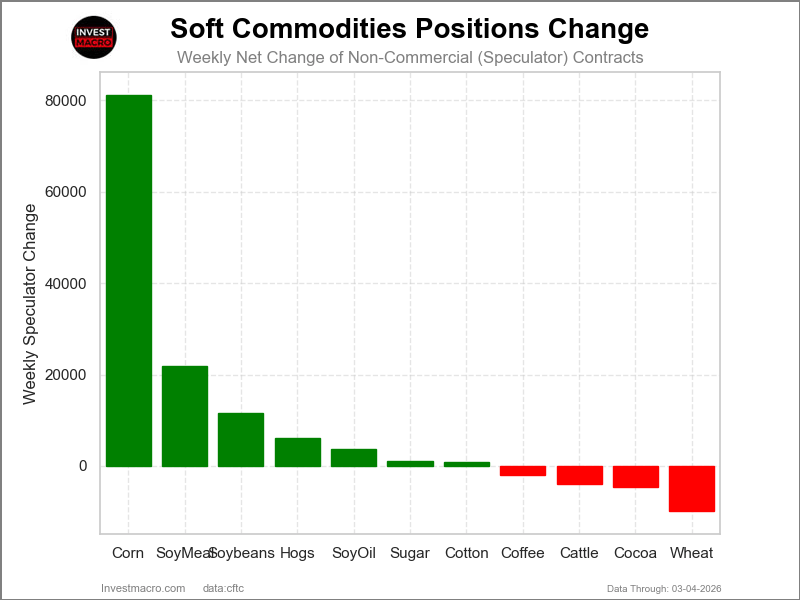
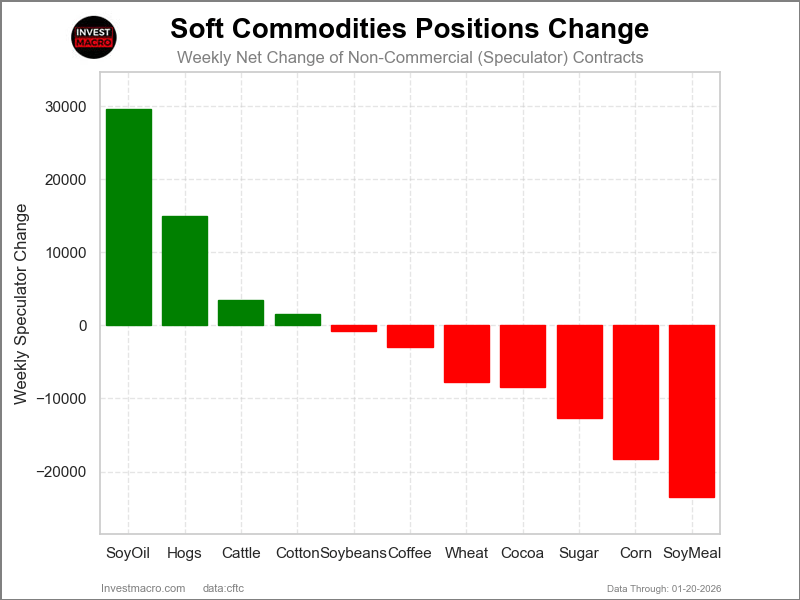
The COT soft commodities markets speculator bets were overall lower this week as just four out of the eleven softs markets we cover had higher positioning while the other seven markets had lower speculator contracts.
Leading the gains for the softs markets was Soybean Oil (13,685 contracts) with Cotton (12,970 contracts), Live Cattle (11,756 contracts) and Lean Hogs (2,750 contracts) also seeing positive weeks.
The markets with the declines in speculator bets this week were Corn (-43,938 contracts), Soybeans (-19,387 contracts), Wheat (-9,292 contracts), Sugar (-5,636 contracts), Soybean Meal (-3,330 contracts), Coffee (-3,349 contracts) and Cocoa (-471 contracts) also registering lower bets on the week.
Soybean Meal leads Soft Commodities price performance.
The price performance of Soft Commodities this week was led by Soybean Meal, which rose by roughly 5%, with a gain of 4.87% over the past five days. Cotton comes in next with a 3.30% gain, while Live Cattle rose by 2.85% on the week. Soybeans rounded out the leaders with a 1.38% rise.
On the downside, Cocoa was virtually unchanged on the week with a -0.09% decline, followed by Lean Hogs which fell by -0.72%. Next up, Corn was lower by -1.89% and was followed by Wheat which declined by -2.44%. Soybean Oil dipped by a similar -2.51%.
The biggest losers on the week were Coffee, which fell by -4.67%, and Sugar, which dropped by -8.27% over the past five days.
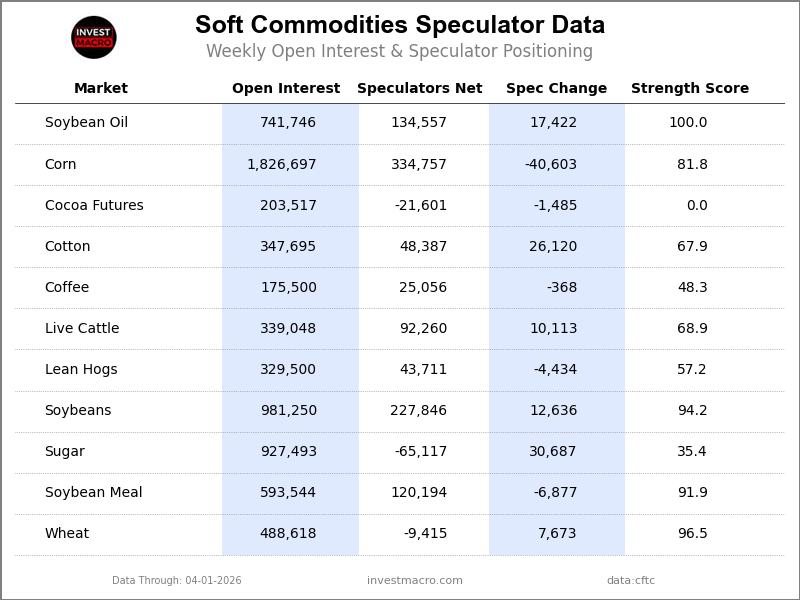
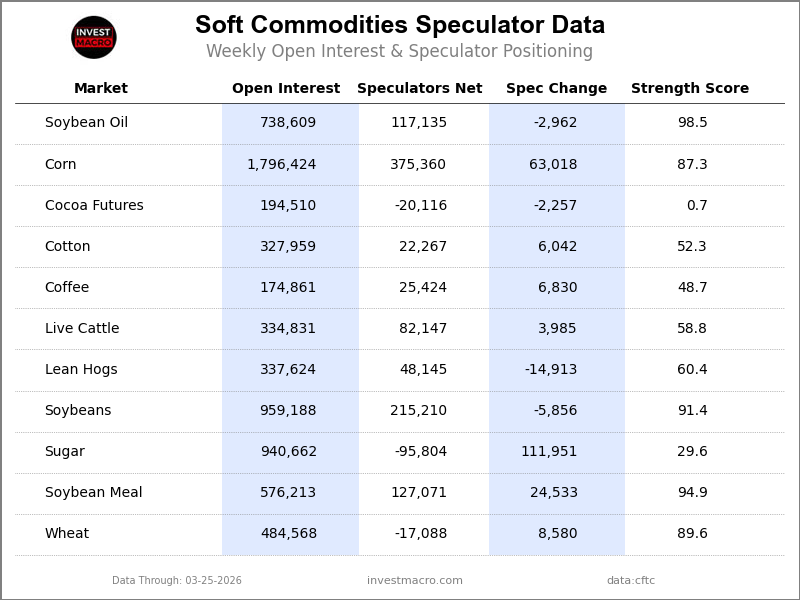
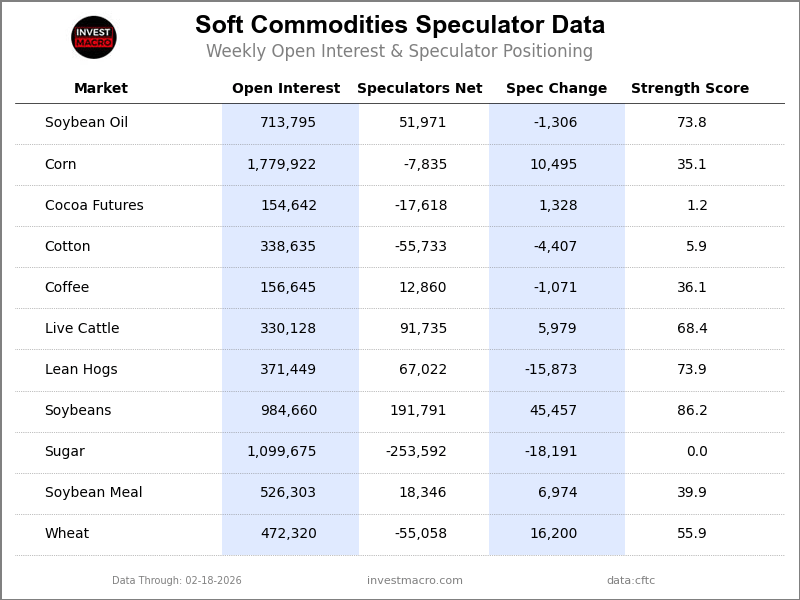
Soft Commodities Data:
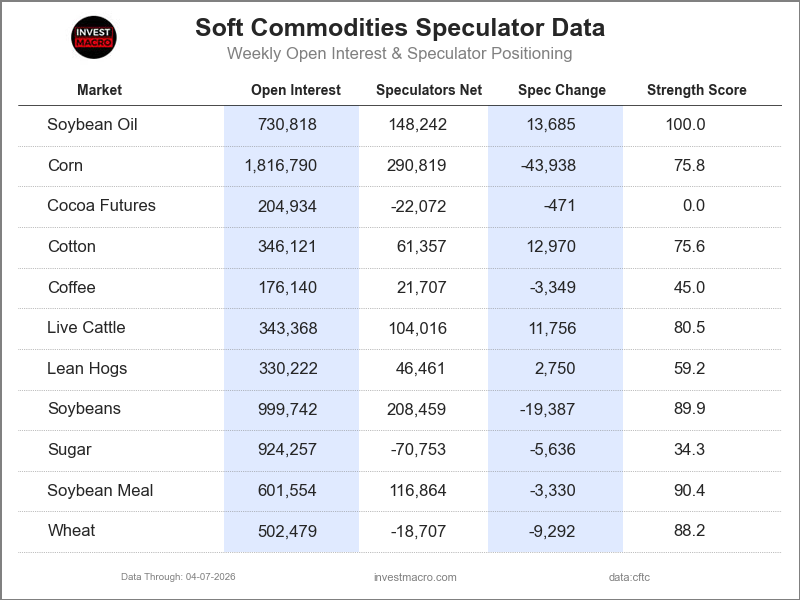
Legend: Weekly Speculators Change | Speculators Current Net Position | Speculators Strength Score compared to last 3-Years (0-100 range)
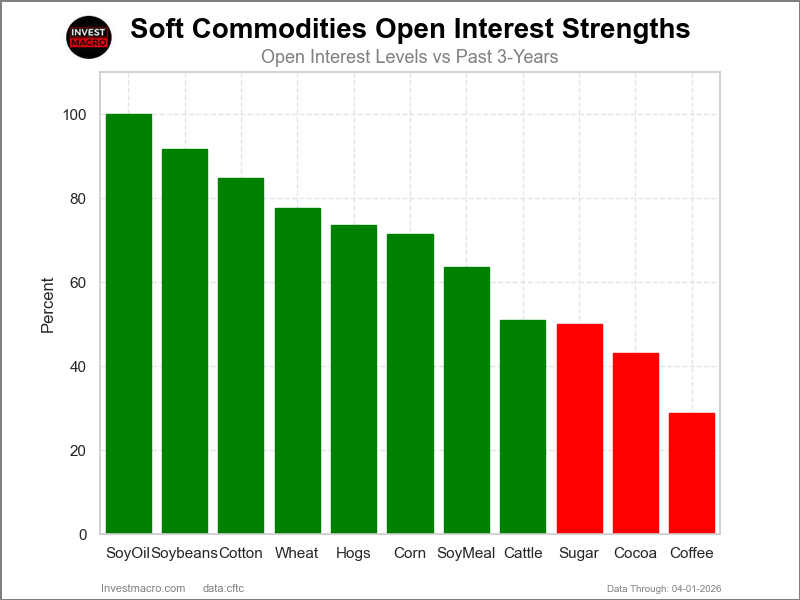
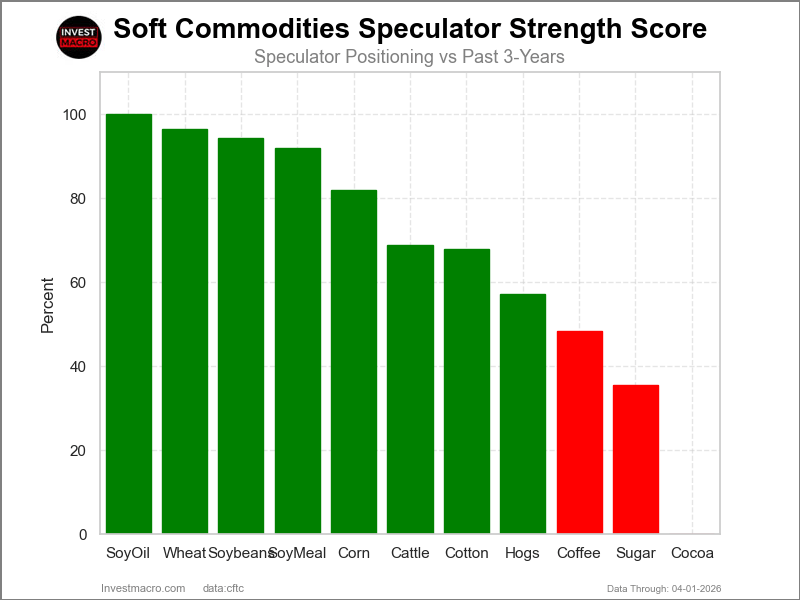
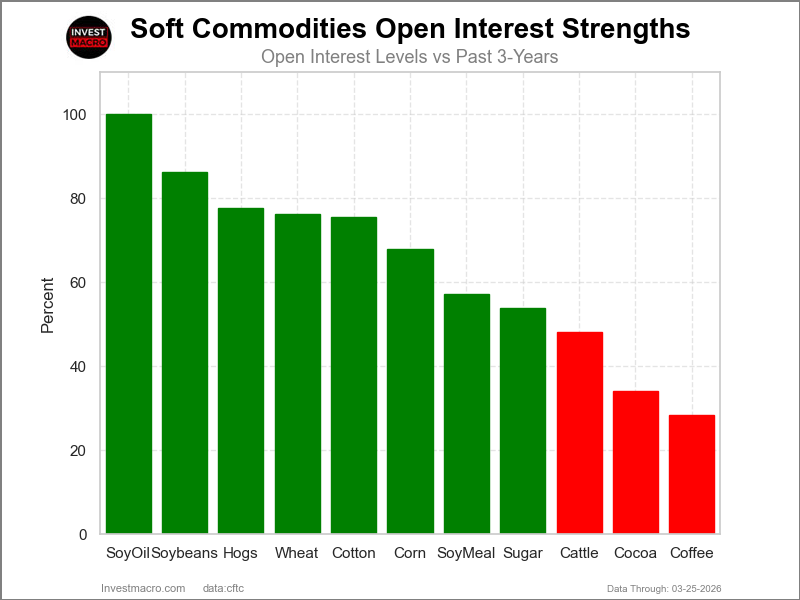
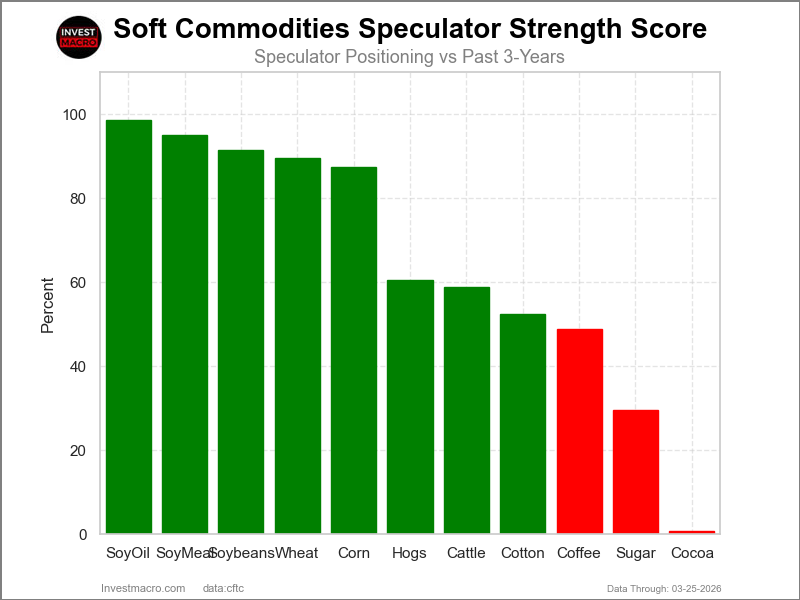
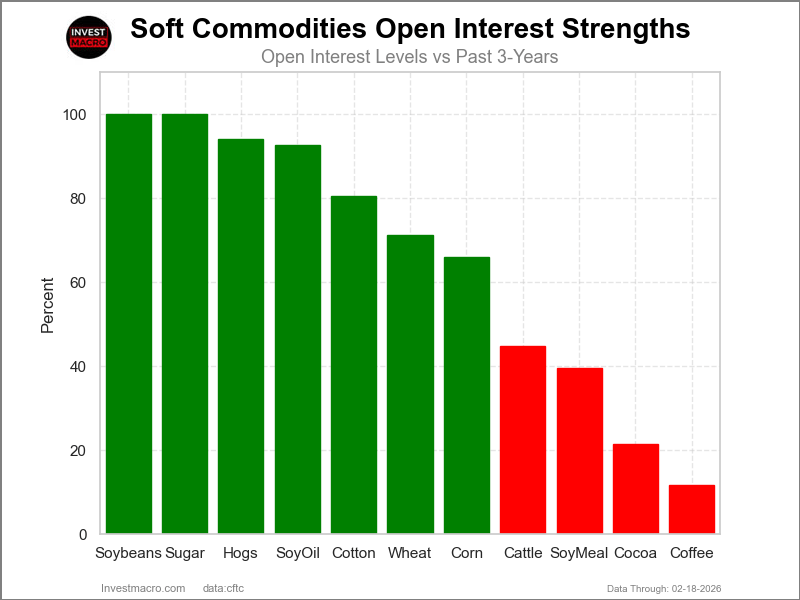
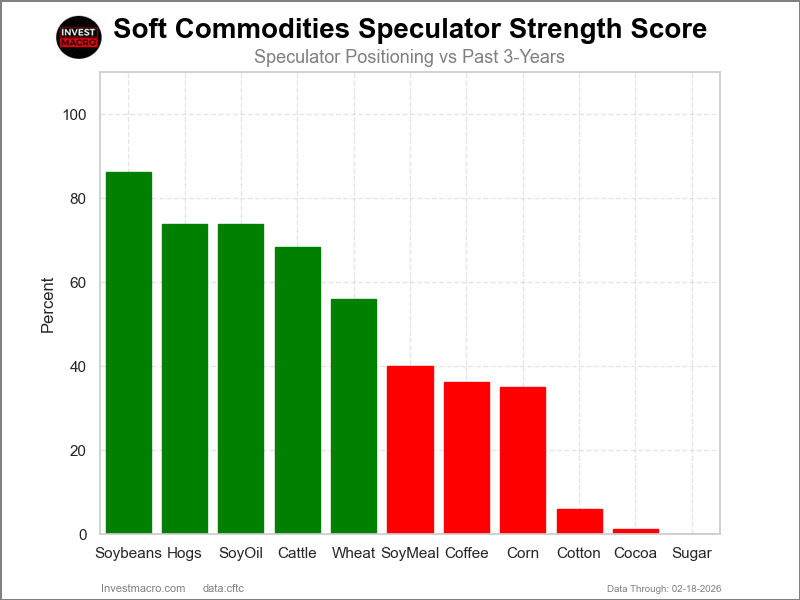
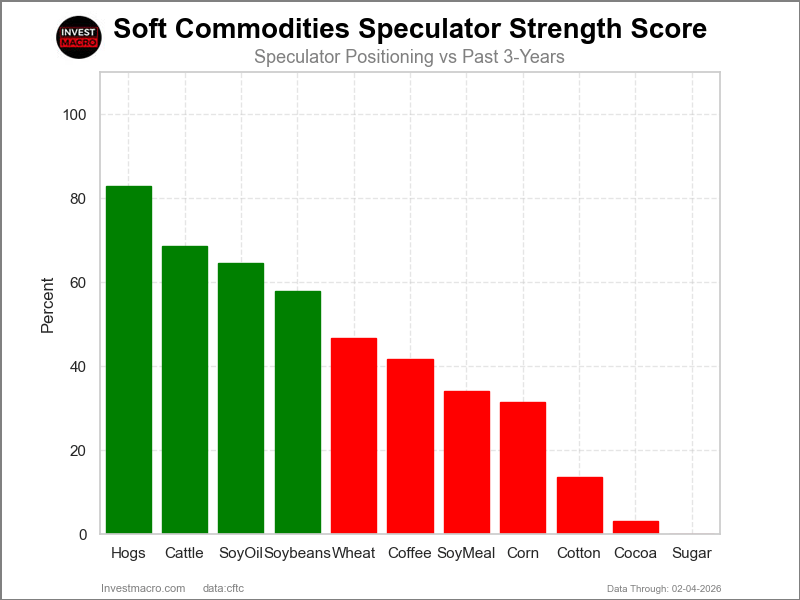
Strength Scores led by Soybean Oil, Soybeans & Soybean Meal

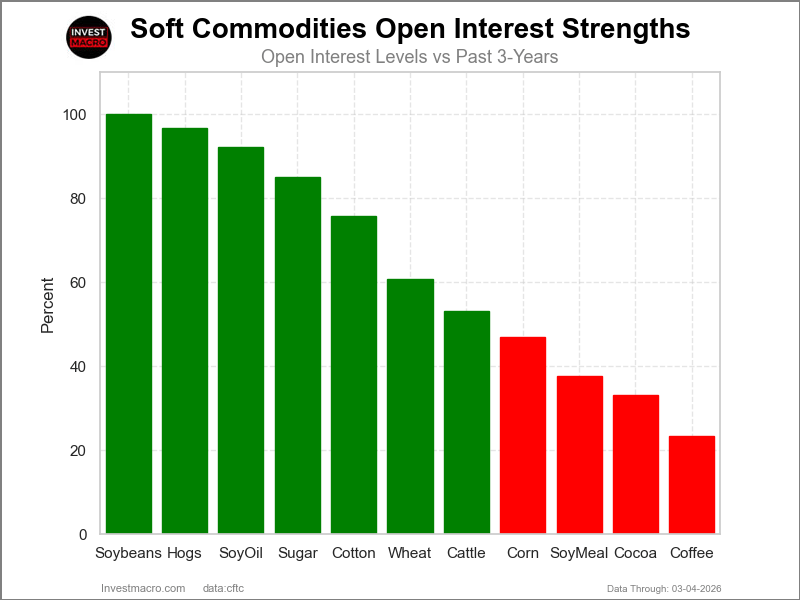
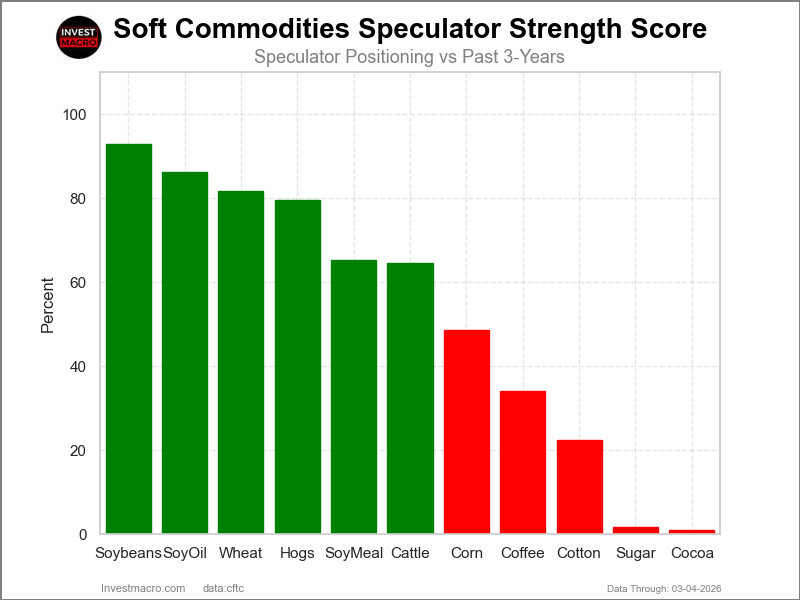
COT Strength Scores (a normalized measure of Speculator positions over a 3-Year range, from 0 to 100 where above 80 is Extreme-Bullish and below 20 is Extreme-Bearish) showed that Soybean Oil (100 percent), Soybean Meal (90 percent) and Soybeans (90 percent) lead the softs markets this week. Wheat (88 percent) and Live Cattle (81 percent) come in as the next highest in the weekly strength scores.
On the downside, Cocoa (0 percent) comes in at the lowest strength levels currently and is in Extreme-Bearish territory (below 20 percent). The next lowest strength scores are Sugar (34 percent) and Coffee (45 percent).
Strength Statistics:
Corn (75.8 percent) vs Corn previous week (81.8 percent)
Sugar (34.3 percent) vs Sugar previous week (35.4 percent)
Coffee (45.0 percent) vs Coffee previous week (48.3 percent)
Soybeans (89.9 percent) vs Soybeans previous week (94.2 percent)
Soybean Oil (100.0 percent) vs Soybean Oil previous week (93.9 percent)
Soybean Meal (90.4 percent) vs Soybean Meal previous week (91.9 percent)
Live Cattle (80.5 percent) vs Live Cattle previous week (68.9 percent)
Lean Hogs (59.2 percent) vs Lean Hogs previous week (57.2 percent)
Cotton (75.6 percent) vs Cotton previous week (67.9 percent)
Cocoa (0.0 percent) vs Cocoa previous week (0.4 percent)
Wheat (88.2 percent) vs Wheat previous week (96.5 percent)
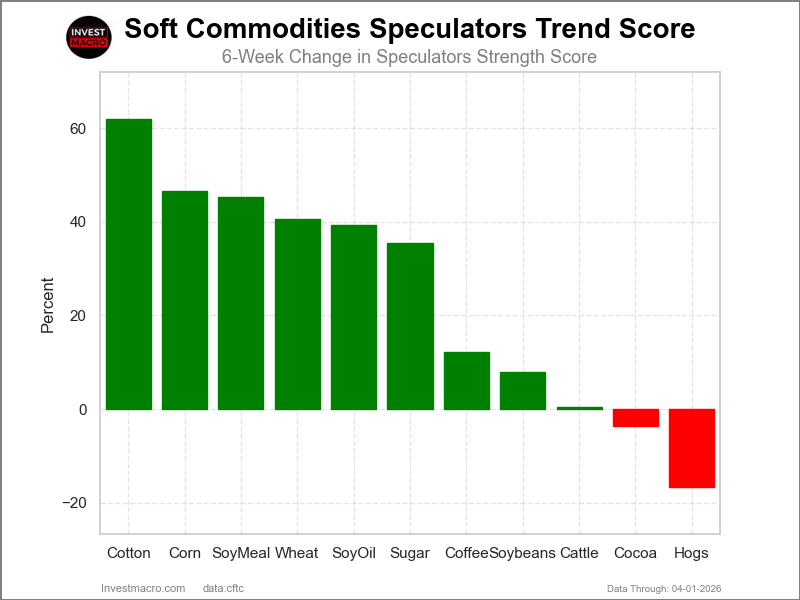
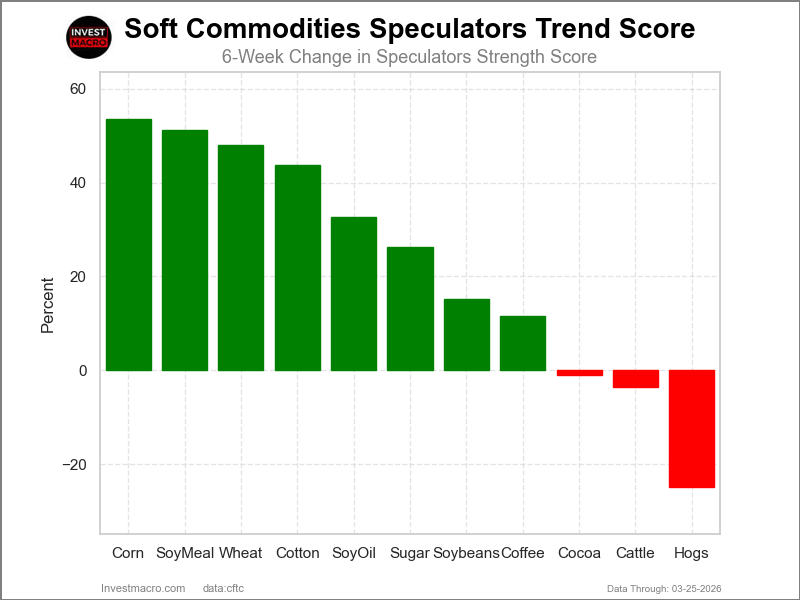
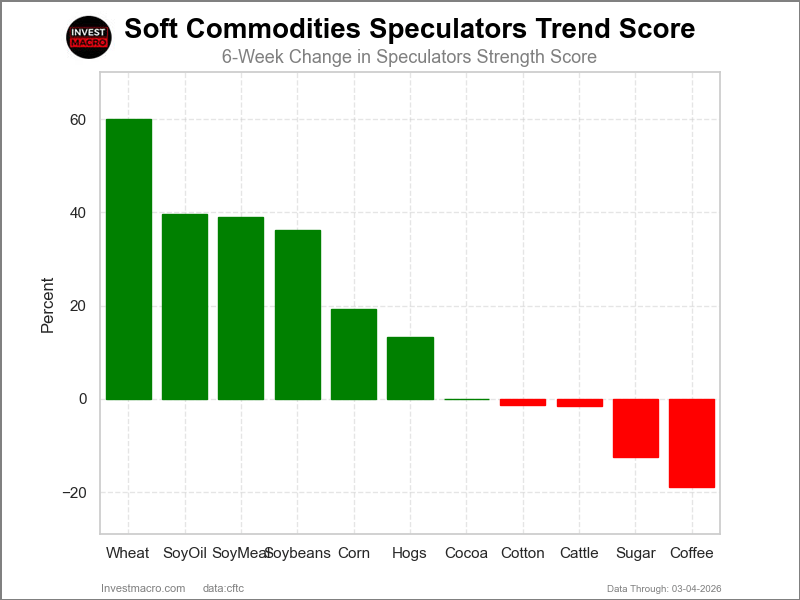
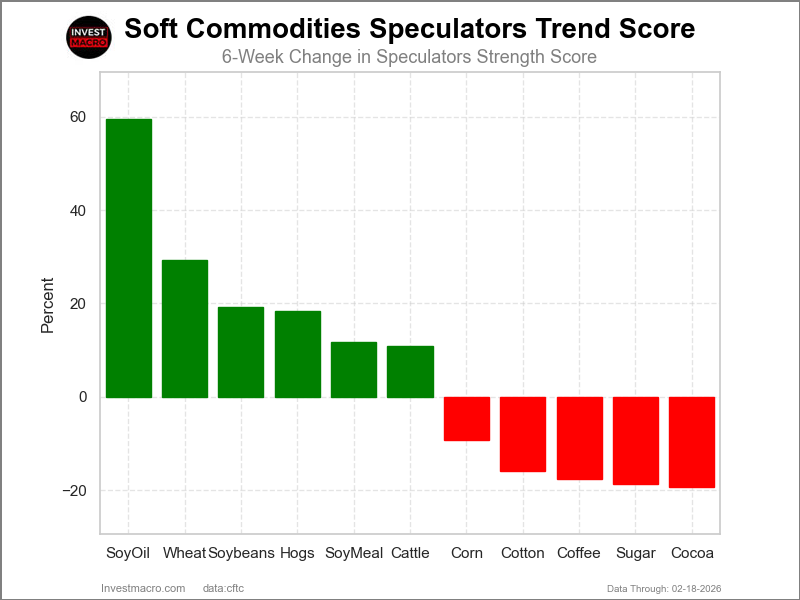
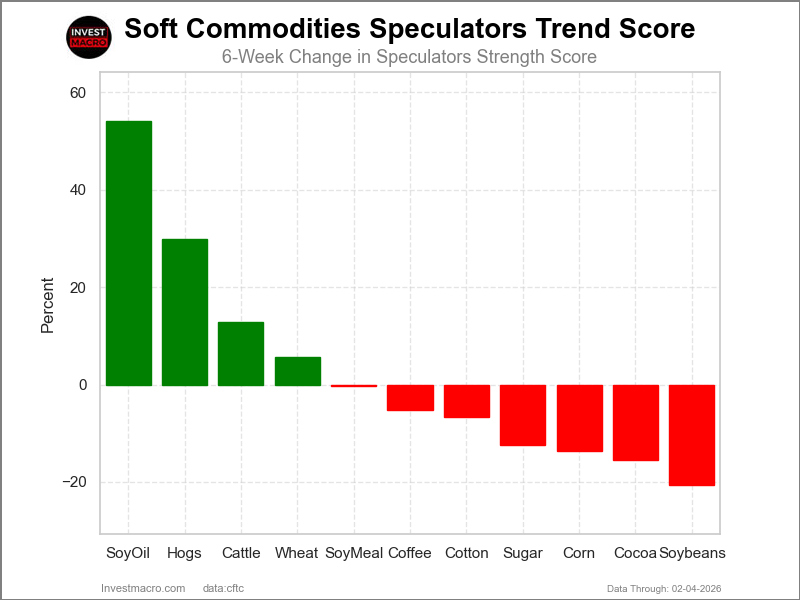
Cotton & Corn top the 6-Week Strength Trends

COT Strength Score Trends (or move index, calculates the 6-week changes in strength scores) showed that Cotton (54 percent) and Corn (38 percent) lead the past six weeks trends for soft commodities. Soybean Oil (35 percent), Sugar (33 percent) and Soybean Meal (29 percent) are the next highest positive movers in the latest trends data.
Lean Hogs (-16 percent) leads the downside trend scores currently with Cocoa (-8 percent) and Wheat (-2 percent) following next with lower trend scores.
Strength Trend Statistics:
Corn (38.4 percent) vs Corn previous week (46.6 percent)
Sugar (32.9 percent) vs Sugar previous week (35.4 percent)
Coffee (8.9 percent) vs Coffee previous week (12.2 percent)
Soybeans (-0.4 percent) vs Soybeans previous week (8.0 percent)
Soybean Oil (35.2 percent) vs Soybean Oil previous week (36.9 percent)
Soybean Meal (29.3 percent) vs Soybean Meal previous week (45.2 percent)
Live Cattle (12.2 percent) vs Live Cattle previous week (0.5 percent)
Lean Hogs (-16.1 percent) vs Lean Hogs previous week (-16.7 percent)
Cotton (53.8 percent) vs Cotton previous week (62.0 percent)
Cocoa (-8.0 percent) vs Cocoa previous week (-3.6 percent)
Wheat (-2.3 percent) vs Wheat previous week (40.5 percent)
Individual Soft Commodities Markets:
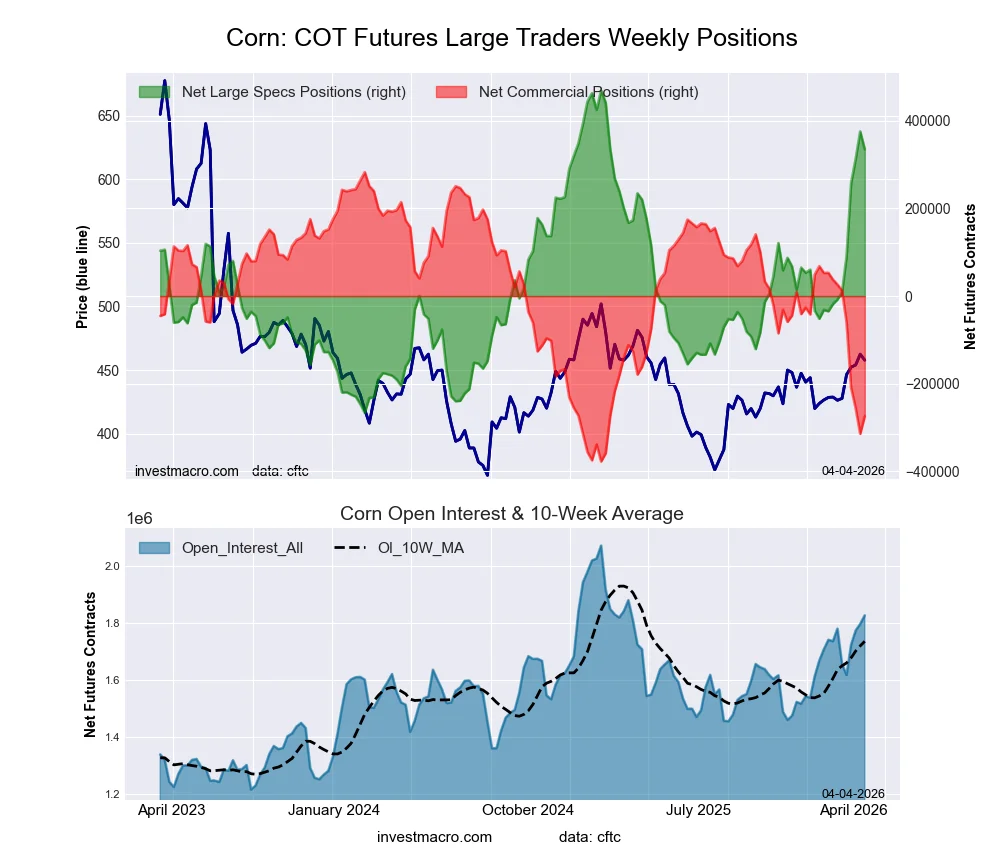
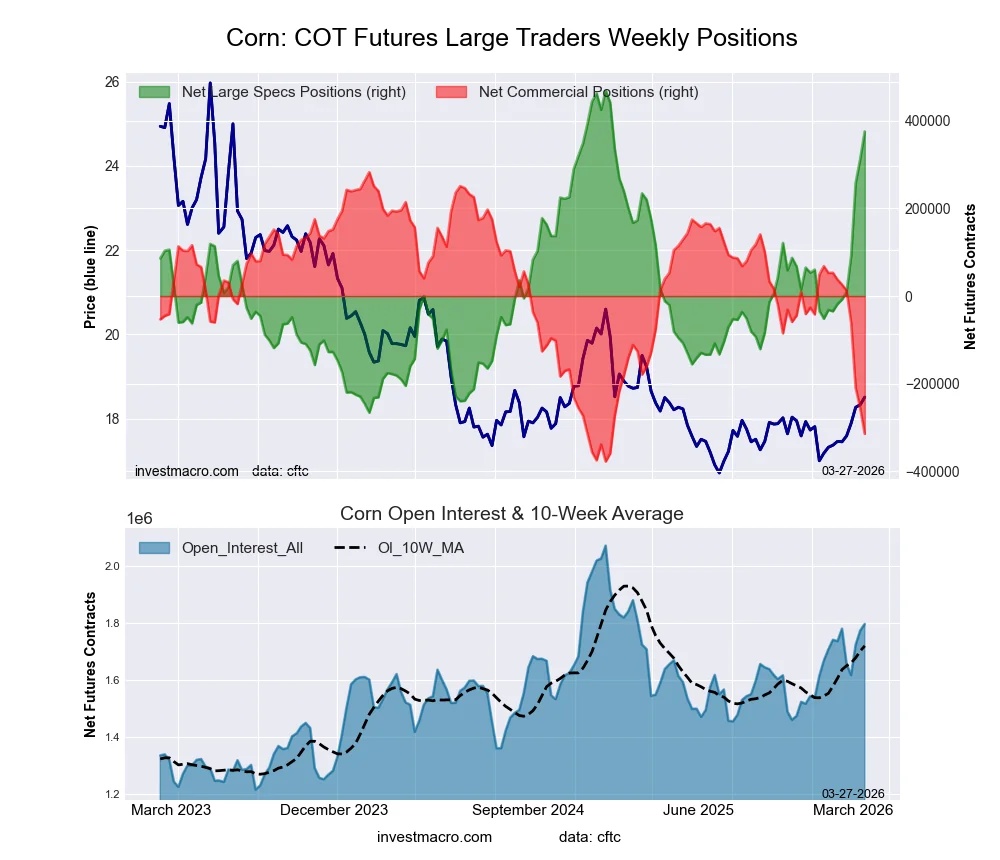
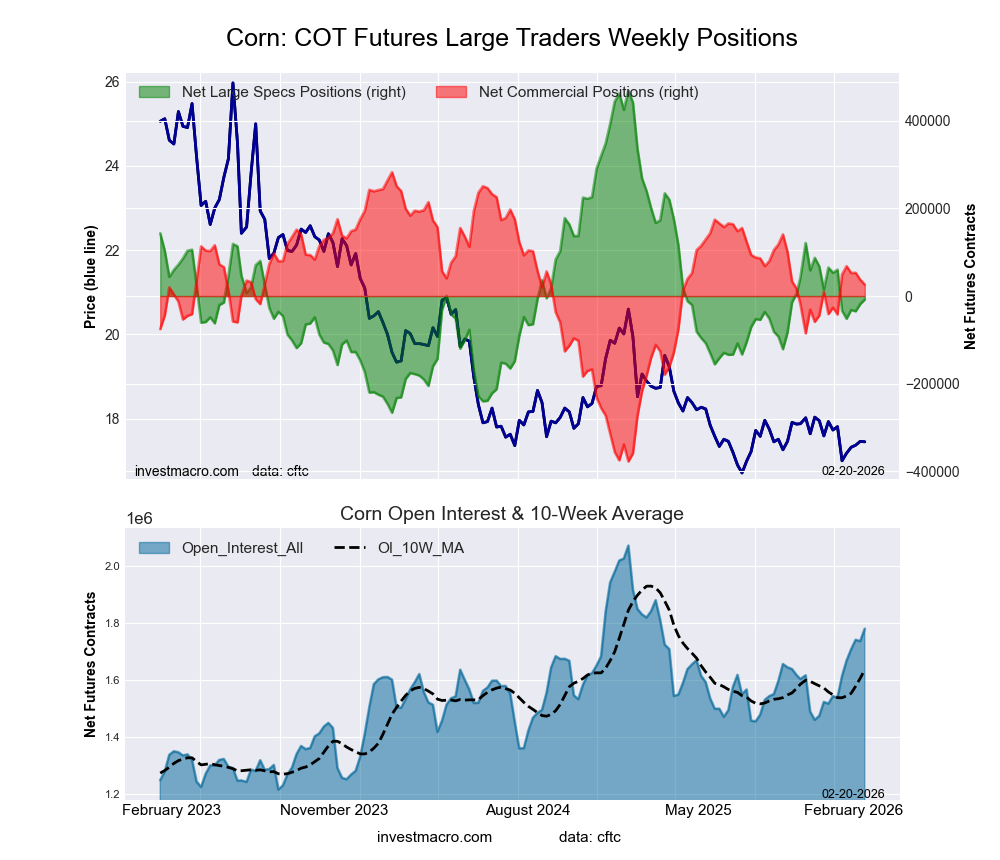
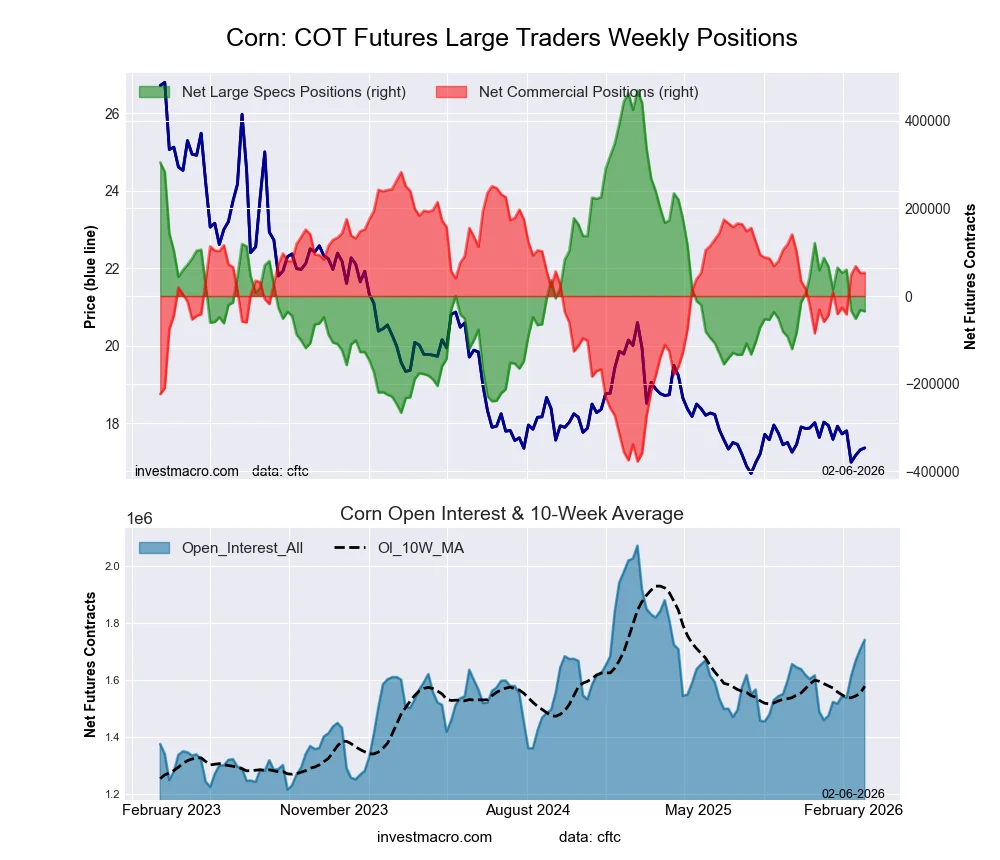
CORN Futures:
 Positioning Notes:
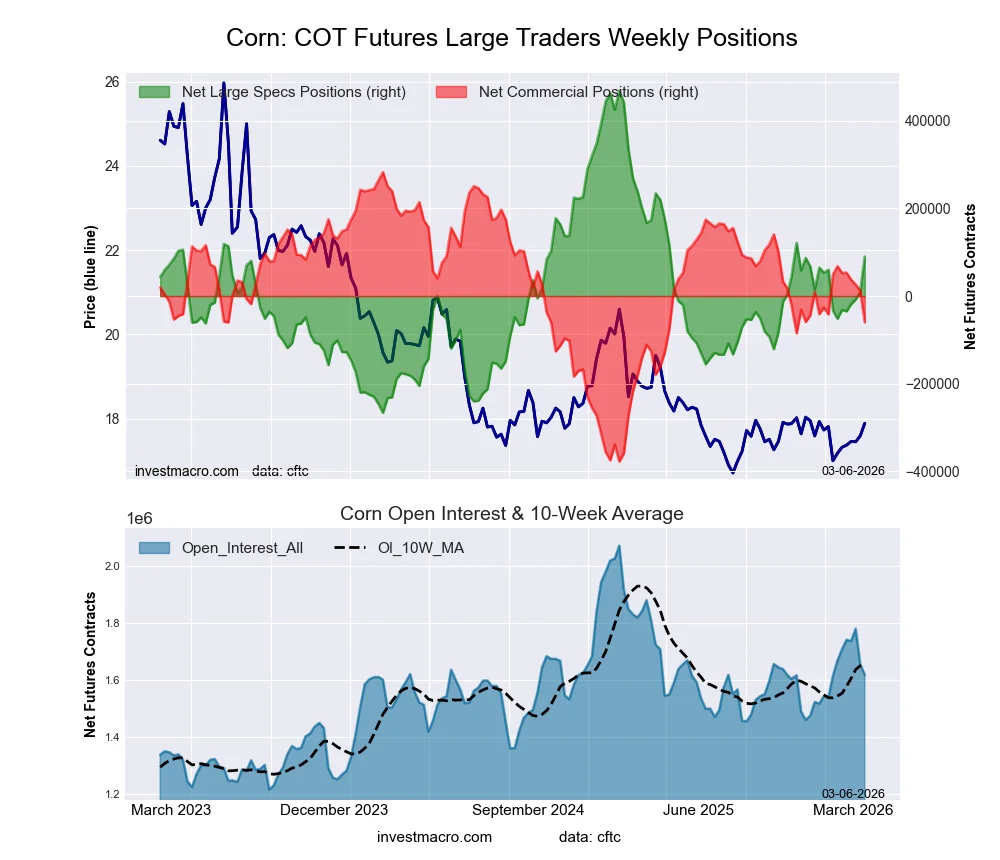
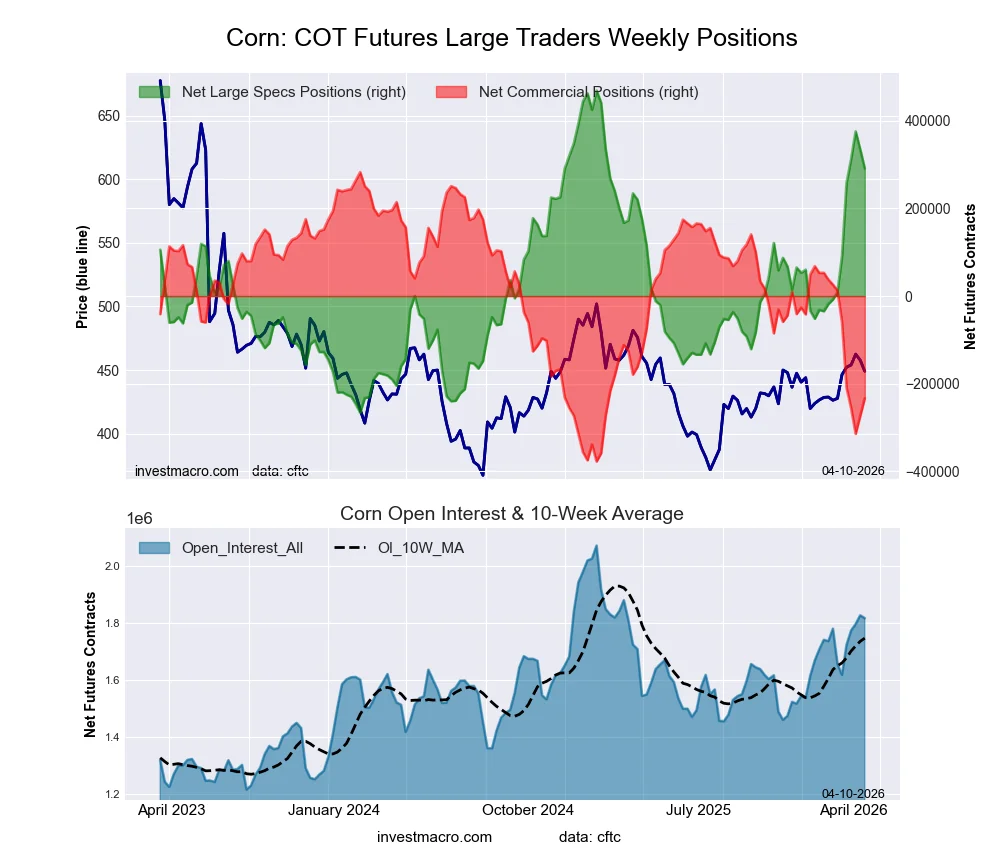
- CORN large speculator standing this week came in at a net position of 290,819 contracts in the data reported through Tuesday.
- Weekly Speculator position decline of -43,938 contracts from the previous week which had a total of 334,757 net contracts.
- This week’s current strength score (range over the past 3 years, measured from 0 to 100) shows the speculators are currently Bullish with a score of 75.8 percent.
- The Commercials are Bearish with a score of 21.9 percent.
- The Small Traders (not shown in chart) are Bearish with a score of 39.2 percent.
Price Trend-Following Model: Weak Uptrend
Our weekly trend-following model classifies the current market price position as: Weak Uptrend.
| CORN Futures Statistics | SPECULATORS | COMMERCIALS | SMALL TRADERS |
| – Percent of Open Interest Longs: | 25.3 | 40.5 | 7.6 |
| – Percent of Open Interest Shorts: | 9.3 | 53.3 | 10.8 |
| – Net Position: | 290,819 | -232,969 | -57,850 |
| – Gross Longs: | 459,961 | 735,945 | 138,149 |
| – Gross Shorts: | 169,142 | 968,914 | 195,999 |
| – Long to Short Ratio: | 2.7 to 1 | 0.8 to 1 | 0.7 to 1 |
| NET POSITION TREND: | |||
| – Strength Index Score (3 Year Range Pct): | 75.8 | 21.9 | 39.2 |
| – Strength Index Reading (3 Year Range): | Bullish | Bearish | Bearish |
| NET POSITION MOVEMENT INDEX: | |||
| – 6-Week Change in Strength Index: | 38.4 | -37.2 | -42.6 |
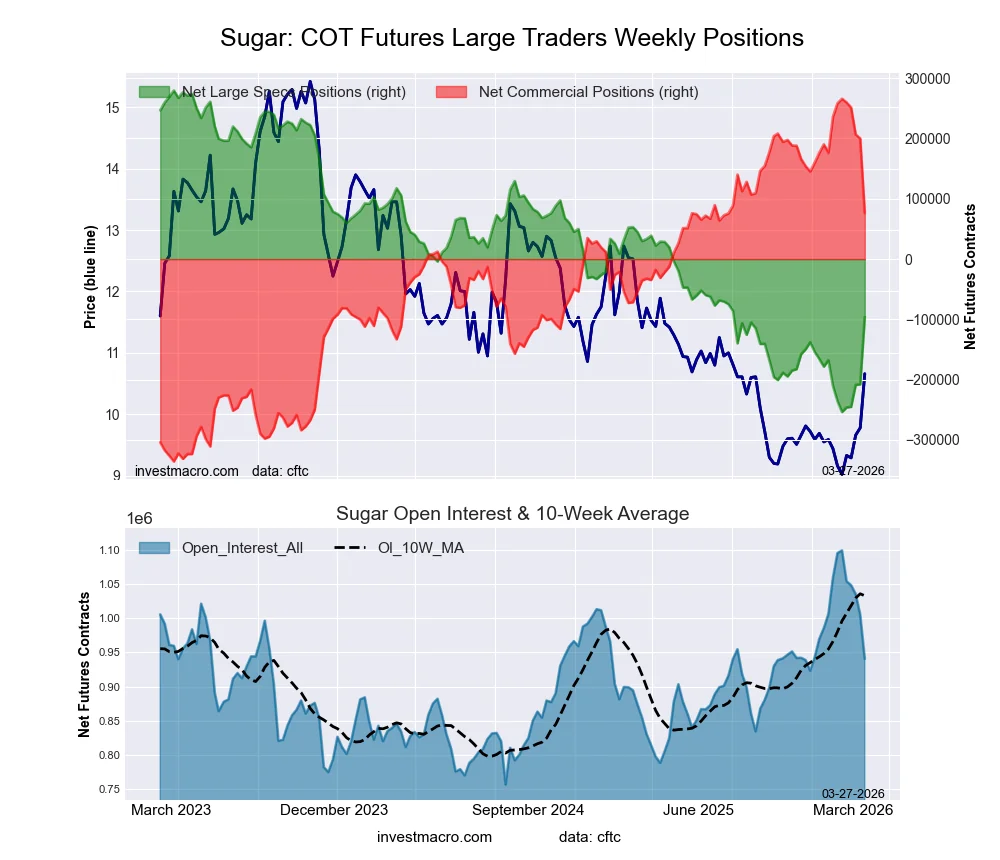
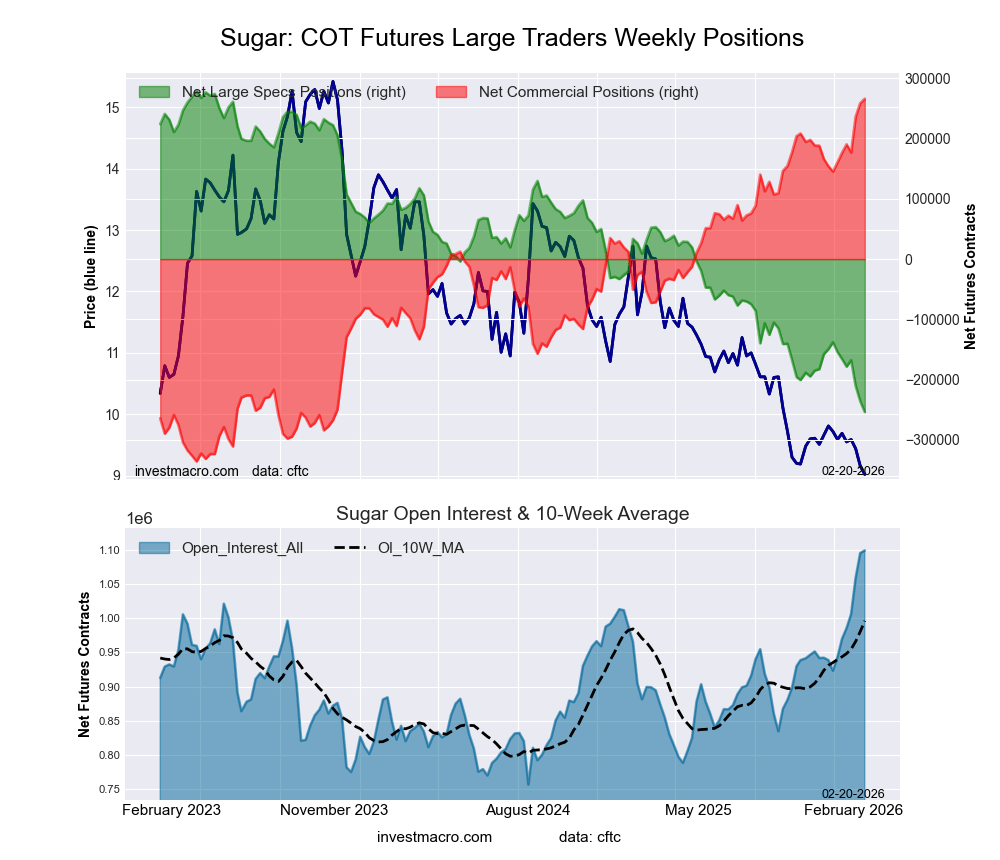
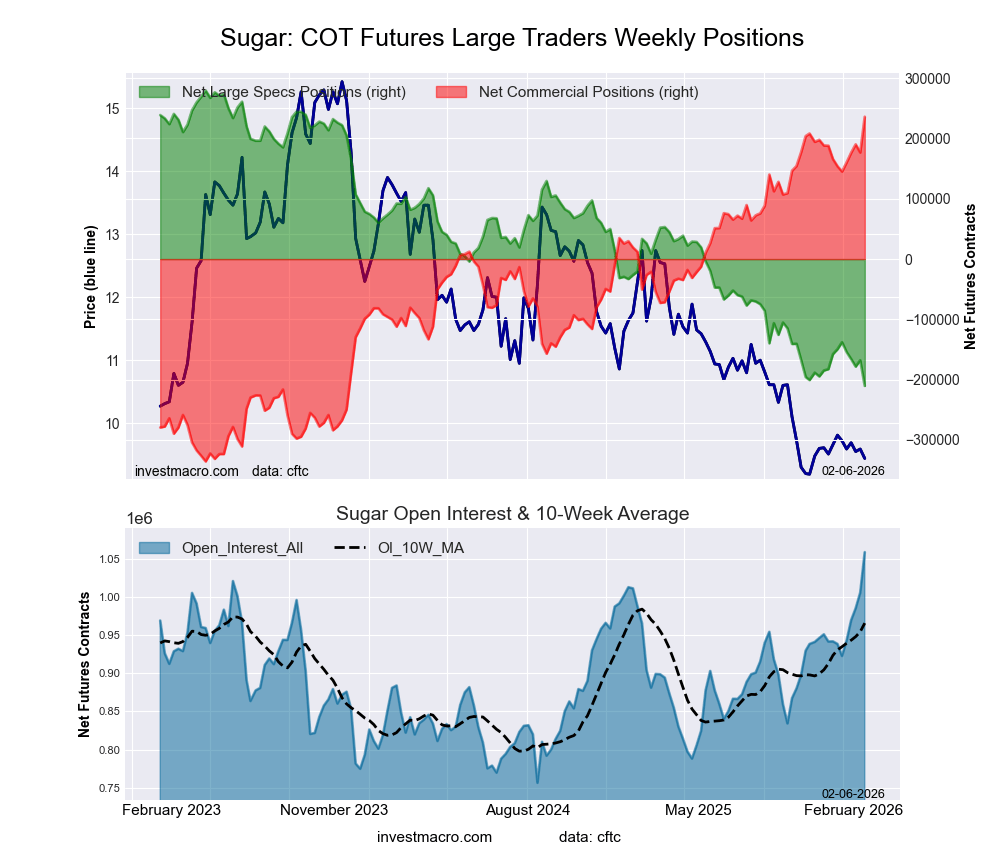
SUGAR Futures:
 Positioning Notes:
- SUGAR large speculator standing this week came in at a net position of -70,753 contracts in the data reported through Tuesday.
- Weekly Speculator position decrease of -5,636 contracts from the previous week which had a total of -65,117 net contracts.
- This week’s current strength score (range over the past 3 years, measured from 0 to 100) shows the speculators are currently Bearish with a score of 34.3 percent.
- The Commercials are Bullish with a score of 67.0 percent.
- The Small Traders (not shown in chart) are Bearish with a score of 35.3 percent.
Price Trend-Following Model: Strong Downtrend
Our weekly trend-following model classifies the current market price position as: Strong Downtrend.
| SUGAR Futures Statistics | SPECULATORS | COMMERCIALS | SMALL TRADERS |
| – Percent of Open Interest Longs: | 20.9 | 52.8 | 9.5 |
| – Percent of Open Interest Shorts: | 28.6 | 45.5 | 9.1 |
| – Net Position: | -70,753 | 67,254 | 3,499 |
| – Gross Longs: | 193,215 | 487,724 | 87,929 |
| – Gross Shorts: | 263,968 | 420,470 | 84,430 |
| – Long to Short Ratio: | 0.7 to 1 | 1.2 to 1 | 1.0 to 1 |
| NET POSITION TREND: | |||
| – Strength Index Score (3 Year Range Pct): | 34.3 | 67.0 | 35.3 |
| – Strength Index Reading (3 Year Range): | Bearish | Bullish | Bearish |
| NET POSITION MOVEMENT INDEX: | |||
| – 6-Week Change in Strength Index: | 32.9 | -32.0 | 20.7 |
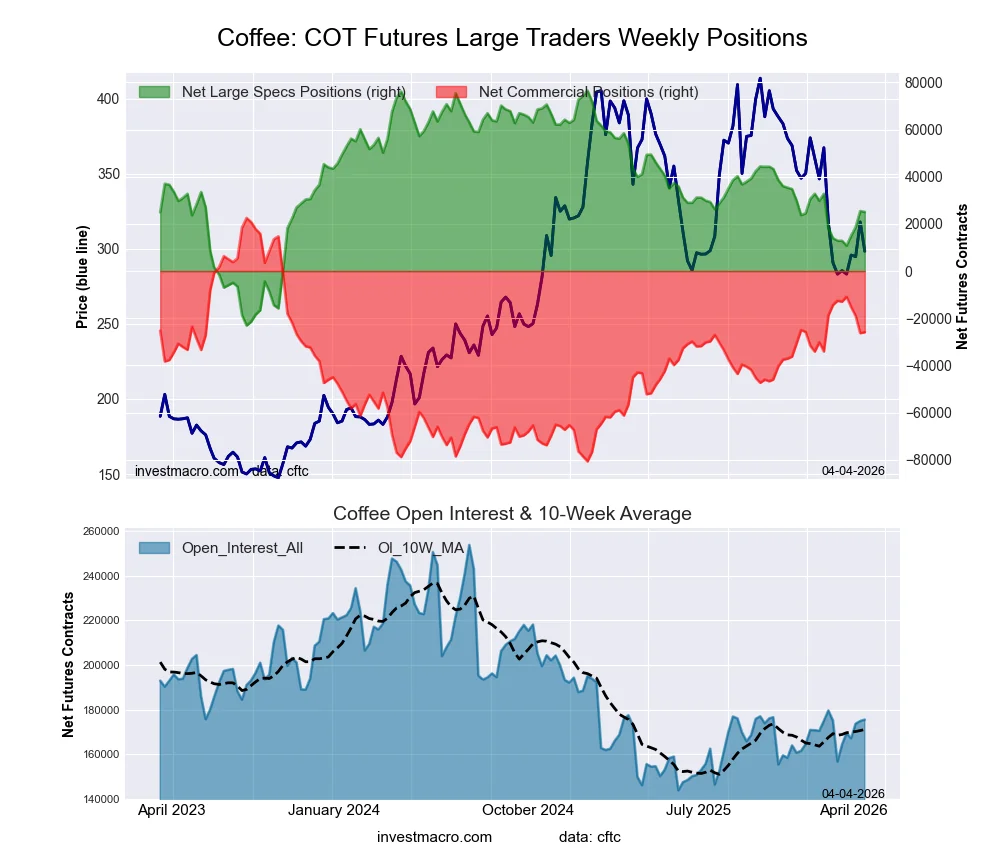
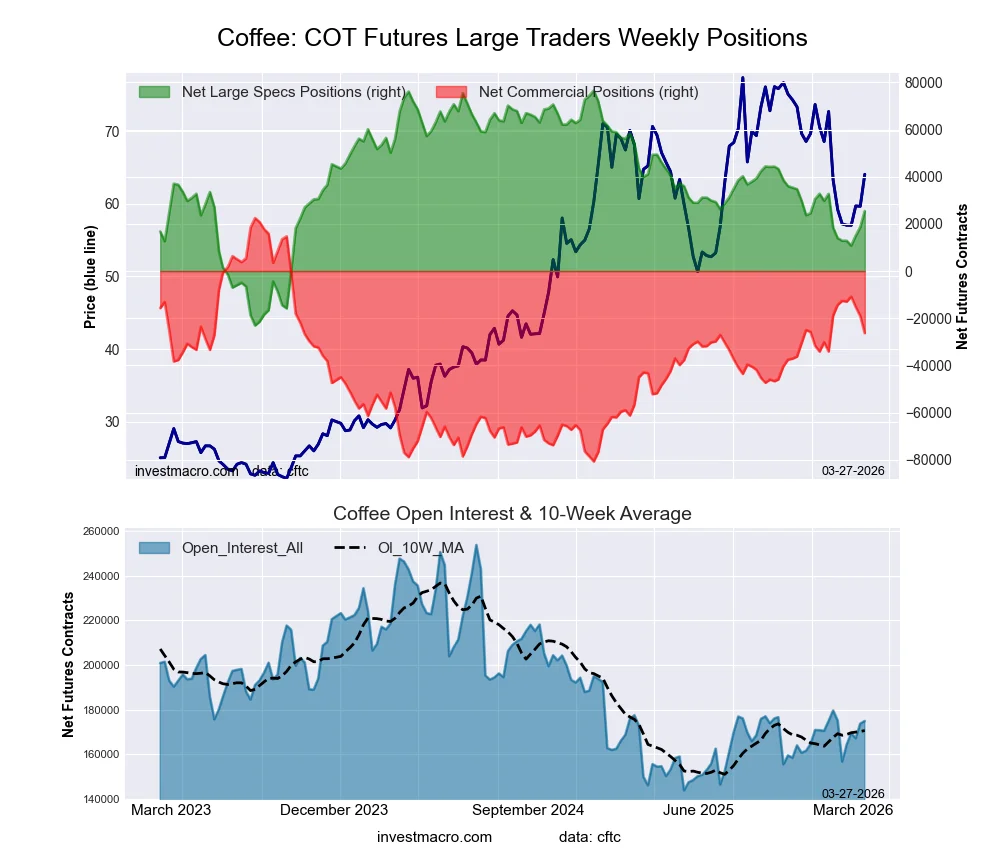
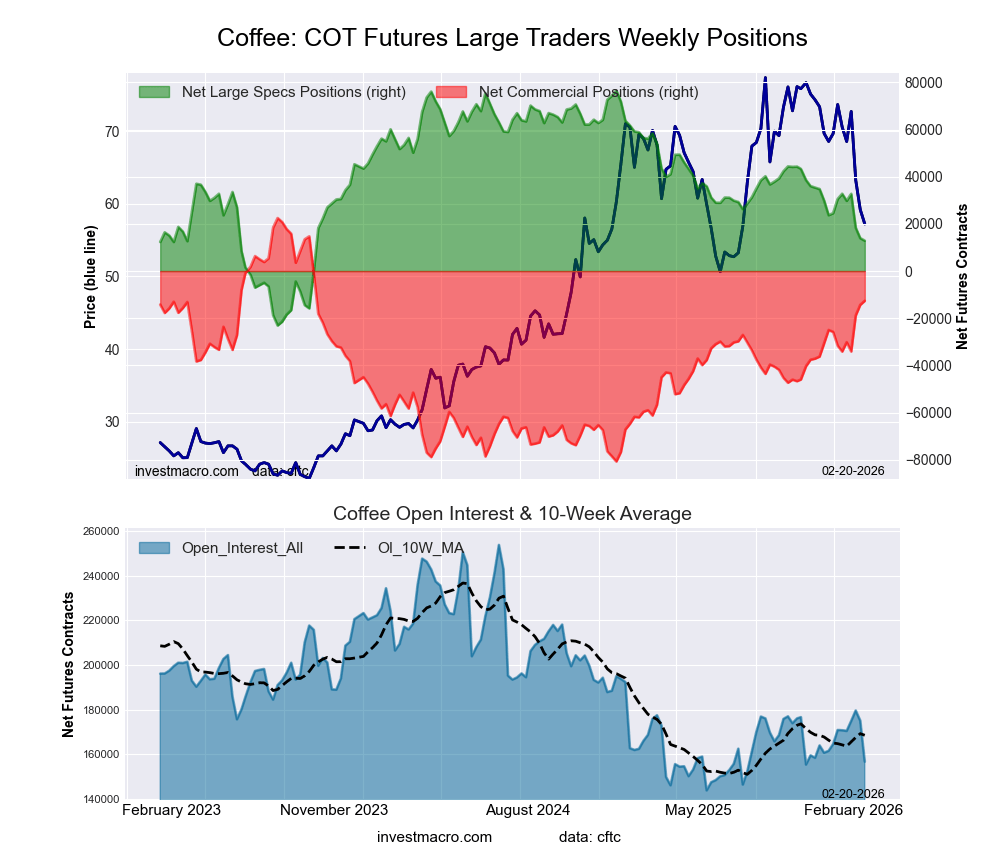
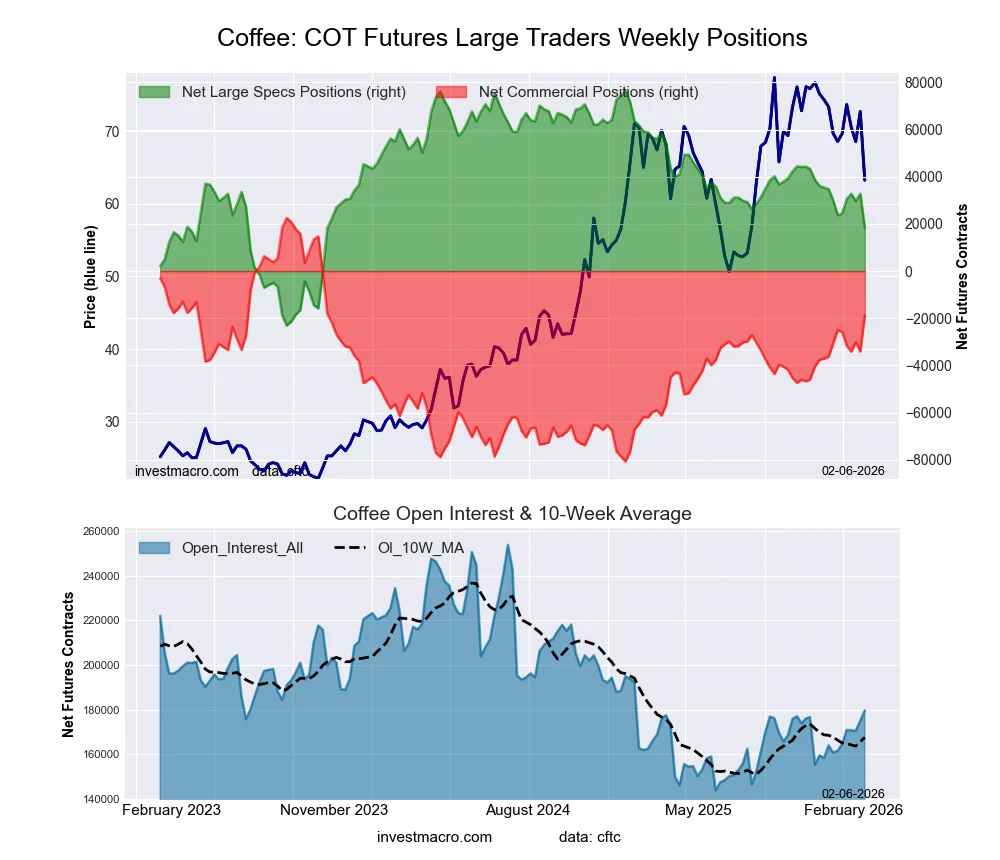
COFFEE Futures:
 Positioning Notes:
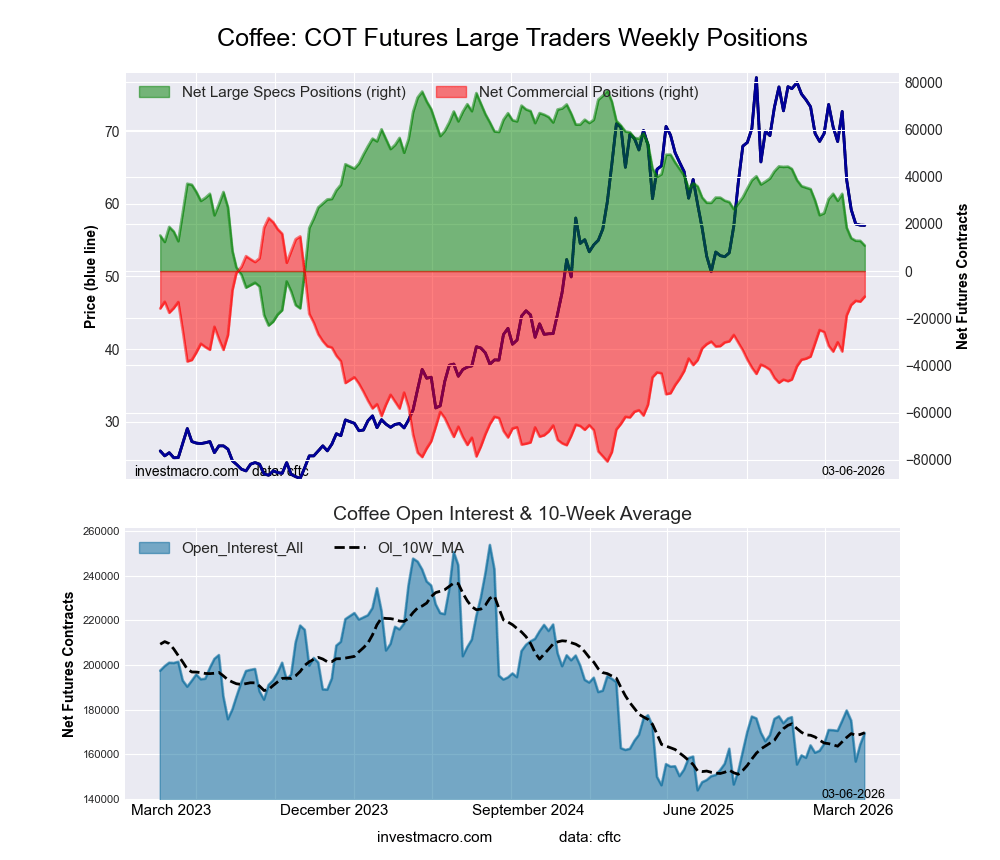
- COFFEE large speculator standing this week came in at a net position of 21,707 contracts in the data reported through Tuesday.
- Weekly Speculator position lowering of -3,349 contracts from the previous week which had a total of 25,056 net contracts.
- This week’s current strength score (range over the past 3 years, measured from 0 to 100) shows the speculators are currently Bearish with a score of 45.0 percent.
- The Commercials are Bullish with a score of 57.2 percent.
- The Small Traders (not shown in chart) are Bearish-Extreme with a score of 12.1 percent.
Price Trend-Following Model: Downtrend
Our weekly trend-following model classifies the current market price position as: Downtrend.
| COFFEE Futures Statistics | SPECULATORS | COMMERCIALS | SMALL TRADERS |
| – Percent of Open Interest Longs: | 28.5 | 38.7 | 5.1 |
| – Percent of Open Interest Shorts: | 16.1 | 51.0 | 5.2 |
| – Net Position: | 21,707 | -21,687 | -20 |
| – Gross Longs: | 50,143 | 68,102 | 9,061 |
| – Gross Shorts: | 28,436 | 89,789 | 9,081 |
| – Long to Short Ratio: | 1.8 to 1 | 0.8 to 1 | 1.0 to 1 |
| NET POSITION TREND: | |||
| – Strength Index Score (3 Year Range Pct): | 45.0 | 57.2 | 12.1 |
| – Strength Index Reading (3 Year Range): | Bearish | Bullish | Bearish-Extreme |
| NET POSITION MOVEMENT INDEX: | |||
| – 6-Week Change in Strength Index: | 8.9 | -8.4 | -3.3 |
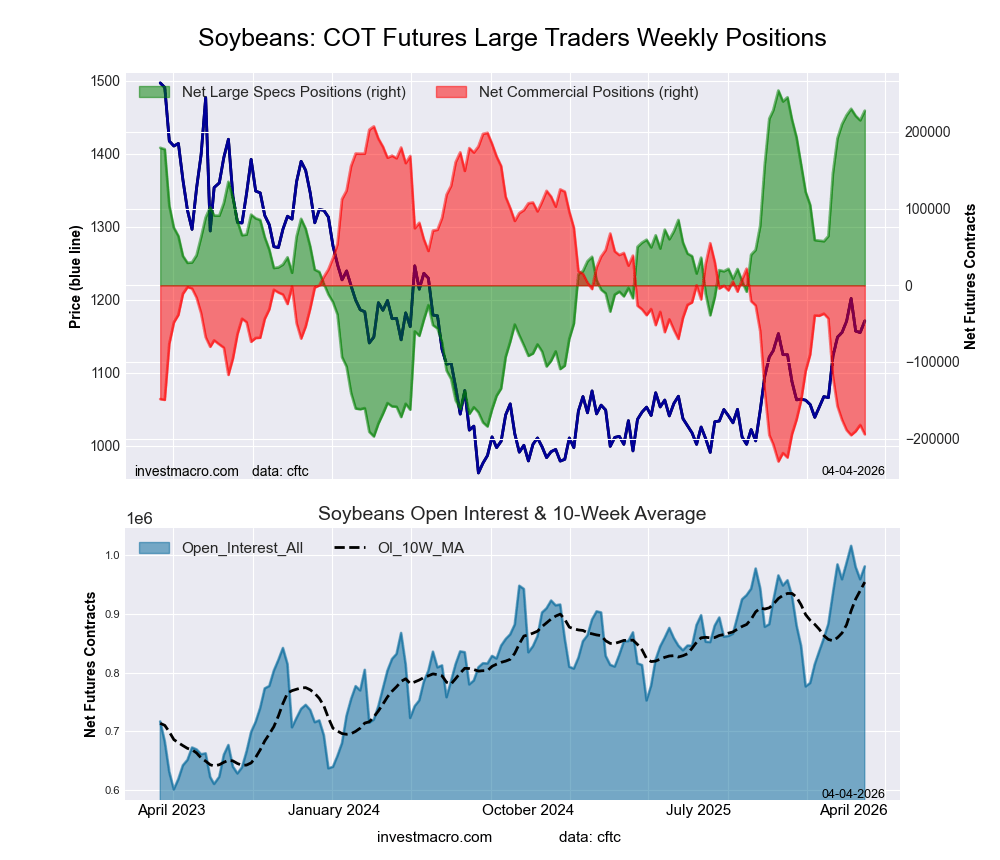
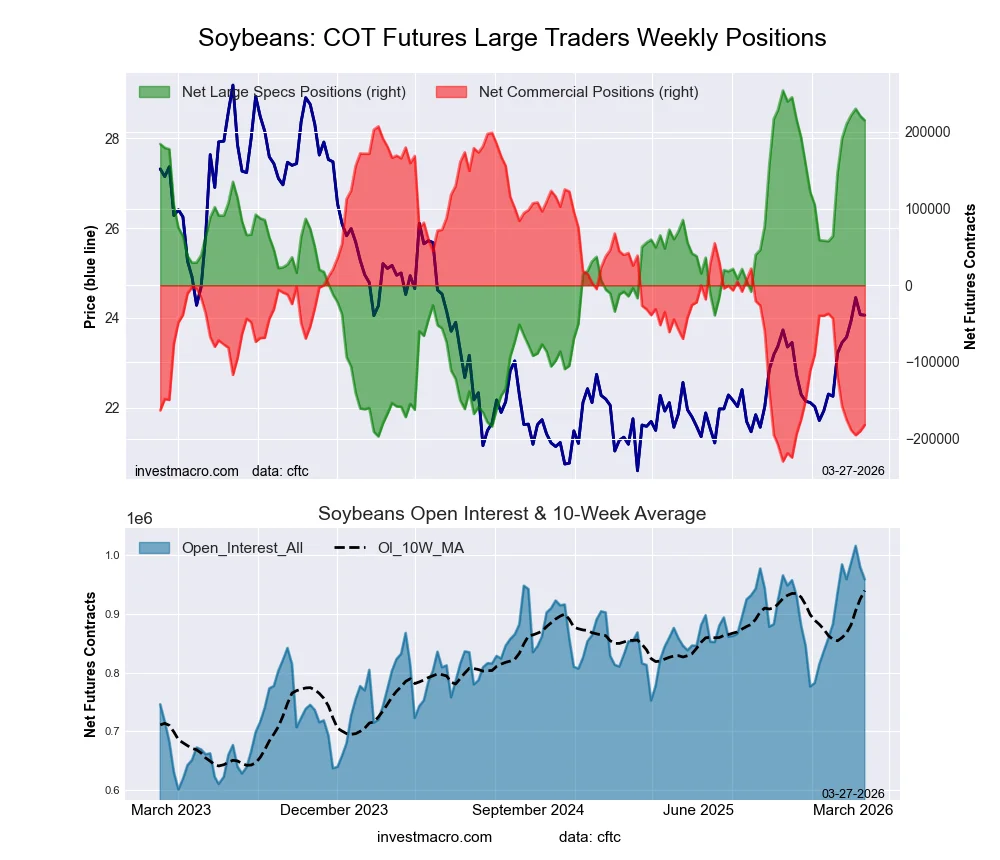
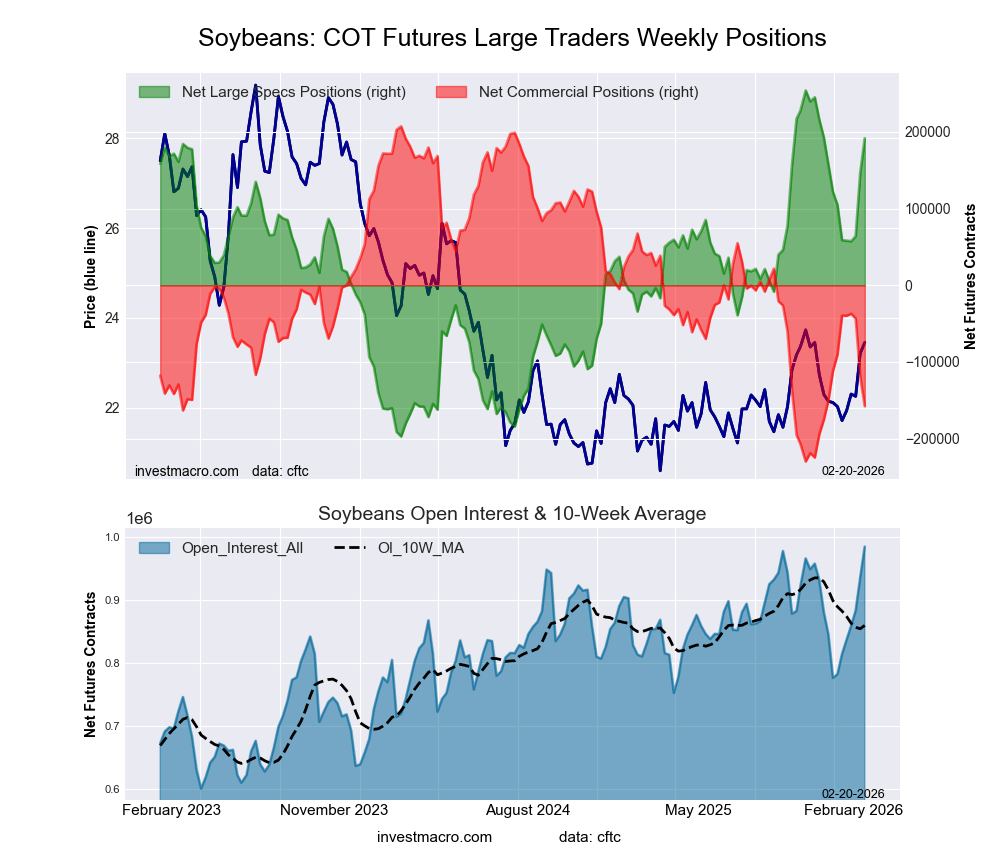
SOYBEANS Futures:
 Positioning Notes:
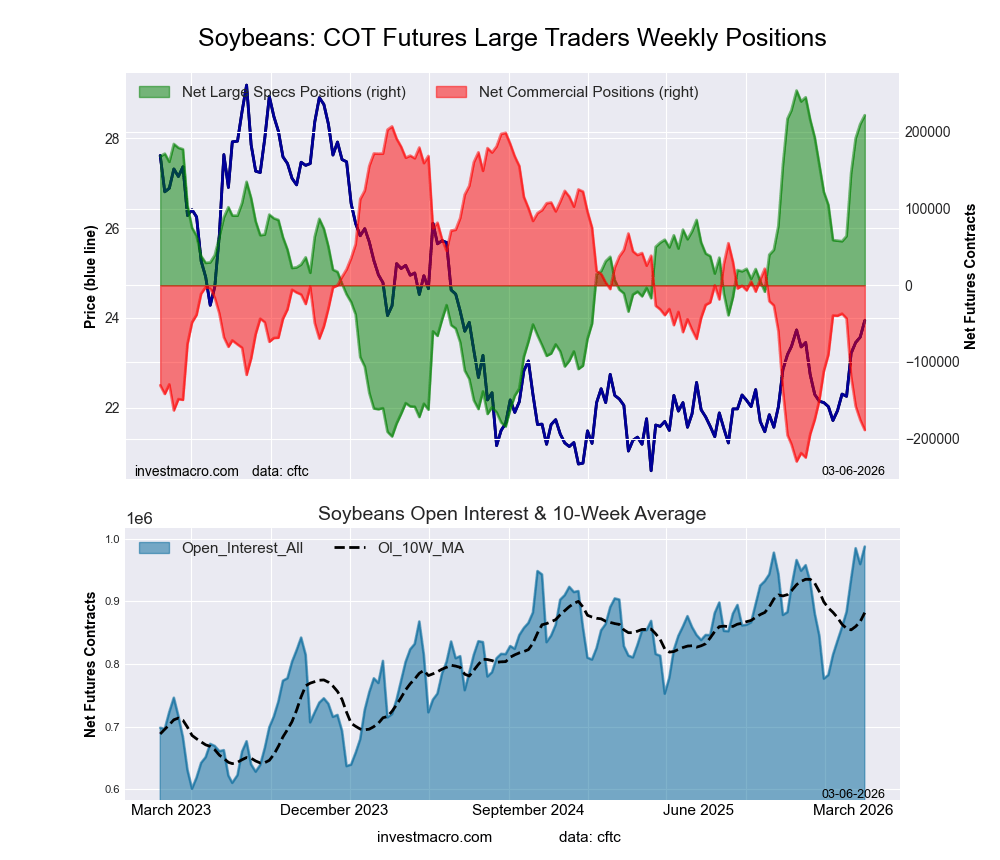
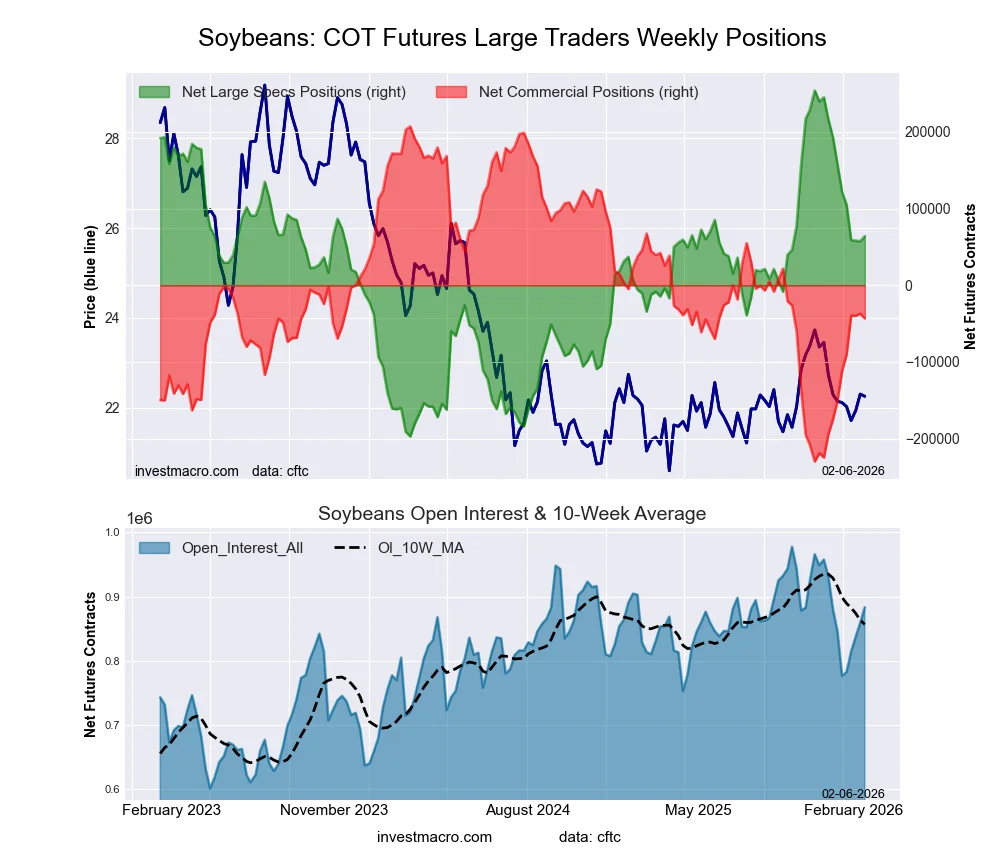
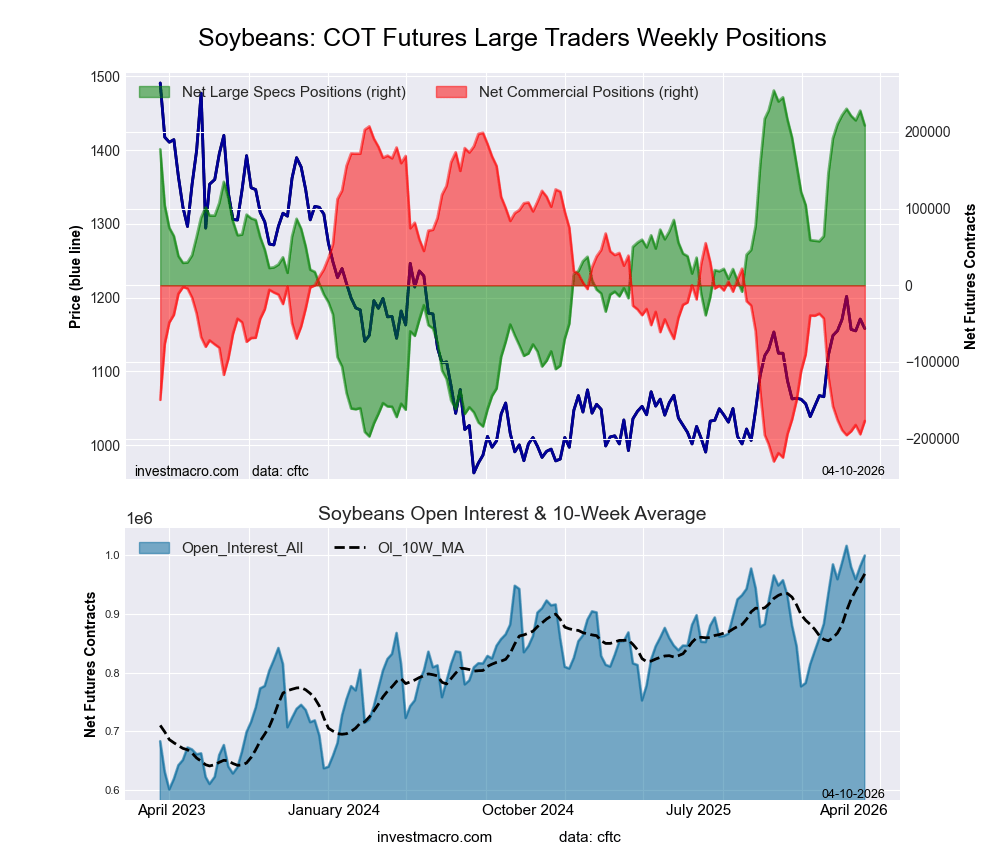
- SOYBEANS large speculator standing this week came in at a net position of 208,459 contracts in the data reported through Tuesday.
- Weekly Speculator position lowering of -19,387 contracts from the previous week which had a total of 227,846 net contracts.
- This week’s current strength score (range over the past 3 years, measured from 0 to 100) shows the speculators are currently Bullish-Extreme with a score of 89.9 percent.
- The Commercials are Bearish-Extreme with a score of 12.1 percent.
- The Small Traders (not shown in chart) are Bearish-Extreme with a score of 13.7 percent.
Price Trend-Following Model: Uptrend
Our weekly trend-following model classifies the current market price position as: Uptrend.
| SOYBEANS Futures Statistics | SPECULATORS | COMMERCIALS | SMALL TRADERS |
| – Percent of Open Interest Longs: | 28.4 | 45.6 | 5.2 |
| – Percent of Open Interest Shorts: | 7.5 | 63.4 | 8.3 |
| – Net Position: | 208,459 | -177,172 | -31,287 |
| – Gross Longs: | 283,509 | 456,246 | 51,916 |
| – Gross Shorts: | 75,050 | 633,418 | 83,203 |
| – Long to Short Ratio: | 3.8 to 1 | 0.7 to 1 | 0.6 to 1 |
| NET POSITION TREND: | |||
| – Strength Index Score (3 Year Range Pct): | 89.9 | 12.1 | 13.7 |
| – Strength Index Reading (3 Year Range): | Bullish-Extreme | Bearish-Extreme | Bearish-Extreme |
| NET POSITION MOVEMENT INDEX: | |||
| – 6-Week Change in Strength Index: | -0.4 | -0.4 | 11.2 |
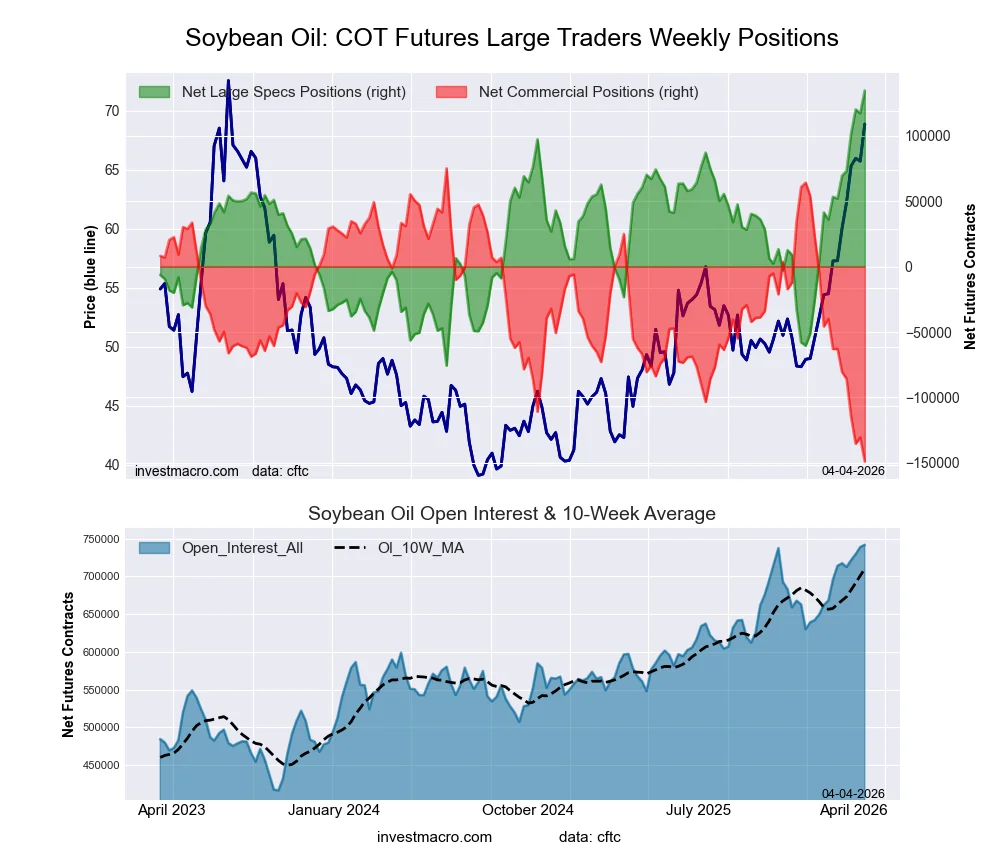
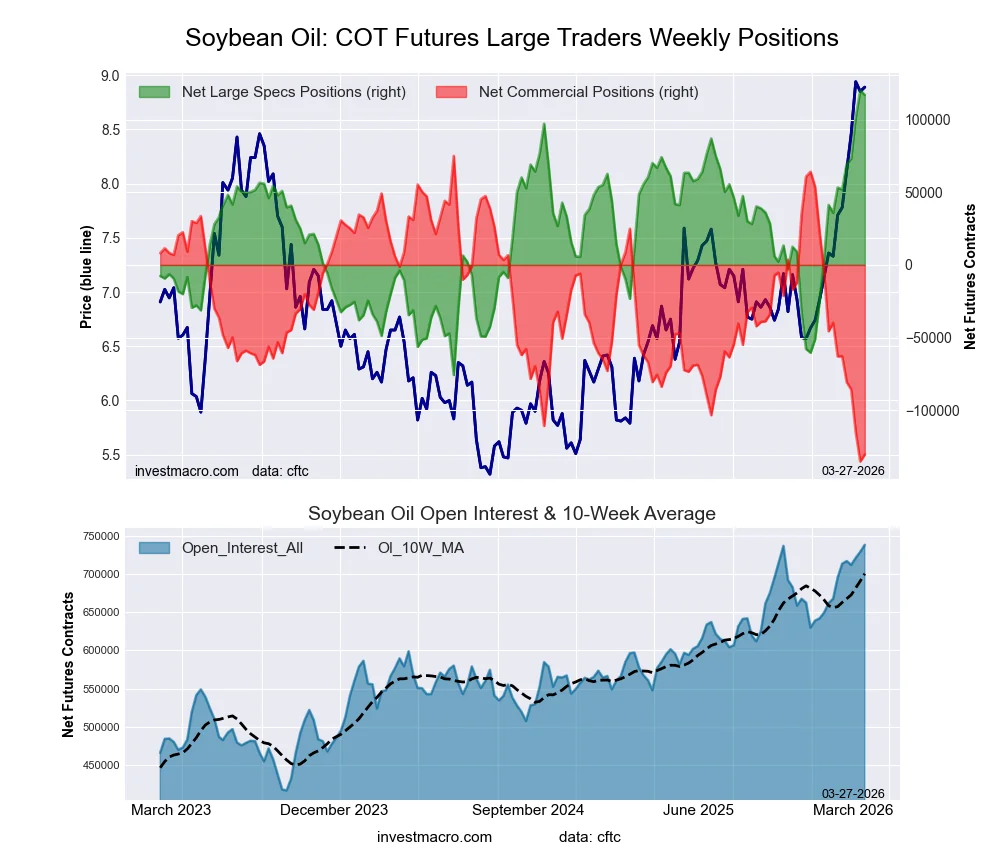
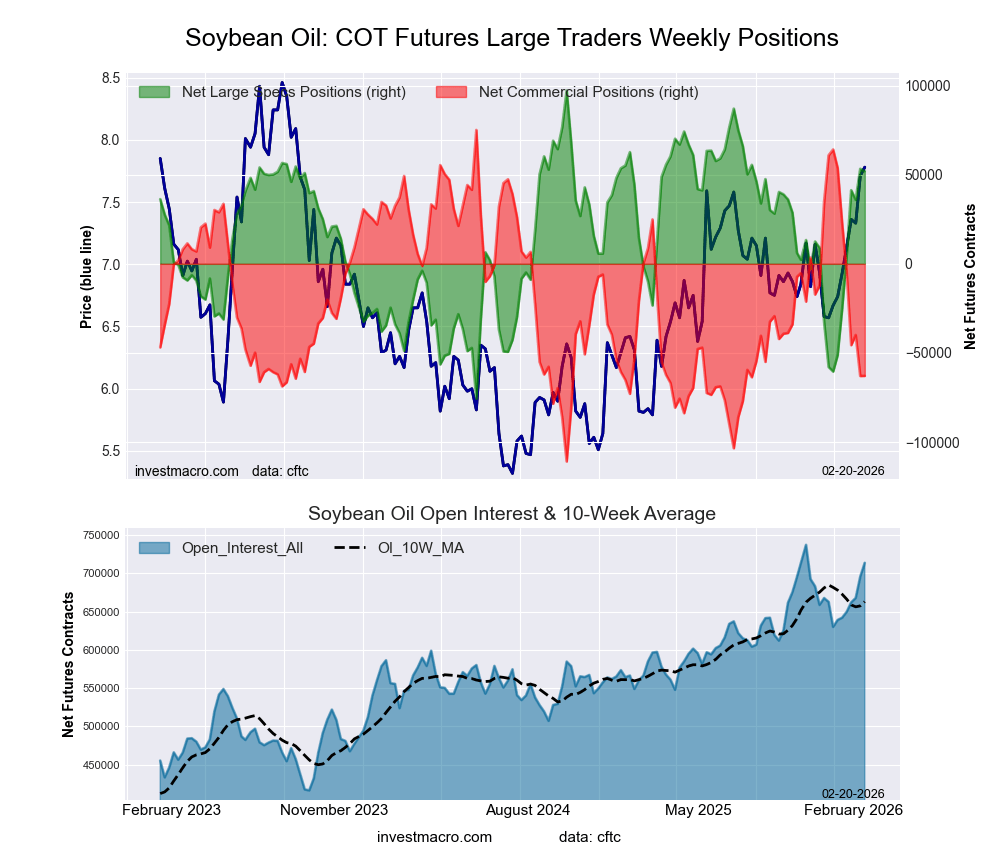
SOYBEAN OIL Futures:
 Positioning Notes:
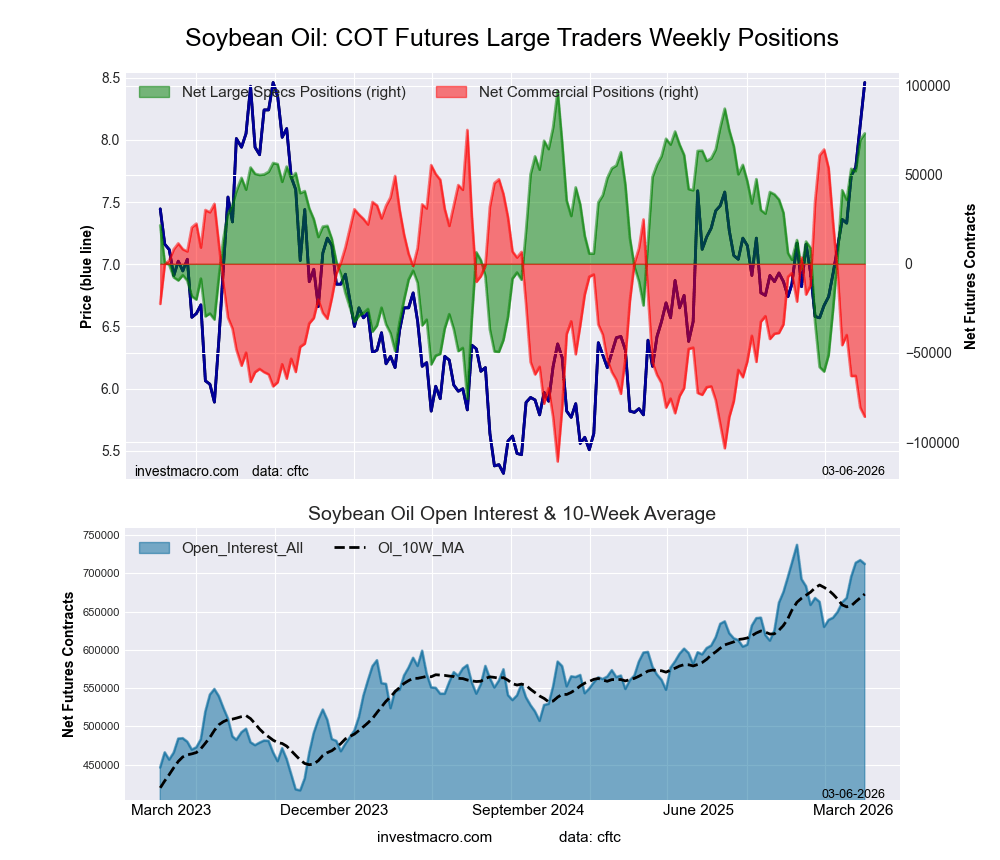
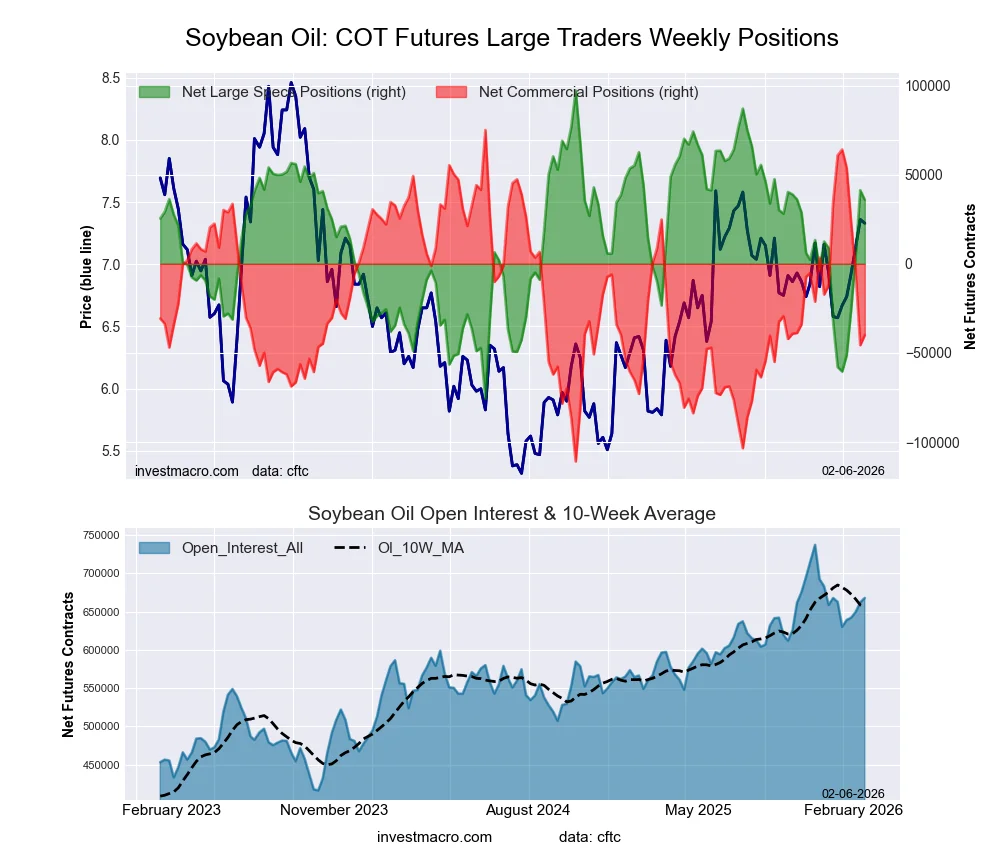
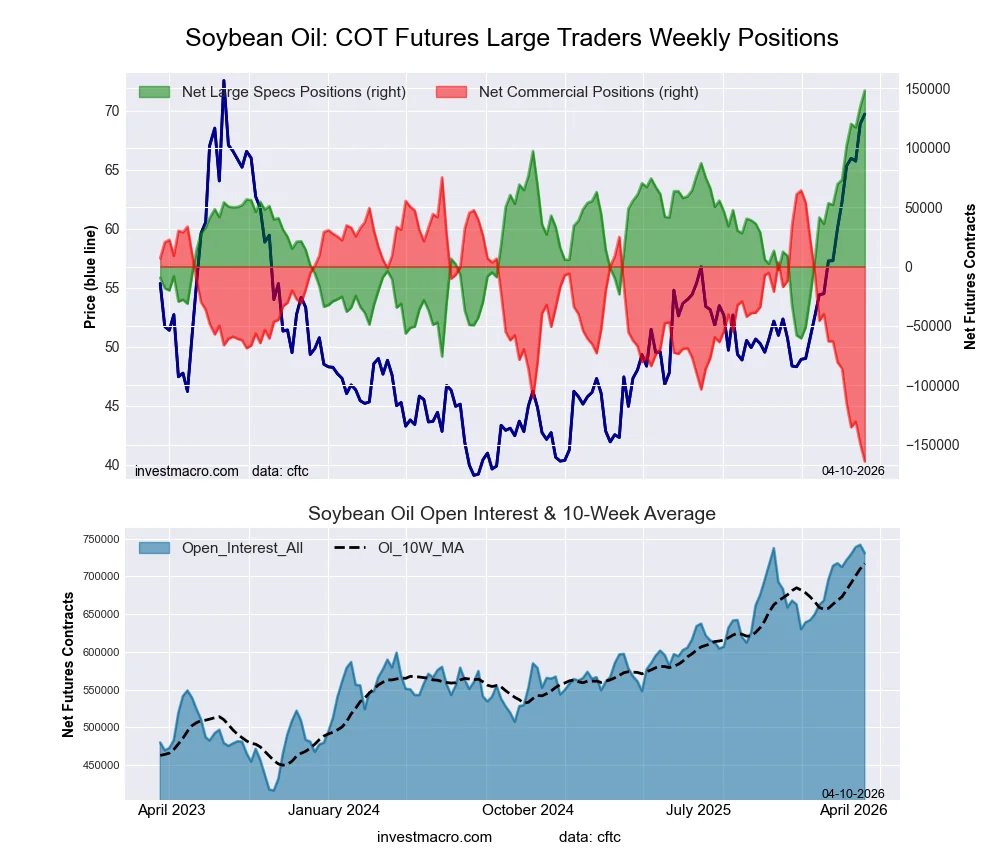
- SOYBEAN OIL large speculator standing this week came in at a net position of 148,242 contracts in the data reported through Tuesday.
- Weekly Speculator position boost of 13,685 contracts from the previous week which had a total of 134,557 net contracts.
- This week’s current strength score (range over the past 3 years, measured from 0 to 100) shows the speculators are currently Bullish-Extreme with a score of 100.0 percent.
- The Commercials are Bearish-Extreme with a score of 0.0 percent.
- The Small Traders (not shown in chart) are Bullish-Extreme with a score of 97.5 percent.
Price Trend-Following Model: Uptrend
Our weekly trend-following model classifies the current market price position as: Uptrend.
| SOYBEAN OIL Futures Statistics | SPECULATORS | COMMERCIALS | SMALL TRADERS |
| – Percent of Open Interest Longs: | 26.9 | 43.5 | 5.9 |
| – Percent of Open Interest Shorts: | 6.7 | 66.0 | 3.8 |
| – Net Position: | 148,242 | -164,152 | 15,910 |
| – Gross Longs: | 196,916 | 317,878 | 43,469 |
| – Gross Shorts: | 48,674 | 482,030 | 27,559 |
| – Long to Short Ratio: | 4.0 to 1 | 0.7 to 1 | 1.6 to 1 |
| NET POSITION TREND: | |||
| – Strength Index Score (3 Year Range Pct): | 100.0 | 0.0 | 97.5 |
| – Strength Index Reading (3 Year Range): | Bullish-Extreme | Bearish-Extreme | Bullish-Extreme |
| NET POSITION MOVEMENT INDEX: | |||
| – 6-Week Change in Strength Index: | 35.2 | -34.9 | 23.5 |
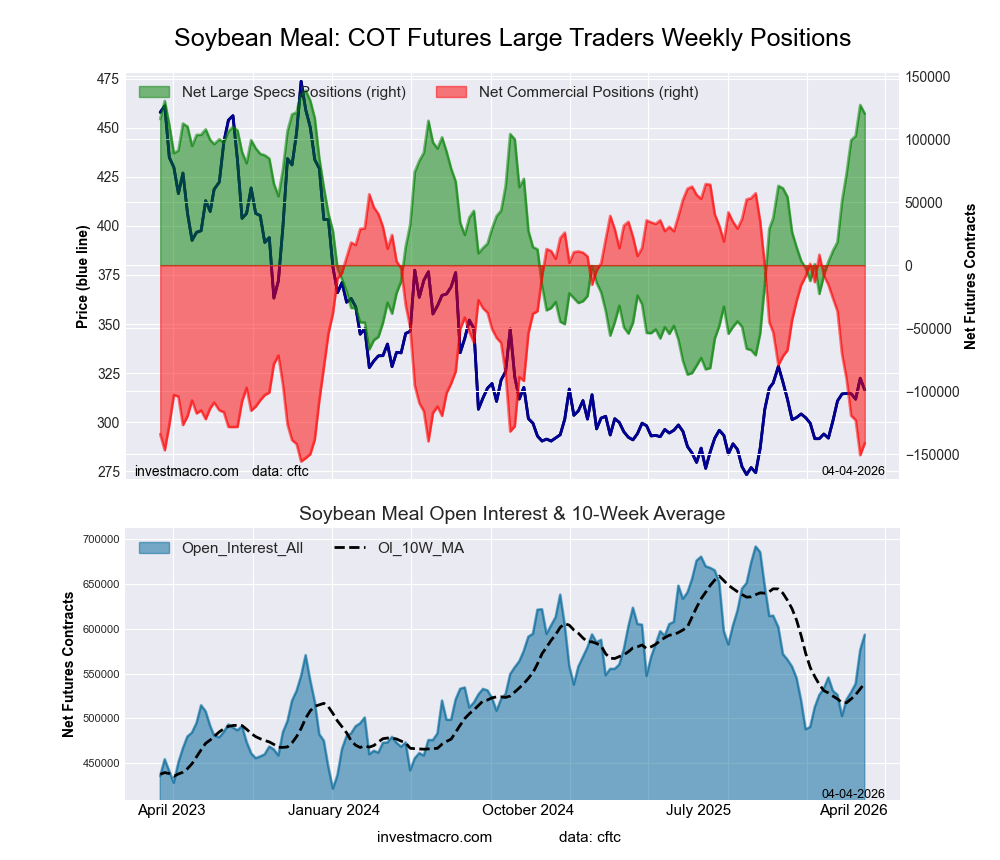
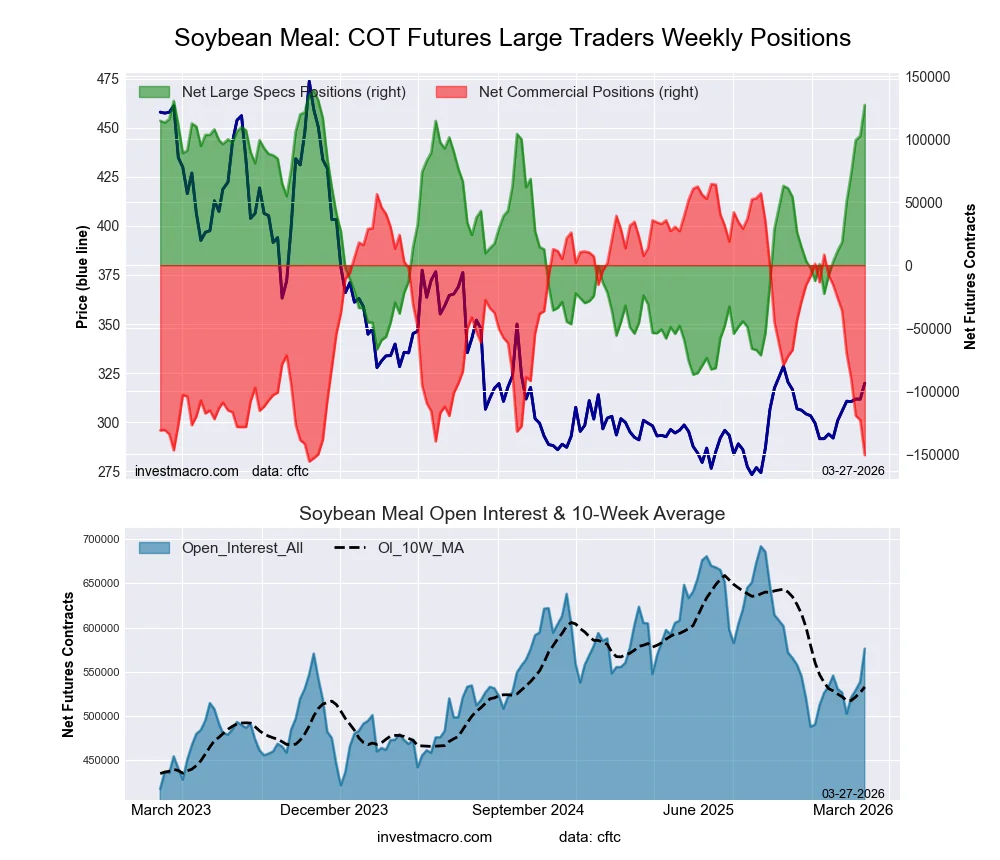
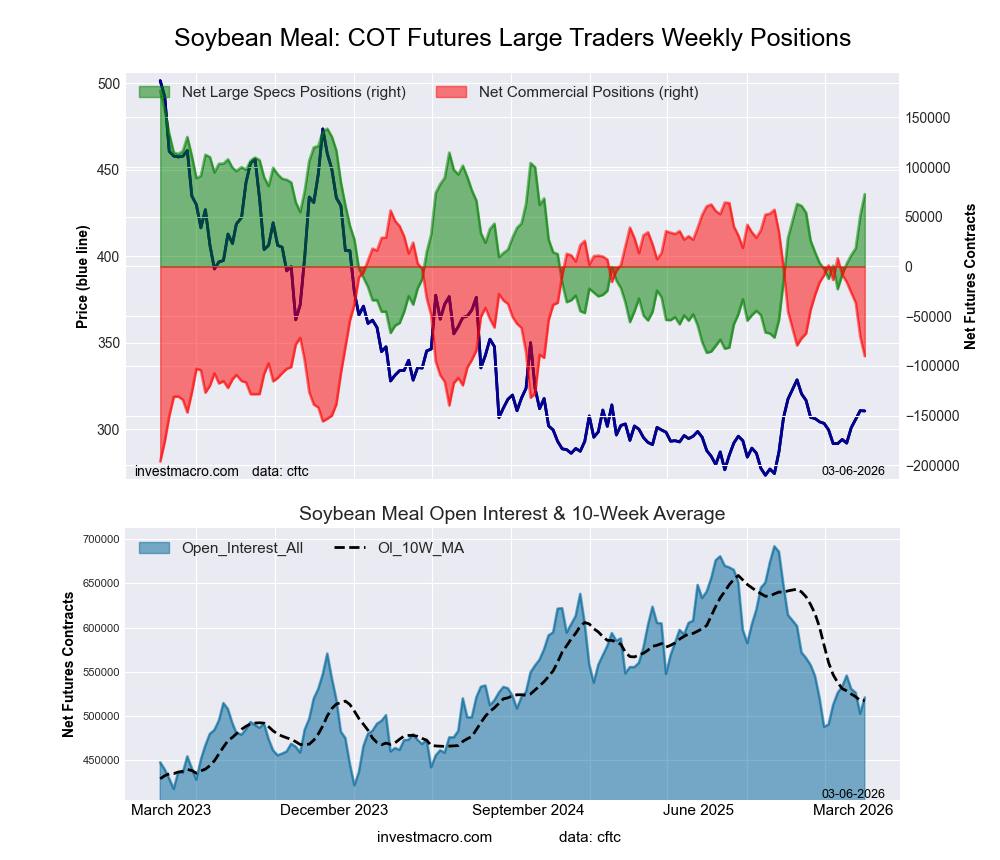
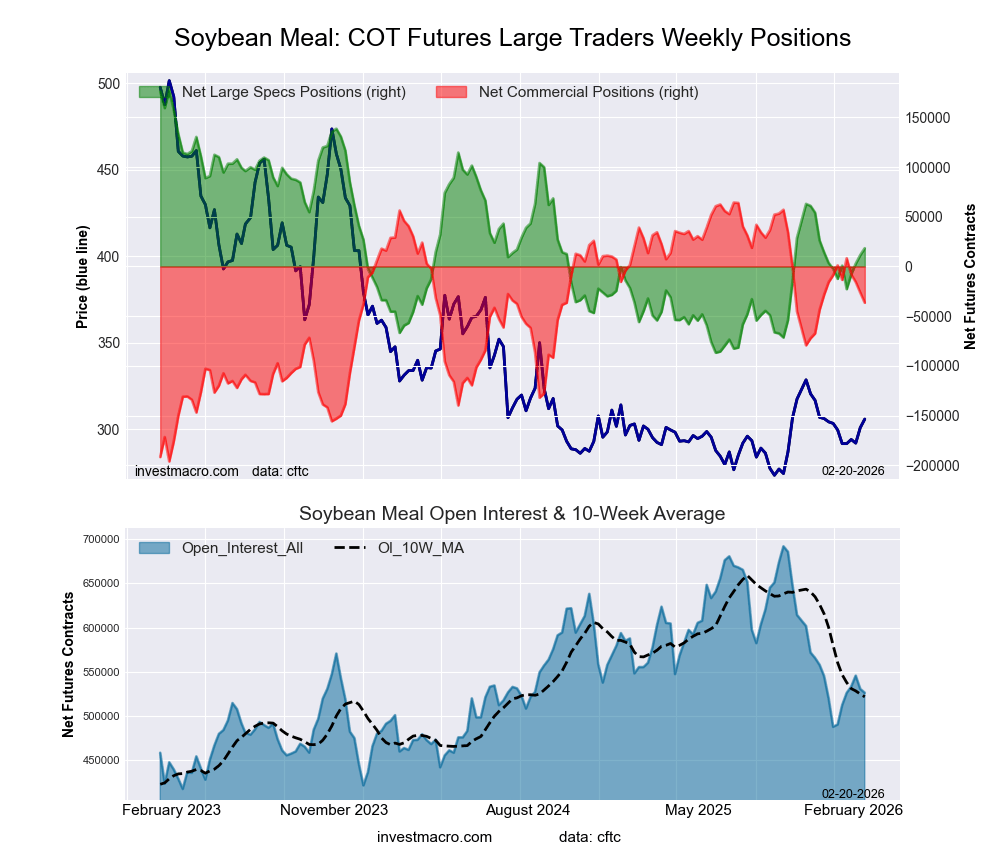
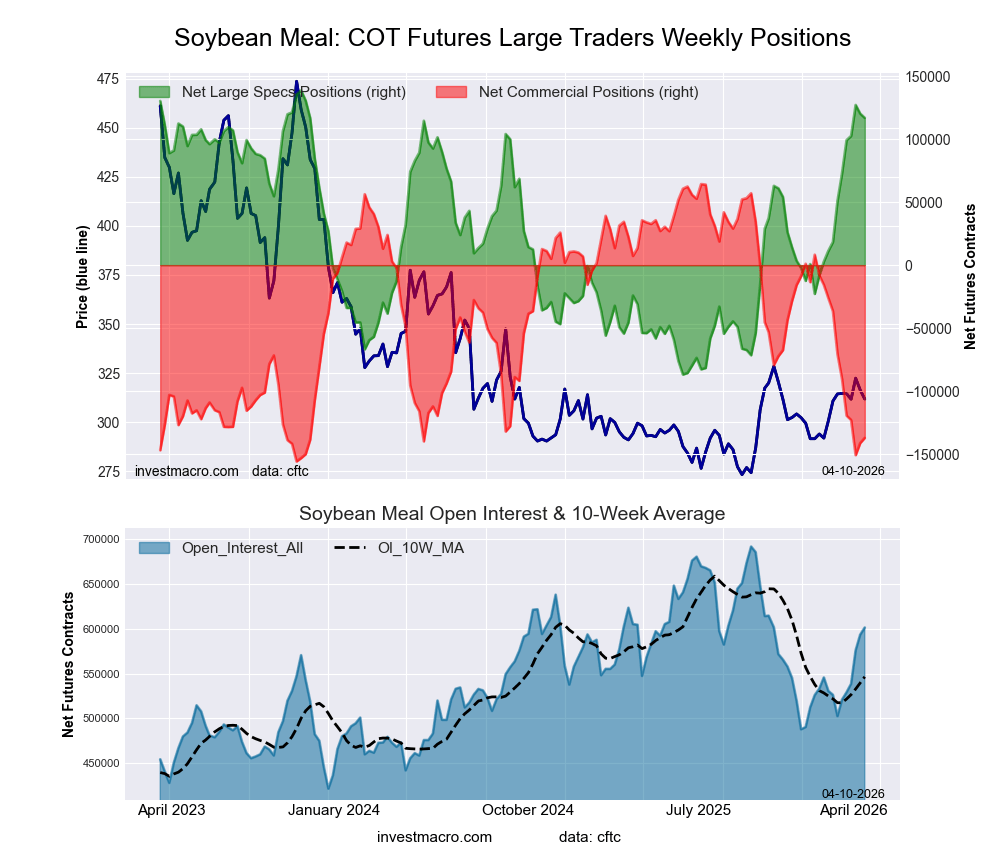
SOYBEAN MEAL Futures:
 Positioning Notes:
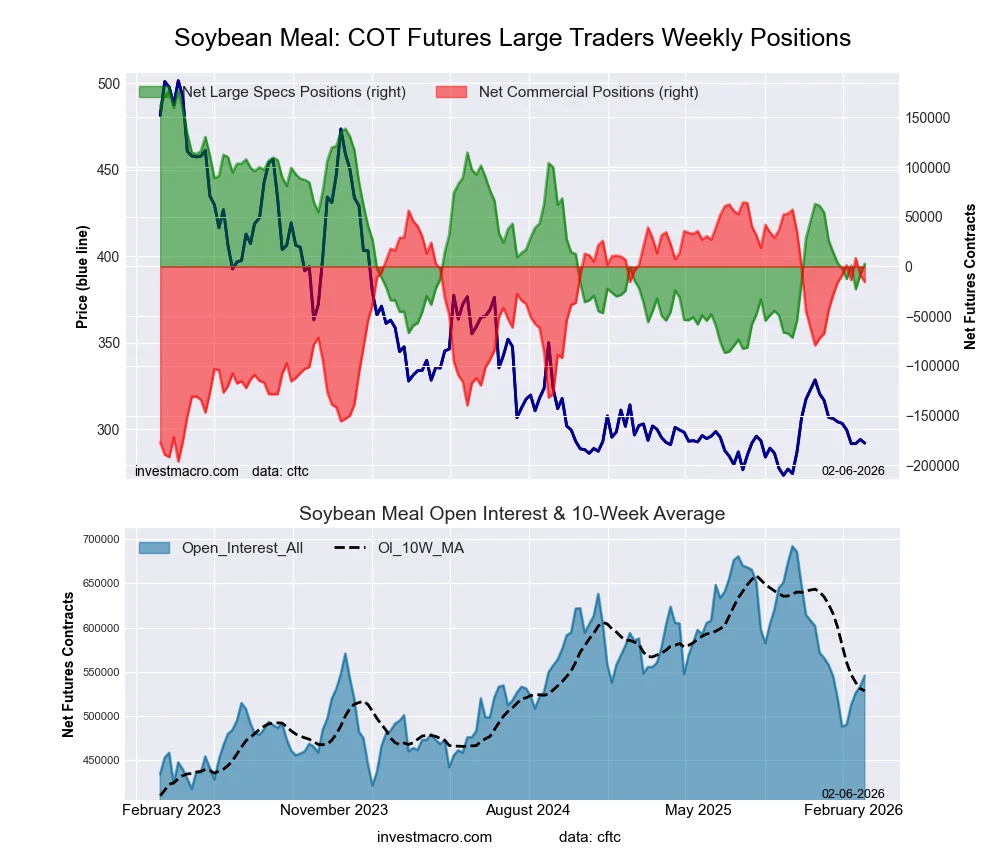
- SOYBEAN MEAL large speculator standing this week came in at a net position of 116,864 contracts in the data reported through Tuesday.
- Weekly Speculator position reduction of -3,330 contracts from the previous week which had a total of 120,194 net contracts.
- This week’s current strength score (range over the past 3 years, measured from 0 to 100) shows the speculators are currently Bullish-Extreme with a score of 90.4 percent.
- The Commercials are Bearish-Extreme with a score of 8.5 percent.
- The Small Traders (not shown in chart) are Bullish with a score of 57.3 percent.
Price Trend-Following Model: Strong Uptrend
Our weekly trend-following model classifies the current market price position as: Strong Uptrend.
| SOYBEAN MEAL Futures Statistics | SPECULATORS | COMMERCIALS | SMALL TRADERS |
| – Percent of Open Interest Longs: | 27.9 | 43.3 | 8.0 |
| – Percent of Open Interest Shorts: | 8.5 | 66.1 | 4.6 |
| – Net Position: | 116,864 | -137,109 | 20,245 |
| – Gross Longs: | 168,116 | 260,240 | 48,019 |
| – Gross Shorts: | 51,252 | 397,349 | 27,774 |
| – Long to Short Ratio: | 3.3 to 1 | 0.7 to 1 | 1.7 to 1 |
| NET POSITION TREND: | |||
| – Strength Index Score (3 Year Range Pct): | 90.4 | 8.5 | 57.3 |
| – Strength Index Reading (3 Year Range): | Bullish-Extreme | Bearish-Extreme | Bullish |
| NET POSITION MOVEMENT INDEX: | |||
| – 6-Week Change in Strength Index: | 29.3 | -30.3 | 3.5 |
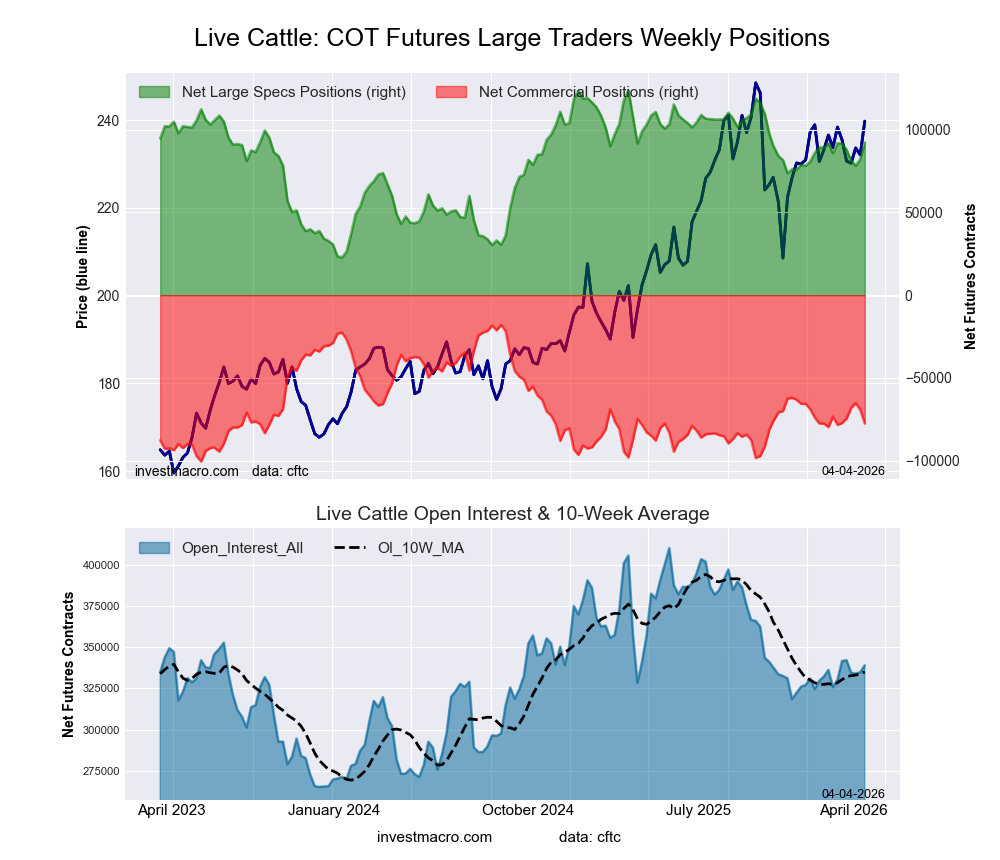
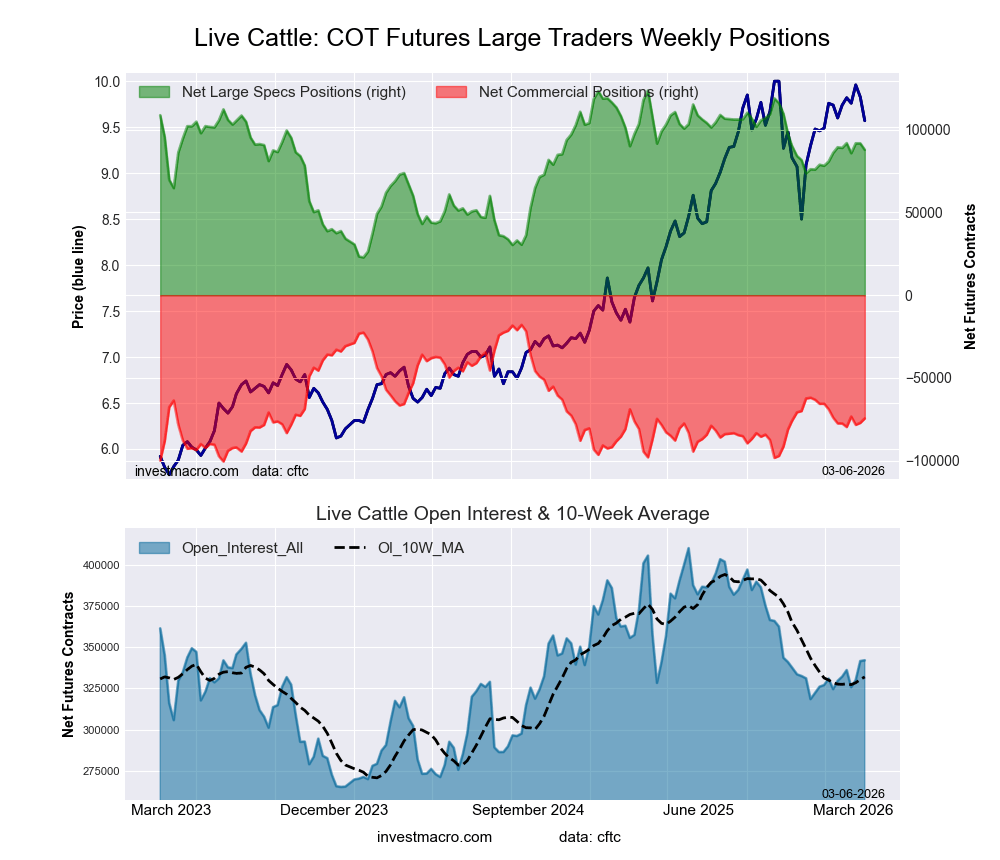
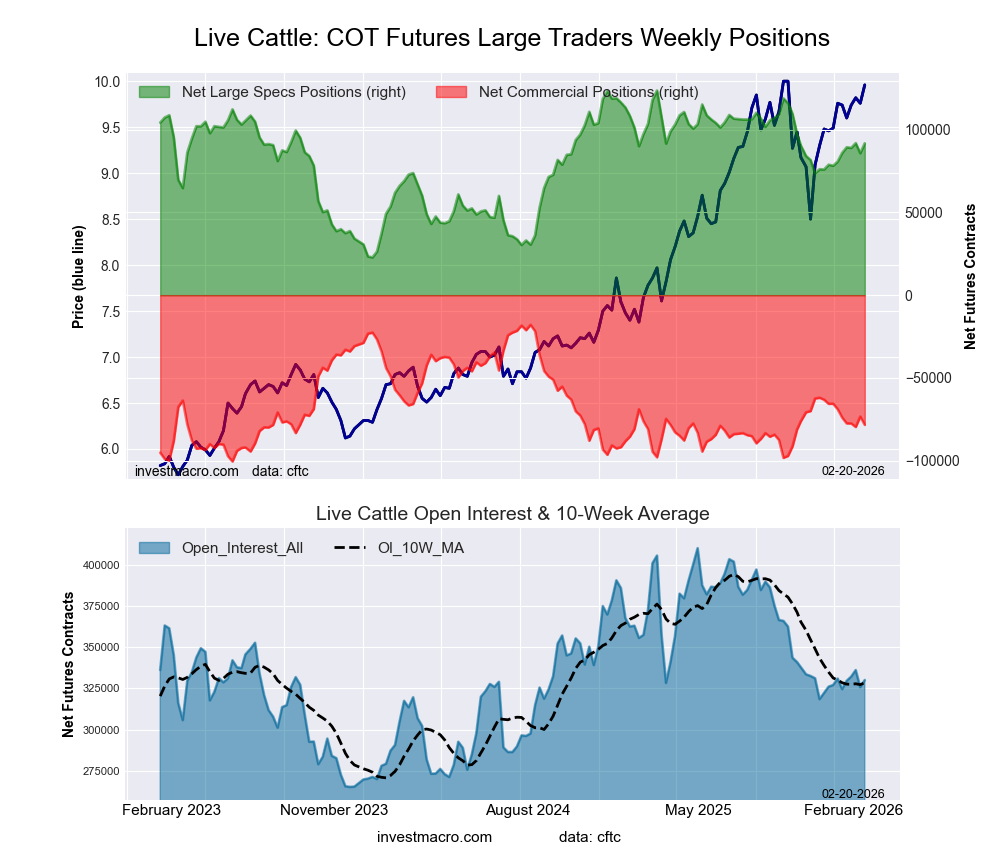
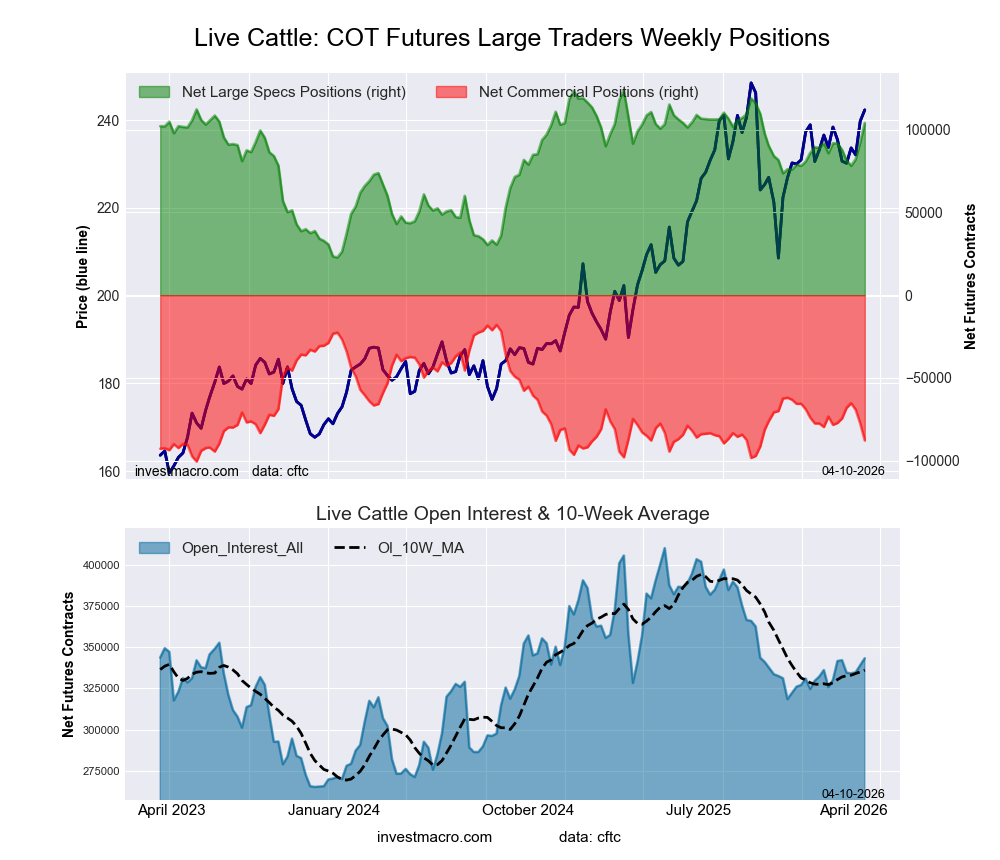
LIVE CATTLE Futures:
 Positioning Notes:
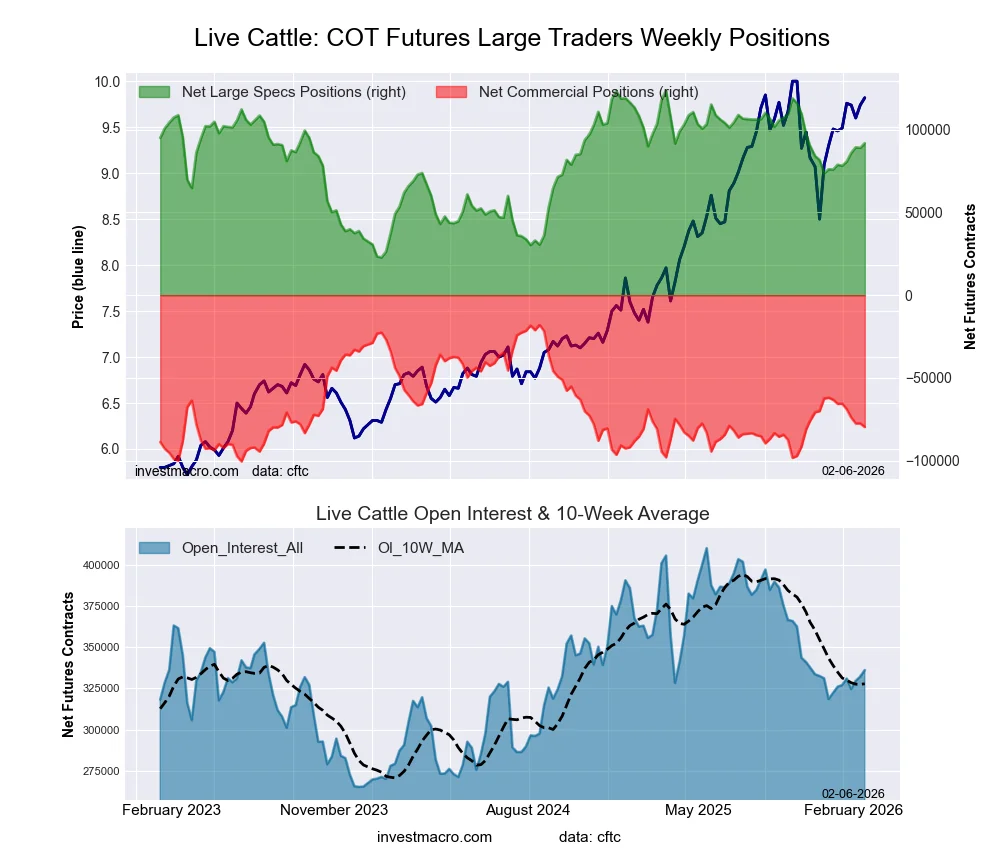
- LIVE CATTLE large speculator standing this week came in at a net position of 104,016 contracts in the data reported through Tuesday.
- Weekly Speculator position uptick of 11,756 contracts from the previous week which had a total of 92,260 net contracts.
- This week’s current strength score (range over the past 3 years, measured from 0 to 100) shows the speculators are currently Bullish-Extreme with a score of 80.5 percent.
- The Commercials are Bearish-Extreme with a score of 15.4 percent.
- The Small Traders (not shown in chart) are Bearish with a score of 41.2 percent.
Price Trend-Following Model: Strong Uptrend
Our weekly trend-following model classifies the current market price position as: Strong Uptrend.
| LIVE CATTLE Futures Statistics | SPECULATORS | COMMERCIALS | SMALL TRADERS |
| – Percent of Open Interest Longs: | 45.0 | 28.6 | 8.9 |
| – Percent of Open Interest Shorts: | 14.7 | 54.1 | 13.6 |
| – Net Position: | 104,016 | -87,776 | -16,240 |
| – Gross Longs: | 154,471 | 98,073 | 30,416 |
| – Gross Shorts: | 50,455 | 185,849 | 46,656 |
| – Long to Short Ratio: | 3.1 to 1 | 0.5 to 1 | 0.7 to 1 |
| NET POSITION TREND: | |||
| – Strength Index Score (3 Year Range Pct): | 80.5 | 15.4 | 41.2 |
| – Strength Index Reading (3 Year Range): | Bullish-Extreme | Bearish-Extreme | Bearish |
| NET POSITION MOVEMENT INDEX: | |||
| – 6-Week Change in Strength Index: | 12.2 | -12.8 | -6.0 |
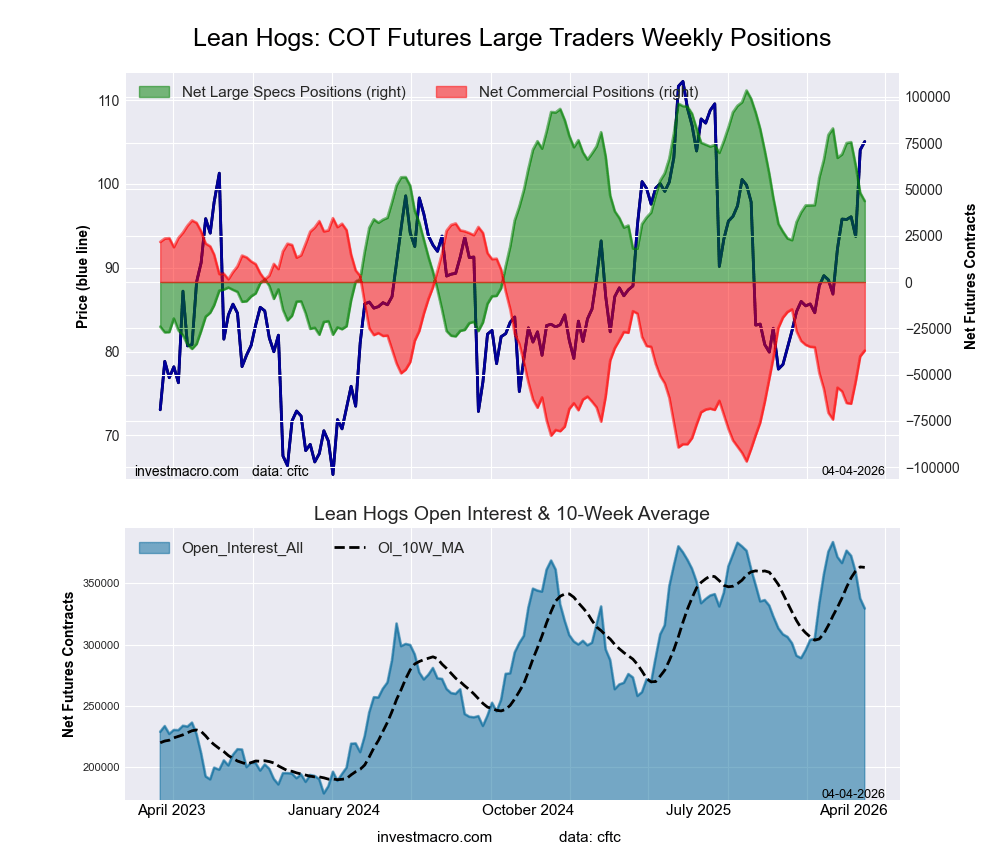
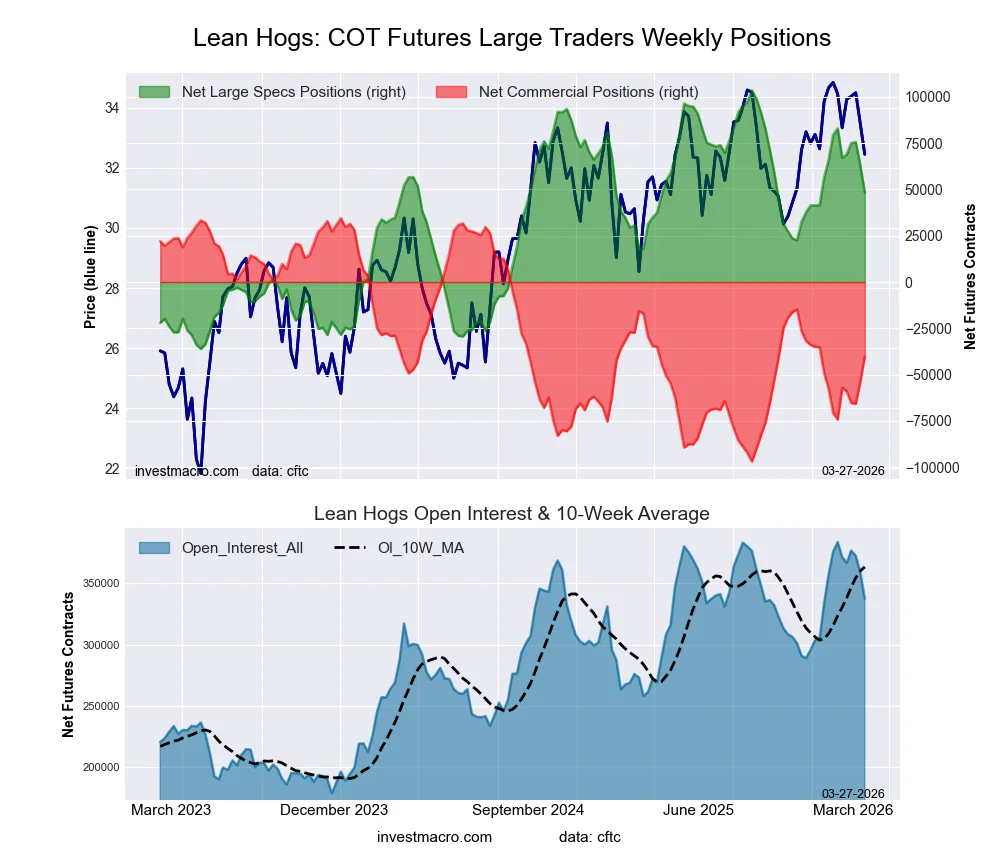
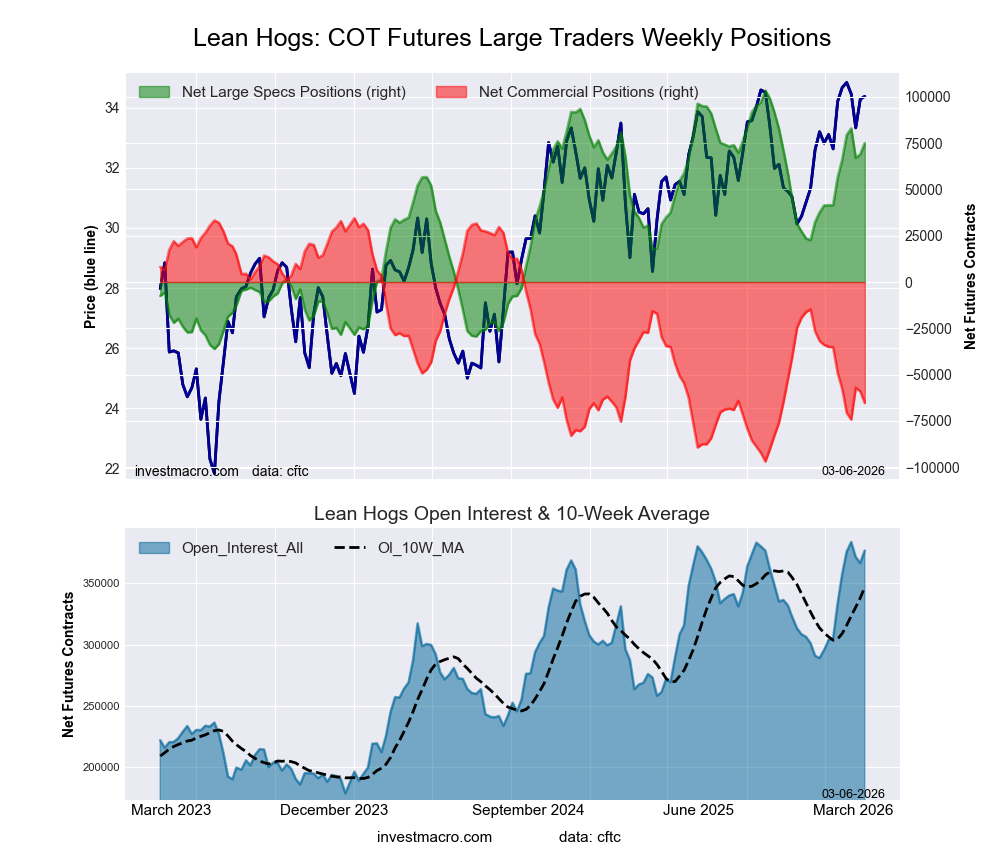
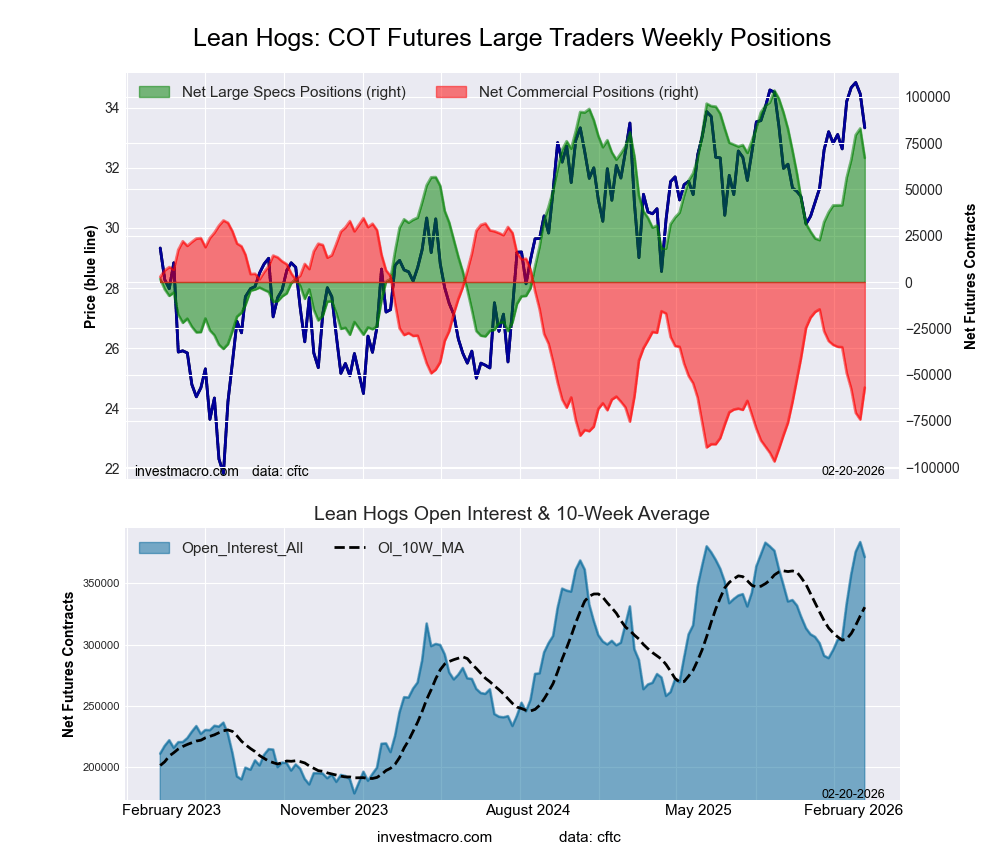
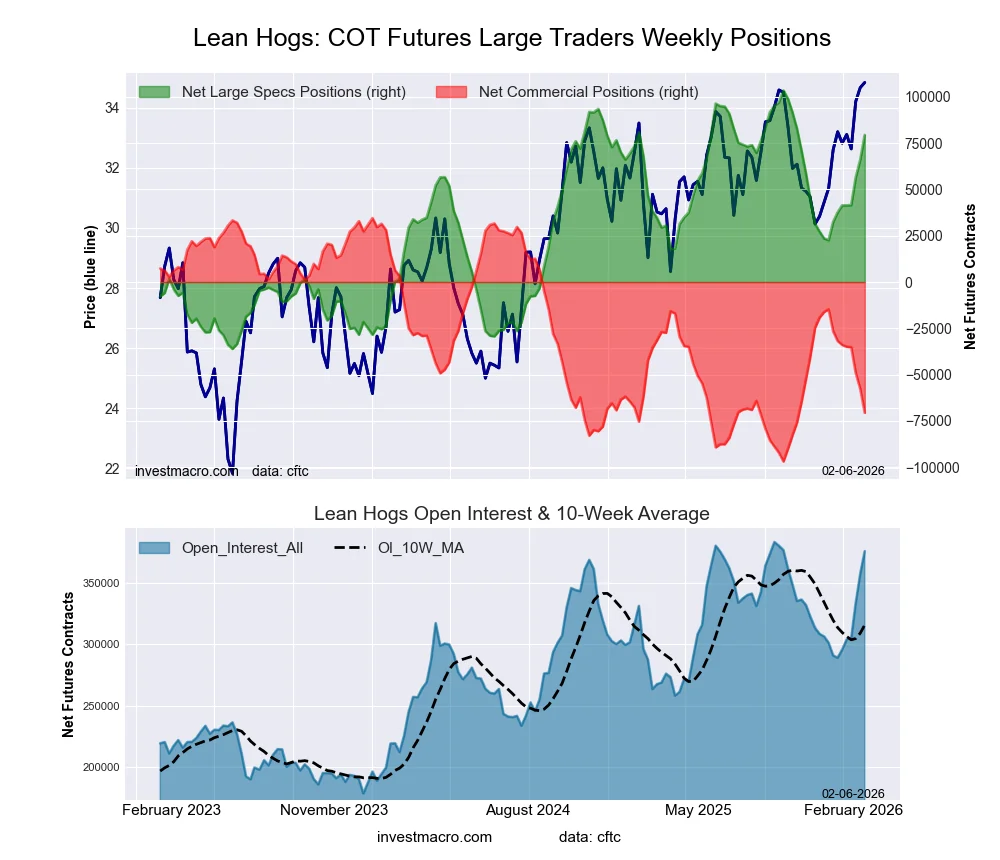
LEAN HOGS Futures:
 Positioning Notes:
- LEAN HOGS large speculator standing this week came in at a net position of 46,461 contracts in the data reported through Tuesday.
- Weekly Speculator position rise of 2,750 contracts from the previous week which had a total of 43,711 net contracts.
- This week’s current strength score (range over the past 3 years, measured from 0 to 100) shows the speculators are currently Bullish with a score of 59.2 percent.
- The Commercials are Bearish with a score of 43.1 percent.
- The Small Traders (not shown in chart) are Bearish with a score of 40.3 percent.
Price Trend-Following Model: Strong Uptrend
Our weekly trend-following model classifies the current market price position as: Strong Uptrend.
| LEAN HOGS Futures Statistics | SPECULATORS | COMMERCIALS | SMALL TRADERS |
| – Percent of Open Interest Longs: | 37.7 | 34.7 | 6.6 |
| – Percent of Open Interest Shorts: | 23.6 | 46.8 | 8.5 |
| – Net Position: | 46,461 | -40,270 | -6,191 |
| – Gross Longs: | 124,530 | 114,438 | 21,871 |
| – Gross Shorts: | 78,069 | 154,708 | 28,062 |
| – Long to Short Ratio: | 1.6 to 1 | 0.7 to 1 | 0.8 to 1 |
| NET POSITION TREND: | |||
| – Strength Index Score (3 Year Range Pct): | 59.2 | 43.1 | 40.3 |
| – Strength Index Reading (3 Year Range): | Bullish | Bearish | Bearish |
| NET POSITION MOVEMENT INDEX: | |||
| – 6-Week Change in Strength Index: | -16.1 | 14.3 | 22.5 |
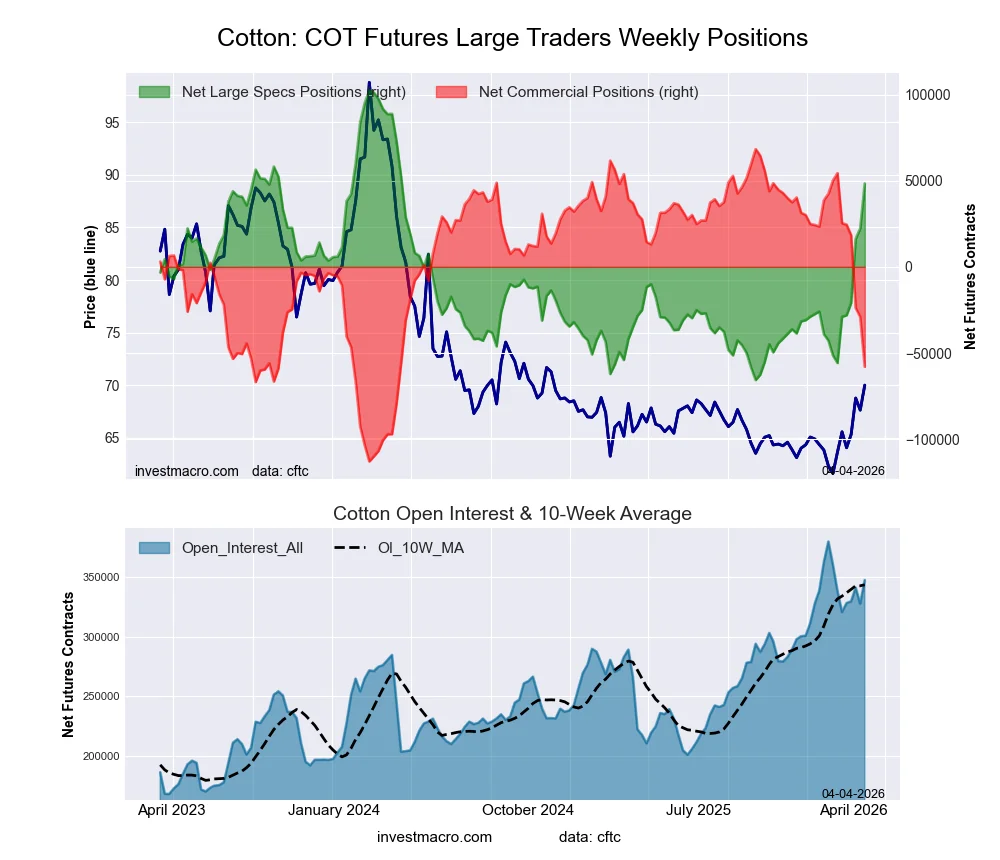
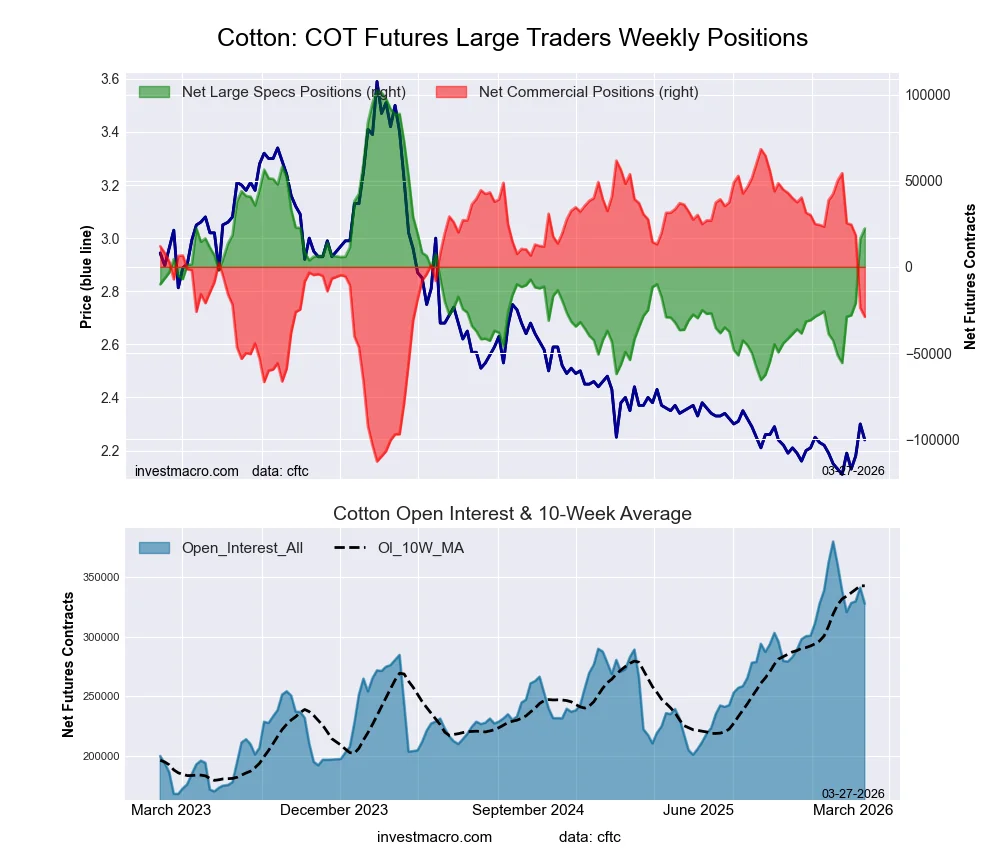
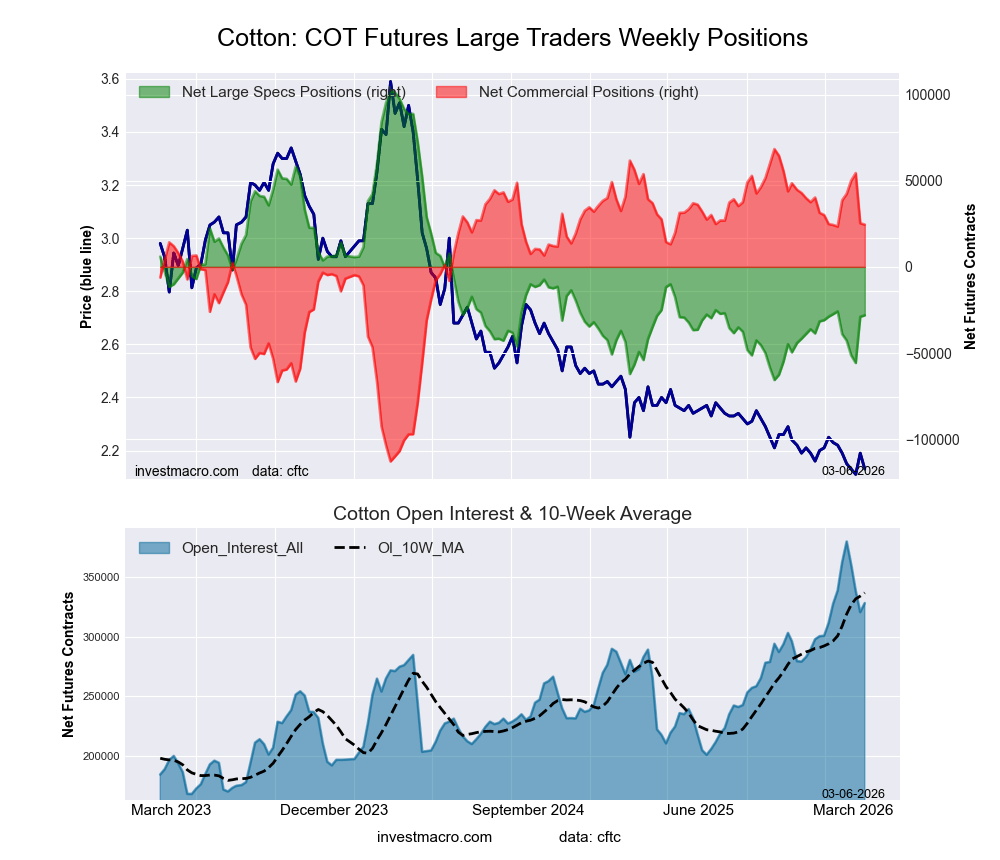
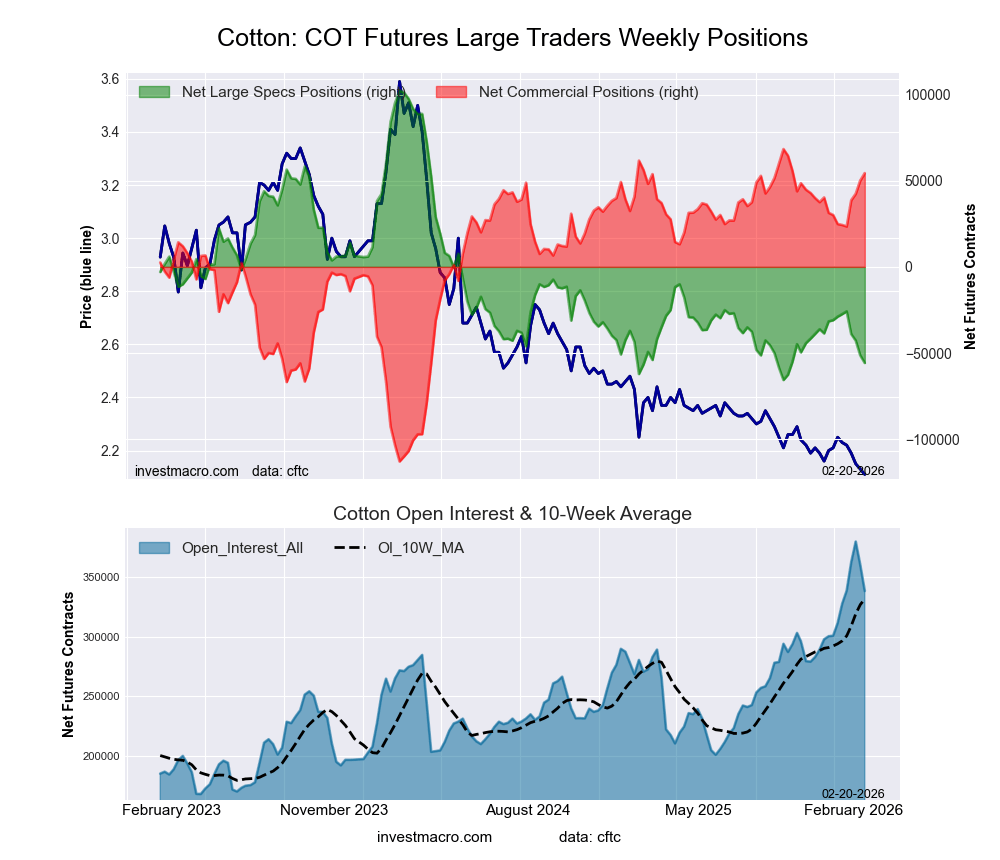
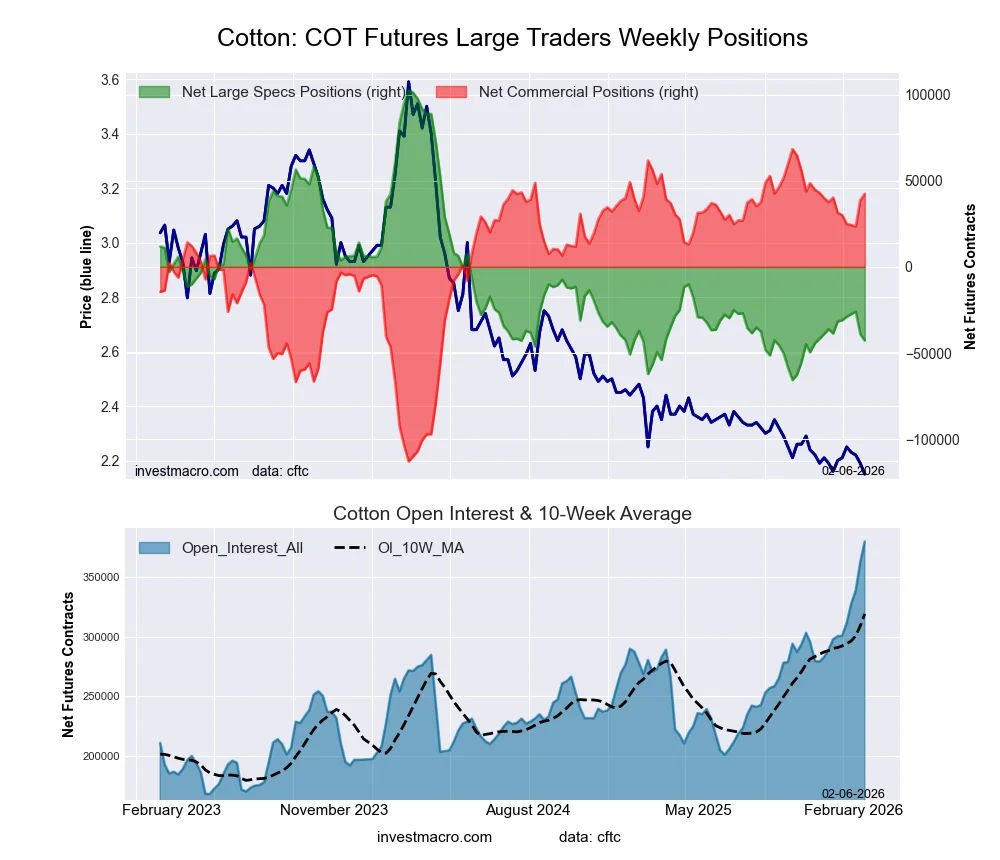
COTTON Futures:
 Positioning Notes:
- COTTON large speculator standing this week came in at a net position of 61,357 contracts in the data reported through Tuesday.
- Weekly Speculator position rise of 12,970 contracts from the previous week which had a total of 48,387 net contracts.
- This week’s current strength score (range over the past 3 years, measured from 0 to 100) shows the speculators are currently Bullish with a score of 75.6 percent.
- The Commercials are Bearish with a score of 23.7 percent.
- The Small Traders (not shown in chart) are Bullish-Extreme with a score of 84.7 percent.
Price Trend-Following Model: Strong Uptrend
Our weekly trend-following model classifies the current market price position as: Strong Uptrend.
| COTTON Futures Statistics | SPECULATORS | COMMERCIALS | SMALL TRADERS |
| – Percent of Open Interest Longs: | 37.9 | 35.8 | 5.7 |
| – Percent of Open Interest Shorts: | 20.2 | 56.0 | 3.2 |
| – Net Position: | 61,357 | -69,843 | 8,486 |
| – Gross Longs: | 131,279 | 124,058 | 19,645 |
| – Gross Shorts: | 69,922 | 193,901 | 11,159 |
| – Long to Short Ratio: | 1.9 to 1 | 0.6 to 1 | 1.8 to 1 |
| NET POSITION TREND: | |||
| – Strength Index Score (3 Year Range Pct): | 75.6 | 23.7 | 84.7 |
| – Strength Index Reading (3 Year Range): | Bullish | Bearish | Bullish-Extreme |
| NET POSITION MOVEMENT INDEX: | |||
| – 6-Week Change in Strength Index: | 53.8 | -52.5 | 35.5 |
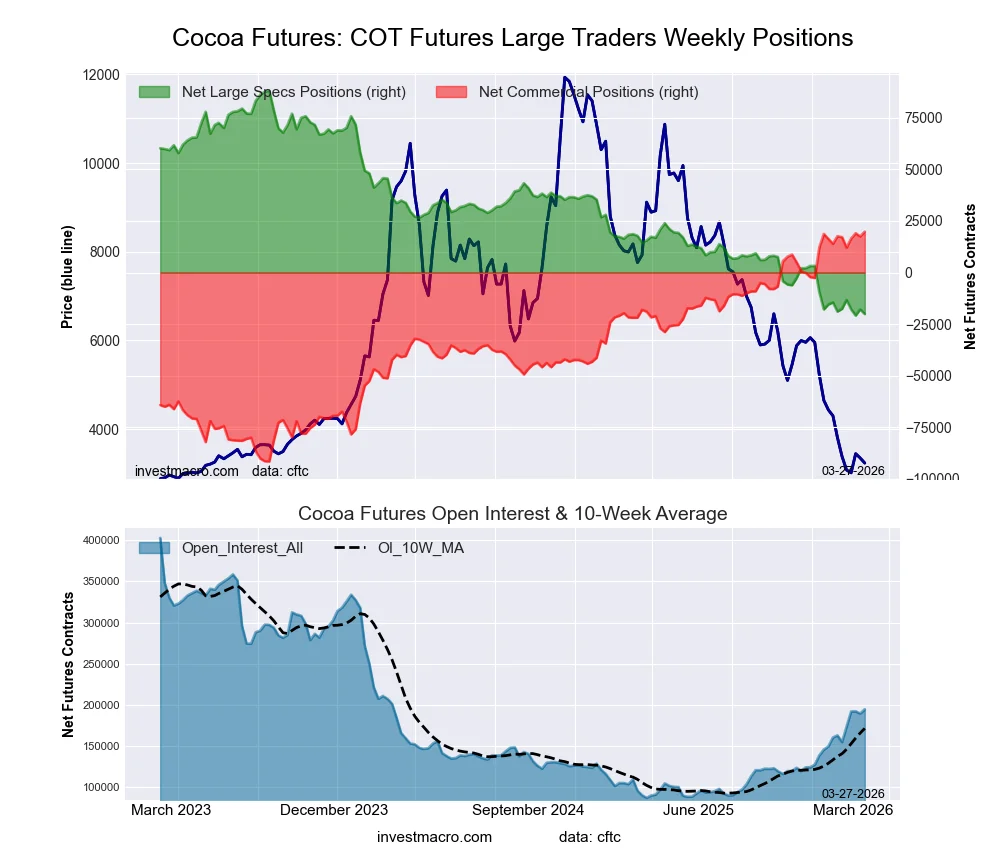
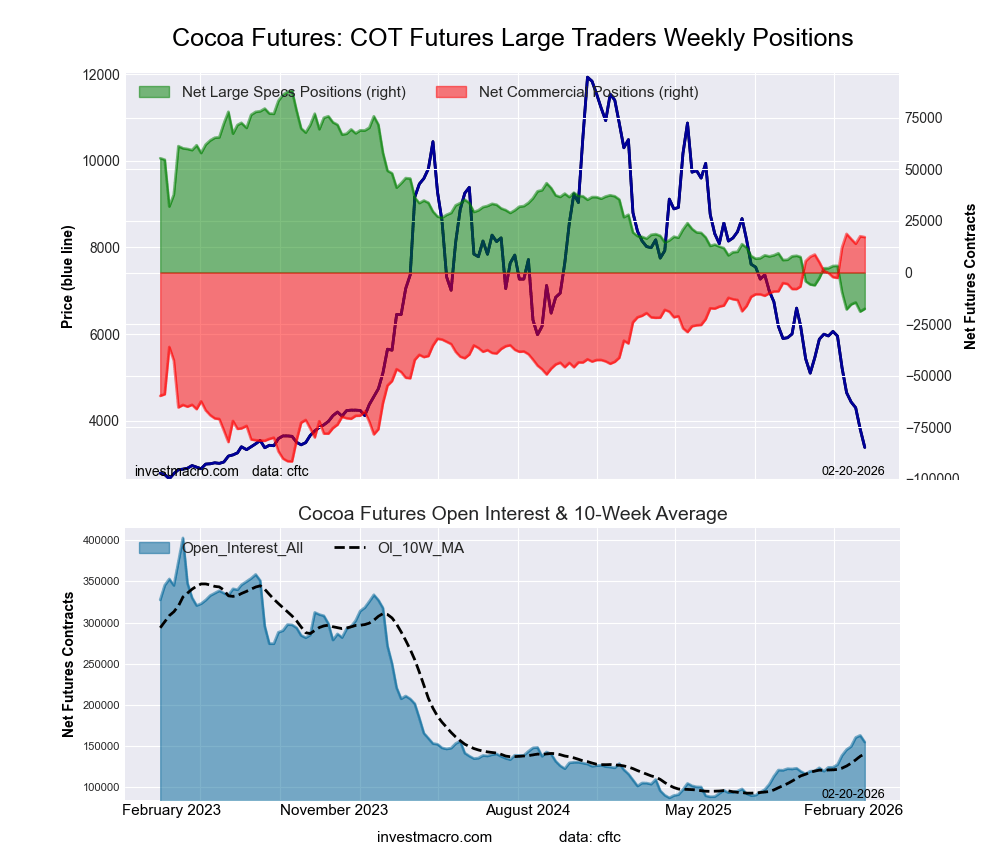
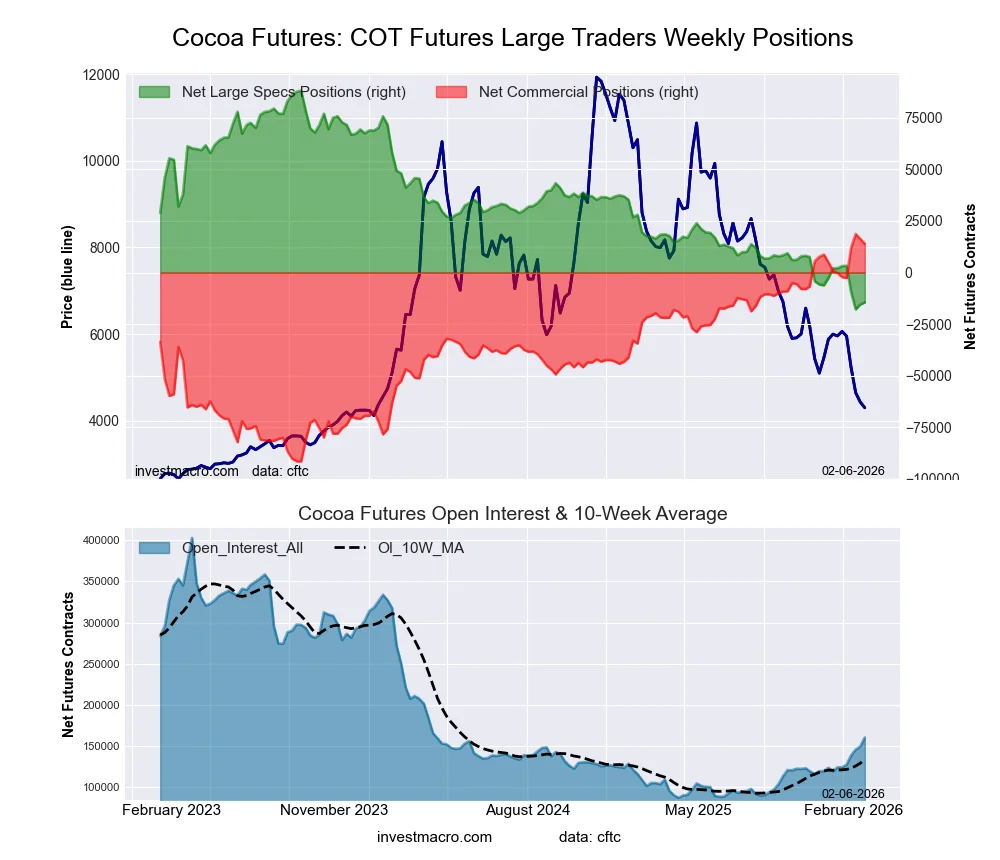
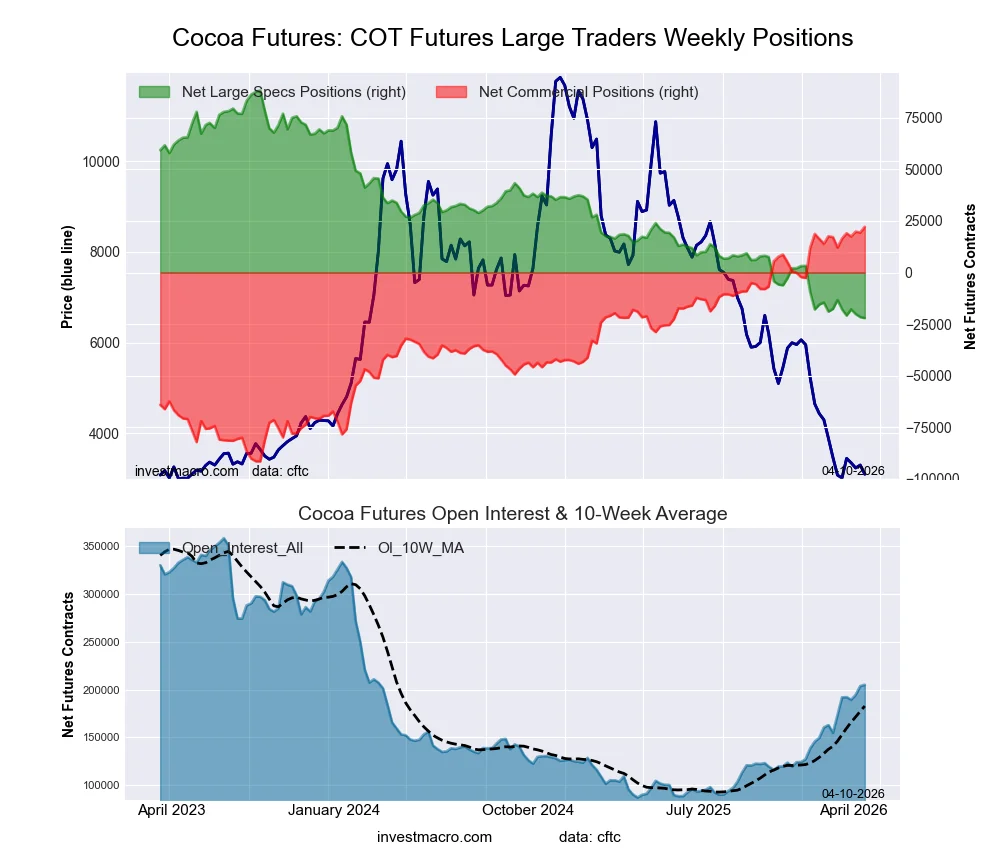
COCOA Futures:
 Positioning Notes:
- COCOA large speculator standing this week came in at a net position of -22,072 contracts in the data reported through Tuesday.
- Weekly Speculator position lowering of -471 contracts from the previous week which had a total of -21,601 net contracts.
- This week’s current strength score (range over the past 3 years, measured from 0 to 100) shows the speculators are currently Bearish-Extreme with a score of 0.0 percent.
- The Commercials are Bullish-Extreme with a score of 100.0 percent.
- The Small Traders (not shown in chart) are Bearish with a score of 26.0 percent.
Price Trend-Following Model: Downtrend
Our weekly trend-following model classifies the current market price position as: Downtrend.
| COCOA Futures Statistics | SPECULATORS | COMMERCIALS | SMALL TRADERS |
| – Percent of Open Interest Longs: | 21.7 | 50.6 | 5.3 |
| – Percent of Open Interest Shorts: | 32.4 | 39.8 | 5.4 |
| – Net Position: | -22,072 | 22,199 | -127 |
| – Gross Longs: | 44,385 | 103,762 | 10,928 |
| – Gross Shorts: | 66,457 | 81,563 | 11,055 |
| – Long to Short Ratio: | 0.7 to 1 | 1.3 to 1 | 1.0 to 1 |
| NET POSITION TREND: | |||
| – Strength Index Score (3 Year Range Pct): | 0.0 | 100.0 | 26.0 |
| – Strength Index Reading (3 Year Range): | Bearish-Extreme | Bullish-Extreme | Bearish |
| NET POSITION MOVEMENT INDEX: | |||
| – 6-Week Change in Strength Index: | -8.0 | 8.9 | -12.4 |
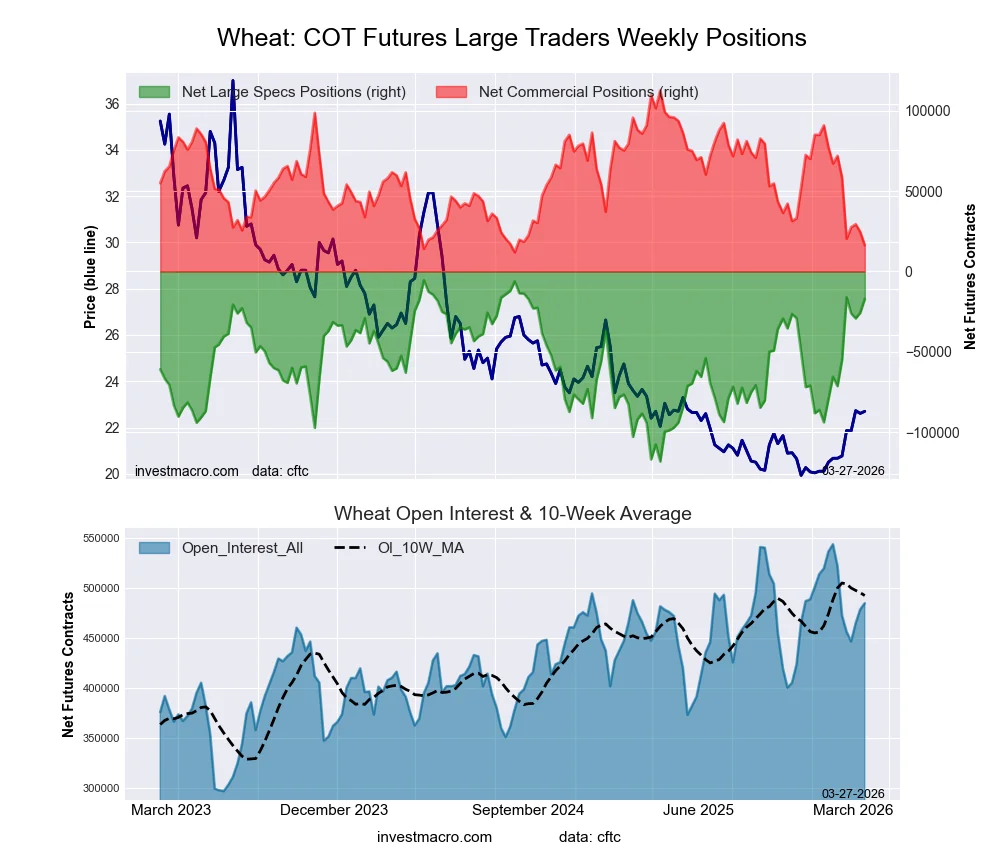
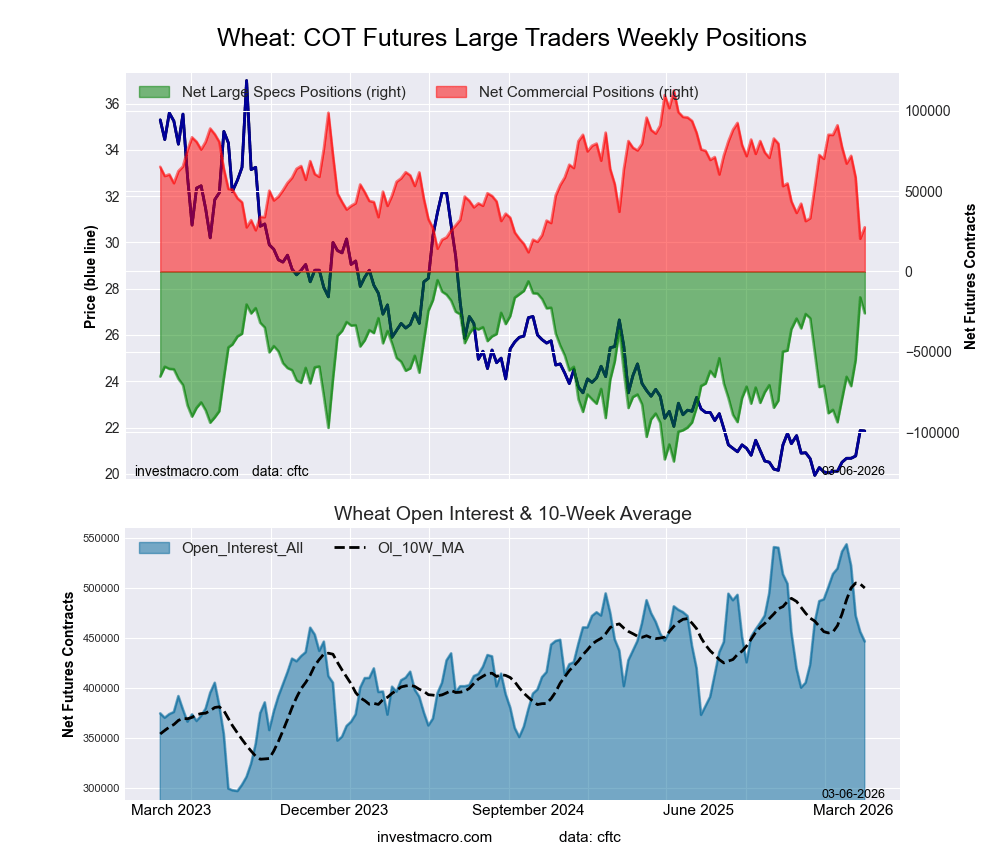
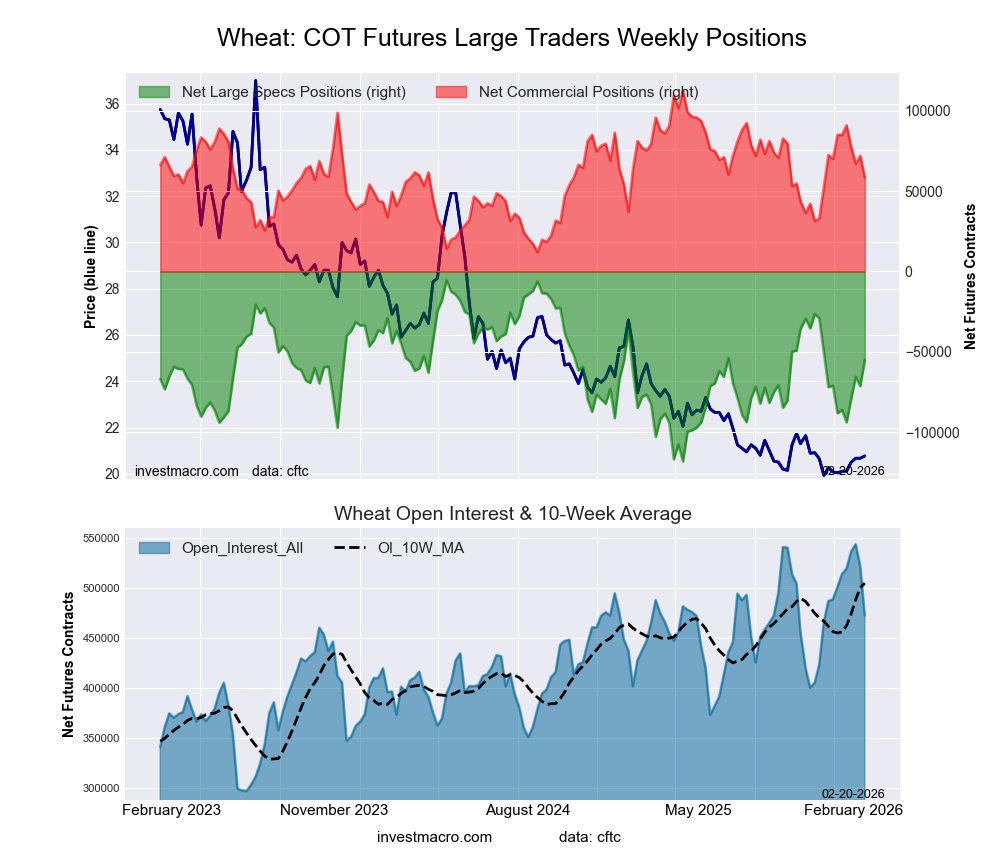
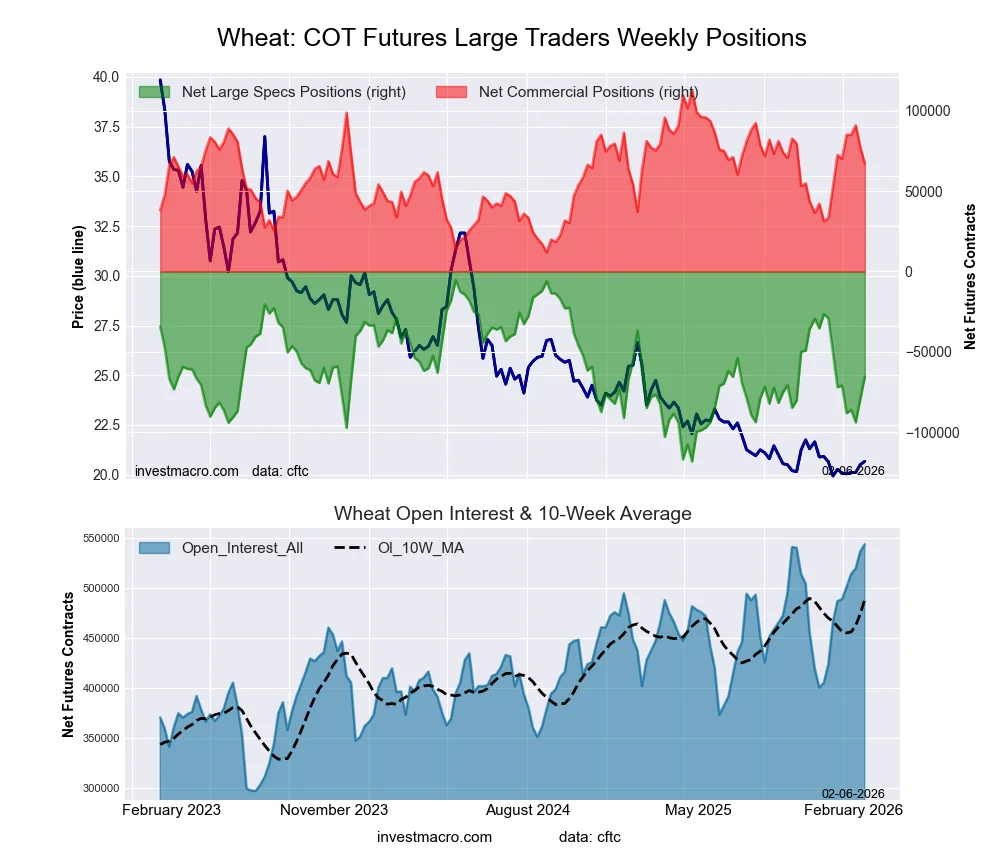
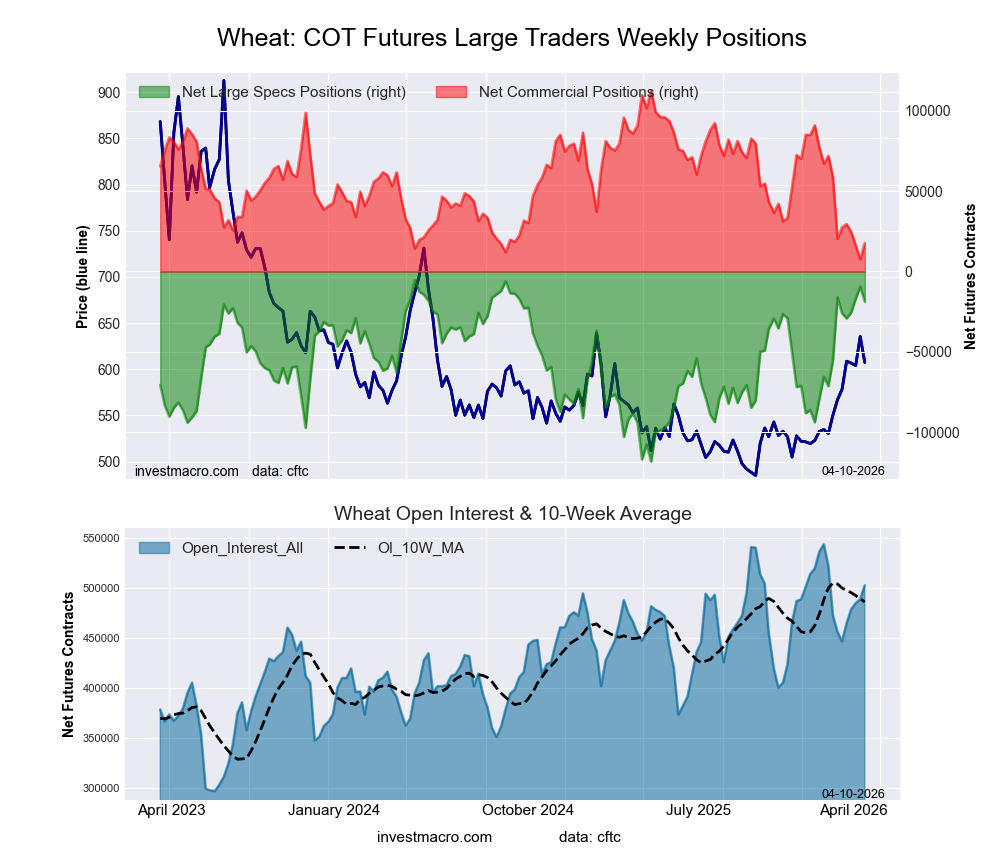
WHEAT Futures:
 Positioning Notes:
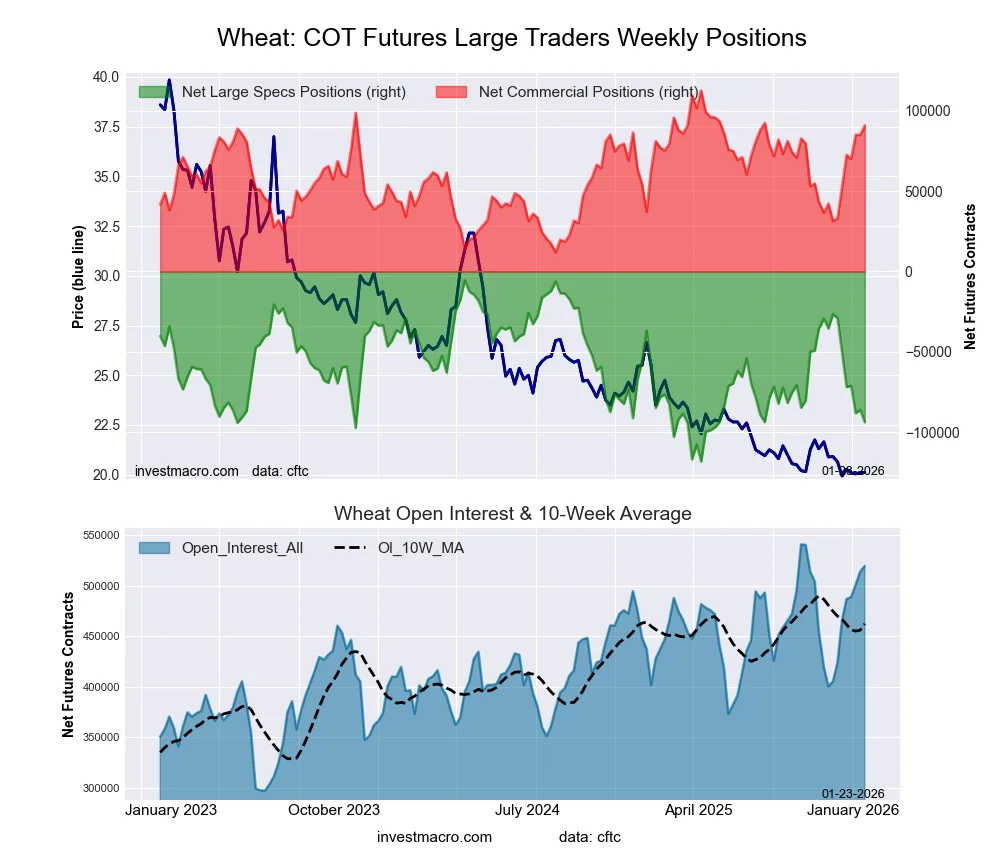
- WHEAT large speculator standing this week came in at a net position of -18,707 contracts in the data reported through Tuesday.
- Weekly Speculator position decline of -9,292 contracts from the previous week which had a total of -9,415 net contracts.
- This week’s current strength score (range over the past 3 years, measured from 0 to 100) shows the speculators are currently Bullish-Extreme with a score of 88.2 percent.
- The Commercials are Bearish-Extreme with a score of 9.6 percent.
- The Small Traders (not shown in chart) are Bullish with a score of 60.4 percent.
Price Trend-Following Model: Uptrend
Our weekly trend-following model classifies the current market price position as: Uptrend.
| WHEAT Futures Statistics | SPECULATORS | COMMERCIALS | SMALL TRADERS |
| – Percent of Open Interest Longs: | 27.5 | 35.0 | 6.6 |
| – Percent of Open Interest Shorts: | 31.2 | 31.5 | 6.4 |
| – Net Position: | -18,707 | 17,642 | 1,065 |
| – Gross Longs: | 138,222 | 175,867 | 33,066 |
| – Gross Shorts: | 156,929 | 158,225 | 32,001 |
| – Long to Short Ratio: | 0.9 to 1 | 1.1 to 1 | 1.0 to 1 |
| NET POSITION TREND: | |||
| – Strength Index Score (3 Year Range Pct): | 88.2 | 9.6 | 60.4 |
| – Strength Index Reading (3 Year Range): | Bullish-Extreme | Bearish-Extreme | Bullish |
| NET POSITION MOVEMENT INDEX: | |||
| – 6-Week Change in Strength Index: | -2.3 | -2.6 | 31.3 |
Article By InvestMacro – Receive our weekly COT Newsletter
*COT Report: The COT data, released weekly to the public each Friday, is updated through the most recent Tuesday (data is 3 days old) and shows a quick view of how large speculators or non-commercials (for-profit traders) were positioned in the futures markets.
The CFTC categorizes trader positions according to commercial hedgers (traders who use futures contracts for hedging as part of the business), non-commercials (large traders who speculate to realize trading profits) and nonreportable traders (usually small traders/speculators) as well as their open interest (contracts open in the market at time of reporting). See CFTC criteria here.