
By InvestMacro

Here are the latest charts and statistics for the Commitment of Traders (COT) data published by the Commodities Futures Trading Commission (CFTC).
The latest COT data is updated through Tuesday February 21st and shows a quick view of how large traders (for-profit speculators and commercial entities) were positioned in the futures markets.
*** This data is still a few weeks behind the current data because the CFTC up-to-date data has been delayed due to a cybersecurity event that happened in early February to ION Cleared Derivatives (a subsidiary of ION Markets). This hack of ION has created a problem for the large trader positions to be reported and reconciled. The CFTC has back-filled some data over the past few weeks and will get the data back up to date in the coming weeks.
Weekly Speculator Changes led by Copper & Gold
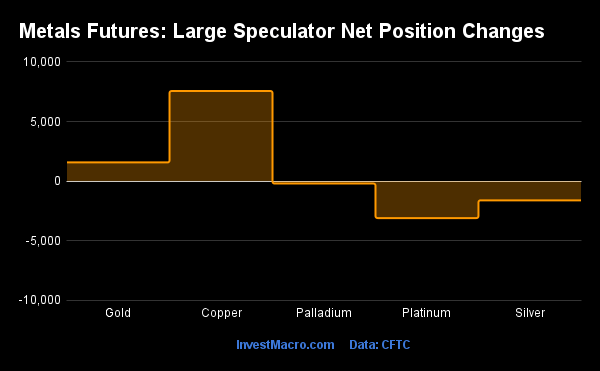
The COT metals markets speculator bets were lower through February 21st as two out of the five precious metals markets we cover had higher positioning while the other three markets had lower speculator contracts.
Leading the gains for the metals was Copper (7,560 contracts) with Gold (1,572 contracts) also seeing a positive week.
The markets with declines in speculator bets for the week were Platinum (-3,093 contracts), Silver (-1,604 contracts) and Palladium (-199 contracts) with also having lower bets through February 21st.
| Feb-21-2023 | OI | OI-Index | Spec-Net | Spec-Index | Com-Net | COM-Index | Smalls-Net | Smalls-Index |
|---|---|---|---|---|---|---|---|---|
| Gold | 422,648 | 0 | 107,101 | 21 | -129,355 | 77 | 22,254 | 36 |
| Silver | 123,906 | 3 | 9,902 | 32 | -23,050 | 66 | 13,148 | 39 |
| Copper | 219,205 | 58 | 2,049 | 35 | -8,510 | 62 | 6,461 | 63 |
| Palladium | 11,943 | 84 | -5,188 | 0 | 5,552 | 100 | -364 | 20 |
| Platinum | 67,499 | 58 | 2,905 | 22 | -8,394 | 76 | 5,489 | 42 |
Strength Scores led by Copper & Silver
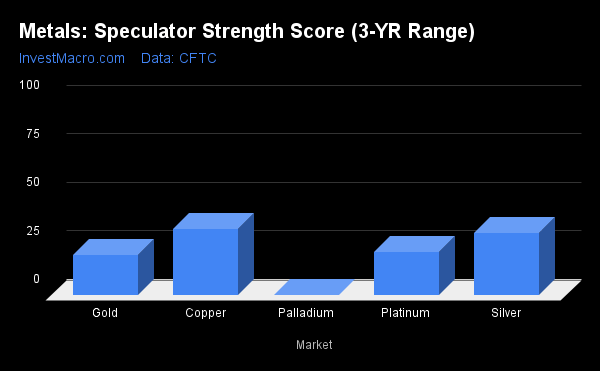
COT Strength Scores (a normalized measure of Speculator positions over a 3-Year range, from 0 to 100 where above 80 is Extreme-Bullish and below 20 is Extreme-Bearish) showed that the Copper (35 percent) led the metals markets through February 21st. Silver (32 percent) came in as the next highest in the weekly strength scores.
On the downside, Palladium (0 percent) comes in at the lowest strength level currently and is in Extreme-Bearish territory (below 20 percent). The next lowest strength score was Gold (21 percent).
Strength Statistics:
Gold (20.6 percent) vs Gold previous week (20.0 percent)
Silver (32.4 percent) vs Silver previous week (34.7 percent)
Copper (34.5 percent) vs Copper previous week (28.2 percent)
Platinum (22.3 percent) vs Platinum previous week (29.4 percent)
Palladium (0.0 percent) vs Palladium previous week (2.2 percent)
Copper & Gold top the 6-Week Strength Trends
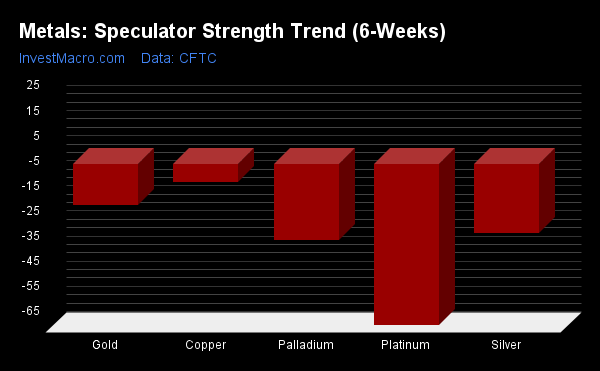
COT Strength Score Trends (or move index, calculates the 6-week changes in strength scores) showed that Copper (-7 percent) led the past six weeks trends for metals through February 21st as all metals were in negative trend territory.
Platinum (-64 percent) led the downside trend scores with Palladium (-30 percent) as the next market with lower trend scores.
Move Statistics:
Gold (-16.2 percent) vs Gold previous week (-13.5 percent)
Silver (-27.3 percent) vs Silver previous week (-27.7 percent)
Copper (-6.9 percent) vs Copper previous week (-0.7 percent)
Platinum (-64.2 percent) vs Platinum previous week (-56.6 percent)
Palladium (-30.2 percent) vs Palladium previous week (-27.4 percent)
Individual Markets:
Gold Comex Futures:
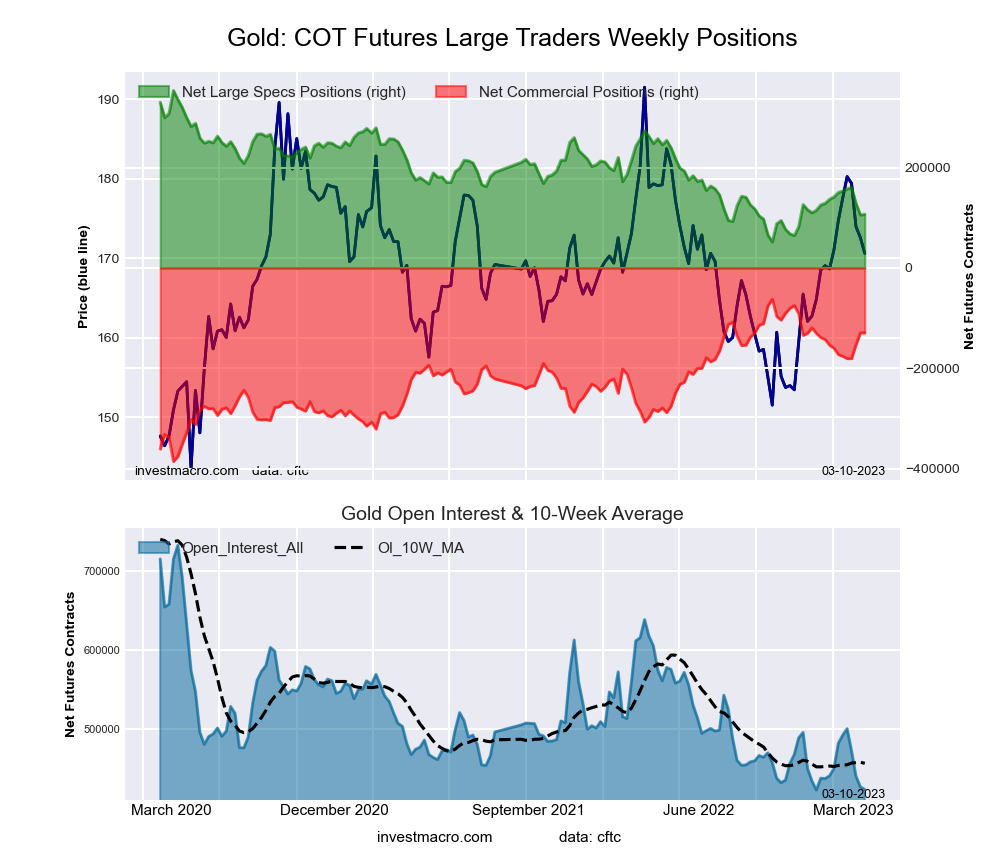 The Gold Comex Futures large speculator standing that week equaled a net position of 107,101 contracts in the data reported through Tuesday February 21st. This was a weekly rise of 1,572 contracts from the previous week which had a total of 105,529 net contracts.
The week’s current strength score (the trader positioning range over the past three years, measured from 0 to 100) shows the speculators are currently Bearish with a score of 20.6 percent. The commercials are Bullish with a score of 76.7 percent and the small traders (not shown in chart) are Bearish with a score of 35.7 percent.
| Gold Futures Statistics | SPECULATORS | COMMERCIALS | SMALL TRADERS |
| – Percent of Open Interest Longs: | 49.7 | 28.2 | 10.4 |
| – Percent of Open Interest Shorts: | 24.4 | 58.8 | 5.1 |
| – Net Position: | 107,101 | -129,355 | 22,254 |
| – Gross Longs: | 210,185 | 119,040 | 43,956 |
| – Gross Shorts: | 103,084 | 248,395 | 21,702 |
| – Long to Short Ratio: | 2.0 to 1 | 0.5 to 1 | 2.0 to 1 |
| NET POSITION TREND: | |||
| – Strength Index Score (3 Year Range Pct): | 20.6 | 76.7 | 35.7 |
| – Strength Index Reading (3 Year Range): | Bearish | Bullish | Bearish |
| NET POSITION MOVEMENT INDEX: | |||
| – 6-Week Change in Strength Index: | -16.2 | 14.9 | 0.8 |
Silver Comex Futures:
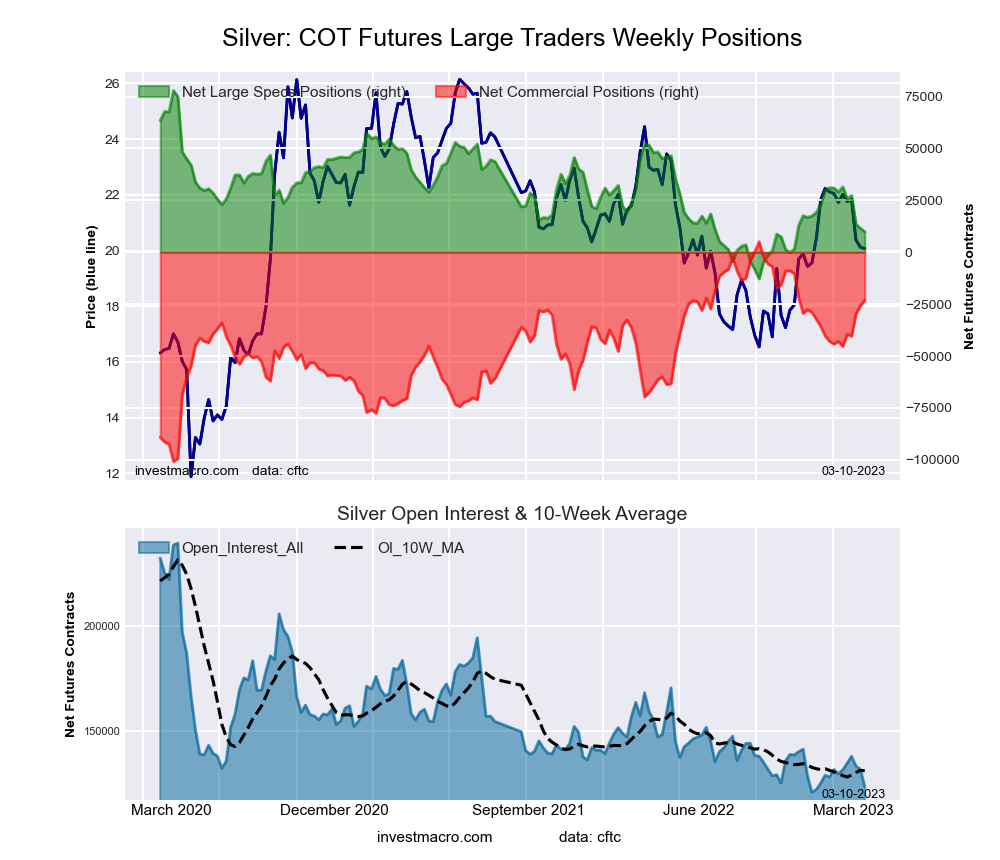 The Silver Comex Futures large speculator standing equaled a net position of 9,902 contracts in the data reported through Tuesday February 21st. This was a weekly reduction of -1,604 contracts from the previous week which had a total of 11,506 net contracts.
The week’s current strength score (the trader positioning range over the past three years, measured from 0 to 100) shows the speculators are currently Bearish with a score of 32.4 percent. The commercials are Bullish with a score of 66.0 percent and the small traders (not shown in chart) are Bearish with a score of 39.4 percent.
| Silver Futures Statistics | SPECULATORS | COMMERCIALS | SMALL TRADERS |
| – Percent of Open Interest Longs: | 36.3 | 36.6 | 19.9 |
| – Percent of Open Interest Shorts: | 28.3 | 55.2 | 9.3 |
| – Net Position: | 9,902 | -23,050 | 13,148 |
| – Gross Longs: | 44,985 | 45,388 | 24,663 |
| – Gross Shorts: | 35,083 | 68,438 | 11,515 |
| – Long to Short Ratio: | 1.3 to 1 | 0.7 to 1 | 2.1 to 1 |
| NET POSITION TREND: | |||
| – Strength Index Score (3 Year Range Pct): | 32.4 | 66.0 | 39.4 |
| – Strength Index Reading (3 Year Range): | Bearish | Bullish | Bearish |
| NET POSITION MOVEMENT INDEX: | |||
| – 6-Week Change in Strength Index: | -27.3 | 24.1 | -4.3 |
Copper Grade #1 Futures:
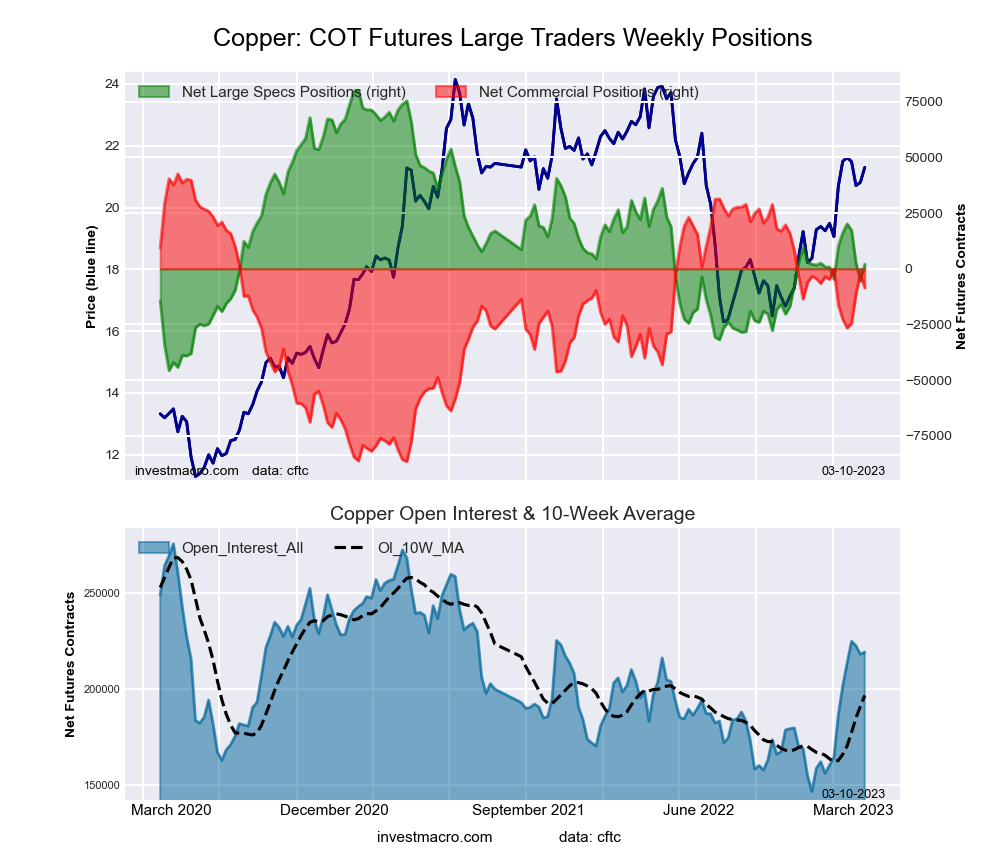 The Copper Grade #1 Futures large speculator standing equaled a net position of 2,049 contracts in the data reported through Tuesday February 21st. This was a weekly boost of 7,560 contracts from the previous week which had a total of -5,511 net contracts.
The week’s current strength score (the trader positioning range over the past three years, measured from 0 to 100) shows the speculators are currently Bearish with a score of 34.5 percent. The commercials are Bullish with a score of 61.6 percent and the small traders (not shown in chart) are Bullish with a score of 62.6 percent.
| Copper Futures Statistics | SPECULATORS | COMMERCIALS | SMALL TRADERS |
| – Percent of Open Interest Longs: | 33.5 | 42.9 | 9.4 |
| – Percent of Open Interest Shorts: | 32.5 | 46.8 | 6.4 |
| – Net Position: | 2,049 | -8,510 | 6,461 |
| – Gross Longs: | 73,395 | 94,047 | 20,560 |
| – Gross Shorts: | 71,346 | 102,557 | 14,099 |
| – Long to Short Ratio: | 1.0 to 1 | 0.9 to 1 | 1.5 to 1 |
| NET POSITION TREND: | |||
| – Strength Index Score (3 Year Range Pct): | 34.5 | 61.6 | 62.6 |
| – Strength Index Reading (3 Year Range): | Bearish | Bullish | Bullish |
| NET POSITION MOVEMENT INDEX: | |||
| – 6-Week Change in Strength Index: | -6.9 | 6.1 | 2.5 |
Platinum Futures:
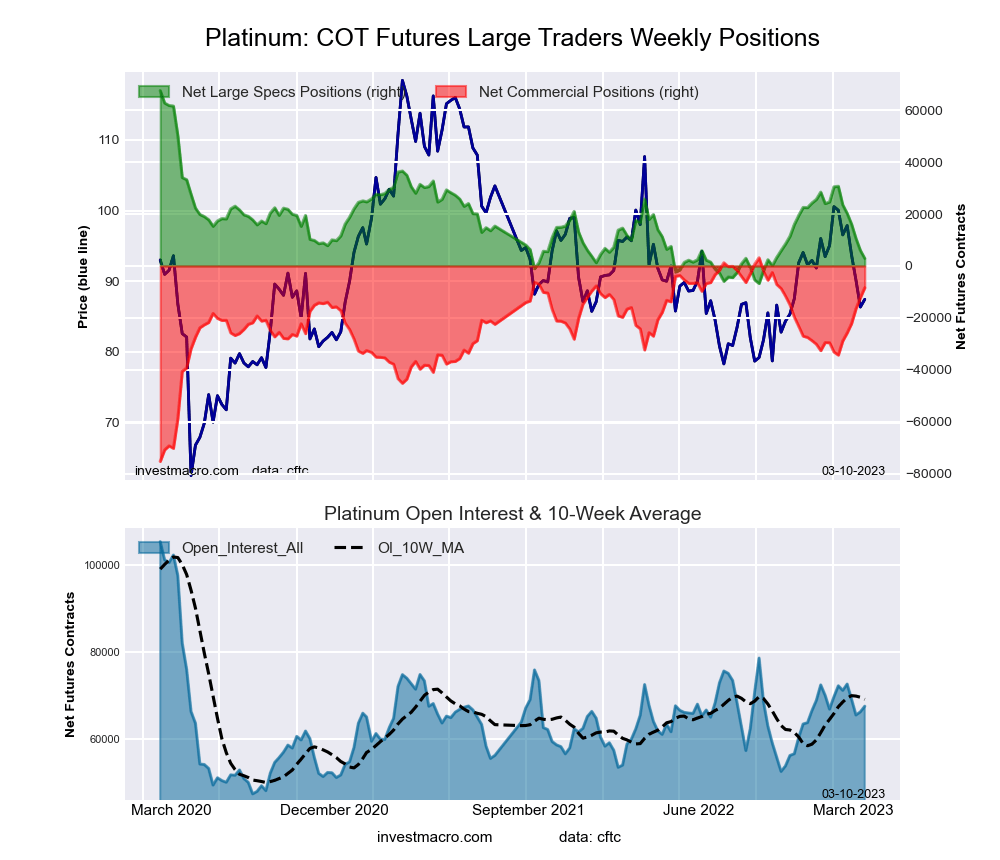 The Platinum Futures large speculator standing equaled a net position of 2,905 contracts in the data reported through Tuesday February 21st. This was a weekly decrease of -3,093 contracts from the previous week which had a total of 5,998 net contracts.
The week’s current strength score (the trader positioning range over the past three years, measured from 0 to 100) shows the speculators are currently Bearish with a score of 22.3 percent. The commercials are Bullish with a score of 76.1 percent and the small traders (not shown in chart) are Bearish with a score of 41.6 percent.
| Platinum Futures Statistics | SPECULATORS | COMMERCIALS | SMALL TRADERS |
| – Percent of Open Interest Longs: | 41.6 | 38.0 | 12.8 |
| – Percent of Open Interest Shorts: | 37.3 | 50.4 | 4.7 |
| – Net Position: | 2,905 | -8,394 | 5,489 |
| – Gross Longs: | 28,058 | 25,638 | 8,655 |
| – Gross Shorts: | 25,153 | 34,032 | 3,166 |
| – Long to Short Ratio: | 1.1 to 1 | 0.8 to 1 | 2.7 to 1 |
| NET POSITION TREND: | |||
| – Strength Index Score (3 Year Range Pct): | 22.3 | 76.1 | 41.6 |
| – Strength Index Reading (3 Year Range): | Bearish | Bullish | Bearish |
| NET POSITION MOVEMENT INDEX: | |||
| – 6-Week Change in Strength Index: | -64.2 | 53.7 | 24.5 |
Palladium Futures:
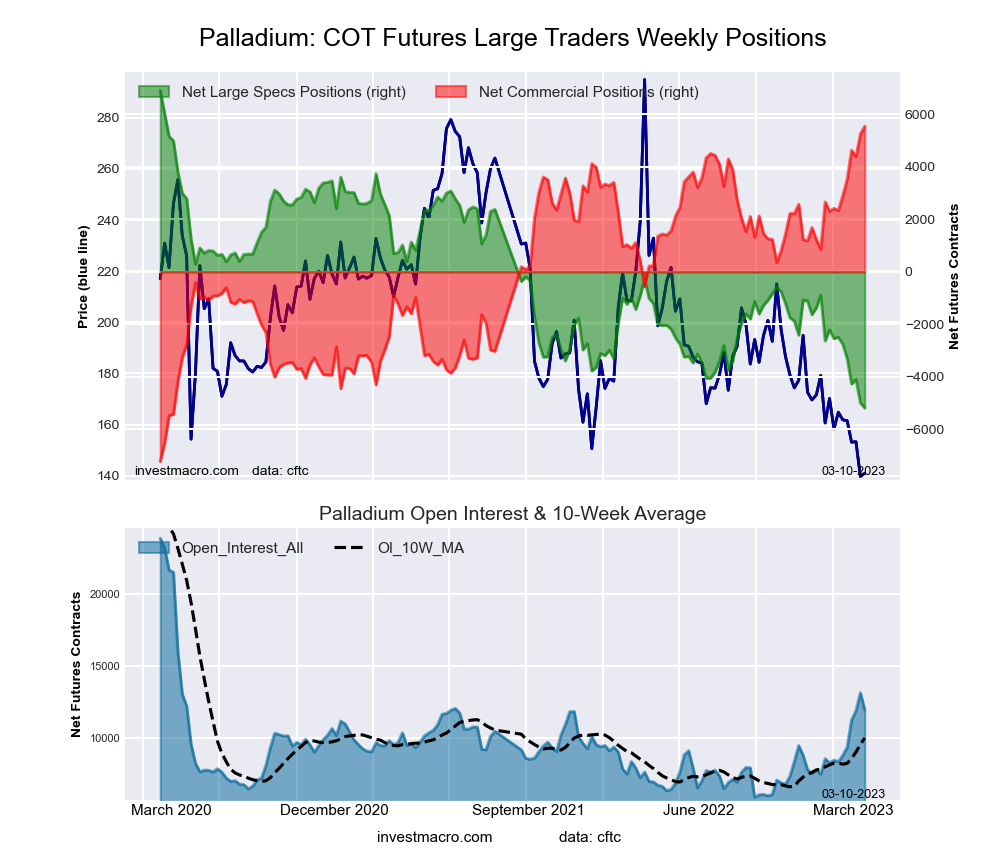 The Palladium Futures large speculator standing equaled a net position of -5,188 contracts in the data reported through Tuesday February 21st. This was a weekly decrease of -199 contracts from the previous week which had a total of -4,989 net contracts.
The week’s current strength score (the trader positioning range over the past three years, measured from 0 to 100) shows the speculators are currently Bearish-Extreme with a score of 0.0 percent. The commercials are Bullish-Extreme with a score of 100.0 percent and the small traders (not shown in chart) are Bearish-Extreme with a score of 19.8 percent.
| Palladium Futures Statistics | SPECULATORS | COMMERCIALS | SMALL TRADERS |
| – Percent of Open Interest Longs: | 16.0 | 68.3 | 11.5 |
| – Percent of Open Interest Shorts: | 59.5 | 21.8 | 14.5 |
| – Net Position: | -5,188 | 5,552 | -364 |
| – Gross Longs: | 1,913 | 8,159 | 1,372 |
| – Gross Shorts: | 7,101 | 2,607 | 1,736 |
| – Long to Short Ratio: | 0.3 to 1 | 3.1 to 1 | 0.8 to 1 |
| NET POSITION TREND: | |||
| – Strength Index Score (3 Year Range Pct): | 0.0 | 100.0 | 19.8 |
| – Strength Index Reading (3 Year Range): | Bearish-Extreme | Bullish-Extreme | Bearish-Extreme |
| NET POSITION MOVEMENT INDEX: | |||
| – 6-Week Change in Strength Index: | -30.2 | 32.2 | -31.1 |
Article By InvestMacro – Receive our weekly COT Newsletter
*COT Report: The COT data, released weekly to the public each Friday, is updated through the most recent Tuesday (data is 3 days old) and shows a quick view of how large speculators or non-commercials (for-profit traders) were positioned in the futures markets.
The CFTC categorizes trader positions according to commercial hedgers (traders who use futures contracts for hedging as part of the business), non-commercials (large traders who speculate to realize trading profits) and nonreportable traders (usually small traders/speculators) as well as their open interest (contracts open in the market at time of reporting). See CFTC criteria here.


