By InvestMacro
Here are the latest charts and statistics for the Commitment of Traders (COT) data published by the Commodities Futures Trading Commission (CFTC).
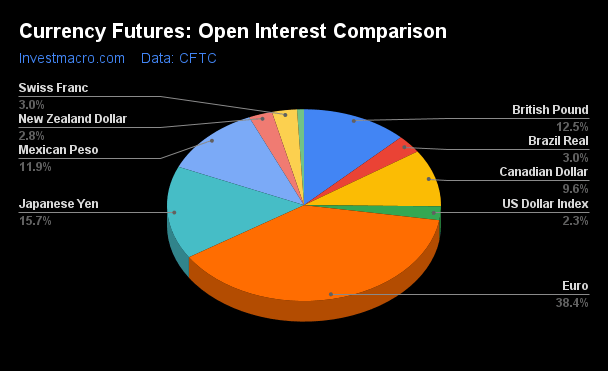
The latest COT data is updated through Tuesday September 26th and shows a quick view of how large market participants (for-profit speculators and commercial traders) were positioned in the futures markets. All currency positions are in direct relation to the US dollar where, for example, a bet for the euro is a bet that the euro will rise versus the dollar while a bet against the euro will be a bet that the euro will decline versus the dollar.
Weekly Speculator Changes led by New Zealand Dollar & Brazilian Real

The COT currency market speculator bets were higher this week as six out of the eleven currency markets we cover had higher positioning while the other five markets had lower speculator contracts.
Leading the gains for the currency markets was the Canadian Dollar (15,331 contracts) with the Australian Dollar (10,131 contracts), the New Zealand Dollar (6,091 contracts), the Brazilian Real (2,705 contracts), the US Dollar Index (1,124 contracts) and Bitcoin (197 contracts) also showing positive weeks.
The currencies seeing declines in speculator bets on the week were the British Pound (-18,014 contracts), the Japanese Yen (-7,893 contracts), the EuroFX (-3,582 contracts), the Swiss Franc (-1,180 contracts) and the Mexican Peso (-3,017 contracts) also registering lower bets on the week.
US Dollar Index Bullish Bets rise for 4th straight week to 38-week high
Highlighting the COT currency’s data this week is the rise of the speculator’s positioning in the US Dollar Index.
The large speculative US Dollar Index positions rose for a fourth straight week this week with the speculator position gaining by a total of +13,935 contracts over this last four-week span.
This renewed bullishness has brought the US Dollar Index speculator net position (currently at a total of +16,758 contracts) to a new 38-week high, dating back to January 3rd of this year when the speculator’s net position was at a total of +17,761 contracts.
The average weekly speculator position over 2023 has been a modest +11,409 contracts thus far. This follows a strong 2022 where the weekly average speculator position was +33,606 contracts.
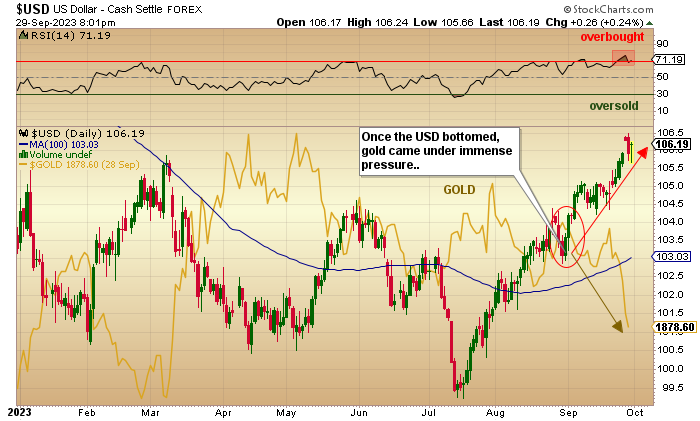
The US Dollar Index price also soared over the course of 2022 and hit multi-decade highs with a top at 114.75 price level before retreating into the end of 2022. The Dollar Index has had an topsy-turvy 2023 with an early peak over 105 but then a lower valley that saw a decline to under the 100.00 price level in July. Since then, the Dollar Index has been on a strong run and is currently on a streak of gains for eleven consecutive weeks and closed this week back above the 105.00 level.
| Sep-26-2023 | OI | OI-Index | Spec-Net | Spec-Index | Com-Net | COM-Index | Smalls-Net | Smalls-Index |
|---|
| USD Index | 42,373 | 41 | 16,758 | 53 | -18,636 | 46 | 1,878 | 29 |
| EUR | 699,271 | 37 | 98,399 | 62 | -124,407 | 43 | 26,008 | 20 |
| GBP | 227,843 | 54 | 15,669 | 67 | -8,687 | 41 | -6,982 | 44 |
| JPY | 285,974 | 100 | -109,512 | 5 | 120,227 | 94 | -10,715 | 32 |
| CHF | 53,900 | 84 | -9,115 | 32 | 20,914 | 77 | -11,799 | 19 |
| CAD | 175,848 | 45 | -32,696 | 24 | 29,819 | 76 | 2,877 | 29 |
| AUD | 211,882 | 67 | -86,815 | 9 | 102,250 | 94 | -15,435 | 15 |
| NZD | 50,757 | 58 | -15,181 | 16 | 18,421 | 87 | -3,240 | 11 |
| MXN | 216,906 | 43 | 60,633 | 76 | -64,635 | 23 | 4,002 | 37 |
| RUB | 20,930 | 4 | 7,543 | 31 | -7,150 | 69 | -393 | 24 |
| BRL | 55,588 | 47 | 15,558 | 56 | -18,138 | 42 | 2,580 | 58 |
| Bitcoin | 14,844 | 68 | 1,794 | 93 | -2,033 | 0 | 239 | 18 |
Strength Scores led by Bitcoin & Mexican Peso
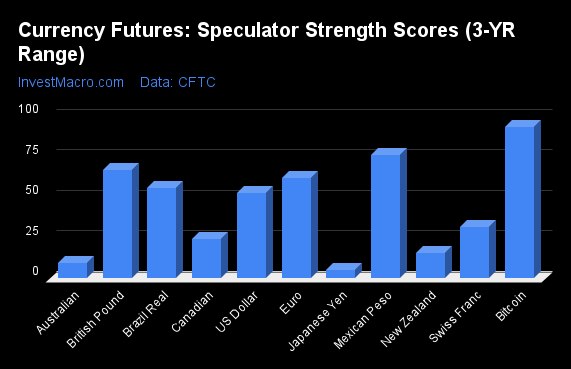
COT Strength Scores (a normalized measure of Speculator positions over a 3-Year range, from 0 to 100 where above 80 is Extreme-Bullish and below 20 is Extreme-Bearish) showed that Bitcoin (93 percent) and the Mexican Peso (76 percent) led the currency markets this week. The British Pound (67 percent), EuroFX (62 percent) and the Brazilian Real (56 percent) came in as the next highest in the weekly strength scores.
On the downside, the Japanese Yen (5 percent), the Australian Dollar (9 percent) and the New Zealand Dollar (16 percent) were at the lowest strength levels currently and are in Extreme-Bearish territory (below 20 percent).
Strength Statistics:
US Dollar Index (52.9 percent) vs US Dollar Index previous week (51.0 percent)
EuroFX (62.2 percent) vs EuroFX previous week (63.7 percent)
British Pound Sterling (66.6 percent) vs British Pound Sterling previous week (79.1 percent)
Japanese Yen (5.0 percent) vs Japanese Yen previous week (9.7 percent)
Swiss Franc (31.6 percent) vs Swiss Franc previous week (34.8 percent)
Canadian Dollar (24.1 percent) vs Canadian Dollar previous week (9.8 percent)
Australian Dollar (9.3 percent) vs Australian Dollar previous week (0.0 percent)
New Zealand Dollar (15.9 percent) vs New Zealand Dollar previous week (0.0 percent)
Mexican Peso (76.1 percent) vs Mexican Peso previous week (78.0 percent)
Brazilian Real (55.6 percent) vs Brazilian Real previous week (52.1 percent)
Bitcoin (93.4 percent) vs Bitcoin previous week (90.4 percent)
Bitcoin & US Dollar Index top the 6-Week Strength Trends
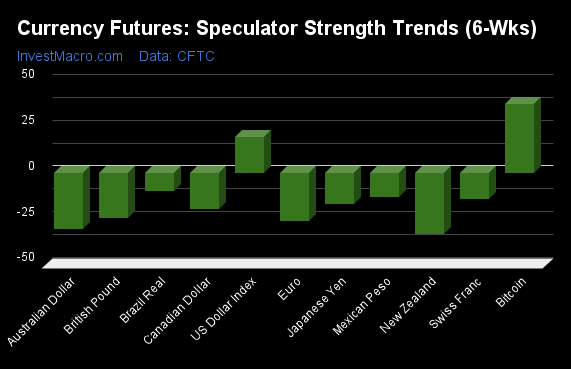
COT Strength Score Trends (or move index, calculates the 6-week changes in strength scores) showed that the Bitcoin (38 percent) and the US Dollar Index (20 percent) lead the past six weeks trends for the currencies and were the only currencies in positive trends.
The New Zealand Dollar (-33 percent) leads the downside trend scores currently with the Australian Dollar (-31 percent), EuroFX (-26 percent) and the British Pound (-25 percent) following next with lower trend scores.
Strength Trend Statistics:
US Dollar Index (19.6 percent) vs US Dollar Index previous week (21.7 percent)
EuroFX (-26.2 percent) vs EuroFX previous week (-20.4 percent)
British Pound Sterling (-24.5 percent) vs British Pound Sterling previous week (-9.3 percent)
Japanese Yen (-17.0 percent) vs Japanese Yen previous week (-10.9 percent)
Swiss Franc (-14.0 percent) vs Swiss Franc previous week (-6.8 percent)
Canadian Dollar (-19.8 percent) vs Canadian Dollar previous week (-44.2 percent)
Australian Dollar (-30.6 percent) vs Australian Dollar previous week (-49.2 percent)
New Zealand Dollar (-33.2 percent) vs New Zealand Dollar previous week (-54.4 percent)
Mexican Peso (-13.1 percent) vs Mexican Peso previous week (-12.2 percent)
Brazilian Real (-10.1 percent) vs Brazilian Real previous week (-19.3 percent)
Bitcoin (37.7 percent) vs Bitcoin previous week (41.3 percent)
Individual COT Forex Markets:
US Dollar Index Futures:
 The US Dollar Index large speculator standing this week resulted in a net position of 16,758 contracts in the data reported through Tuesday. This was a weekly increase of 1,124 contracts from the previous week which had a total of 15,634 net contracts.
This week’s current strength score (the trader positioning range over the past three years, measured from 0 to 100) shows the speculators are currently Bullish with a score of 52.9 percent. The commercials are Bearish with a score of 46.2 percent and the small traders (not shown in chart) are Bearish with a score of 28.5 percent.
Price Trend-Following Model: Strong Uptrend
Our weekly trend-following model classifies the current market price position as: Strong Uptrend. The current action for the model is considered to be: Hold – Maintain Long Position.
| US DOLLAR INDEX Statistics | SPECULATORS | COMMERCIALS | SMALL TRADERS |
| – Percent of Open Interest Longs: | 62.8 | 22.5 | 11.5 |
| – Percent of Open Interest Shorts: | 23.2 | 66.5 | 7.1 |
| – Net Position: | 16,758 | -18,636 | 1,878 |
| – Gross Longs: | 26,606 | 9,545 | 4,877 |
| – Gross Shorts: | 9,848 | 28,181 | 2,999 |
| – Long to Short Ratio: | 2.7 to 1 | 0.3 to 1 | 1.6 to 1 |
| NET POSITION TREND: | | | |
| – Strength Index Score (3 Year Range Pct): | 52.9 | 46.2 | 28.5 |
| – Strength Index Reading (3 Year Range): | Bullish | Bearish | Bearish |
| NET POSITION MOVEMENT INDEX: | | | |
| – 6-Week Change in Strength Index: | 19.6 | -20.0 | 10.2 |
Euro Currency Futures:
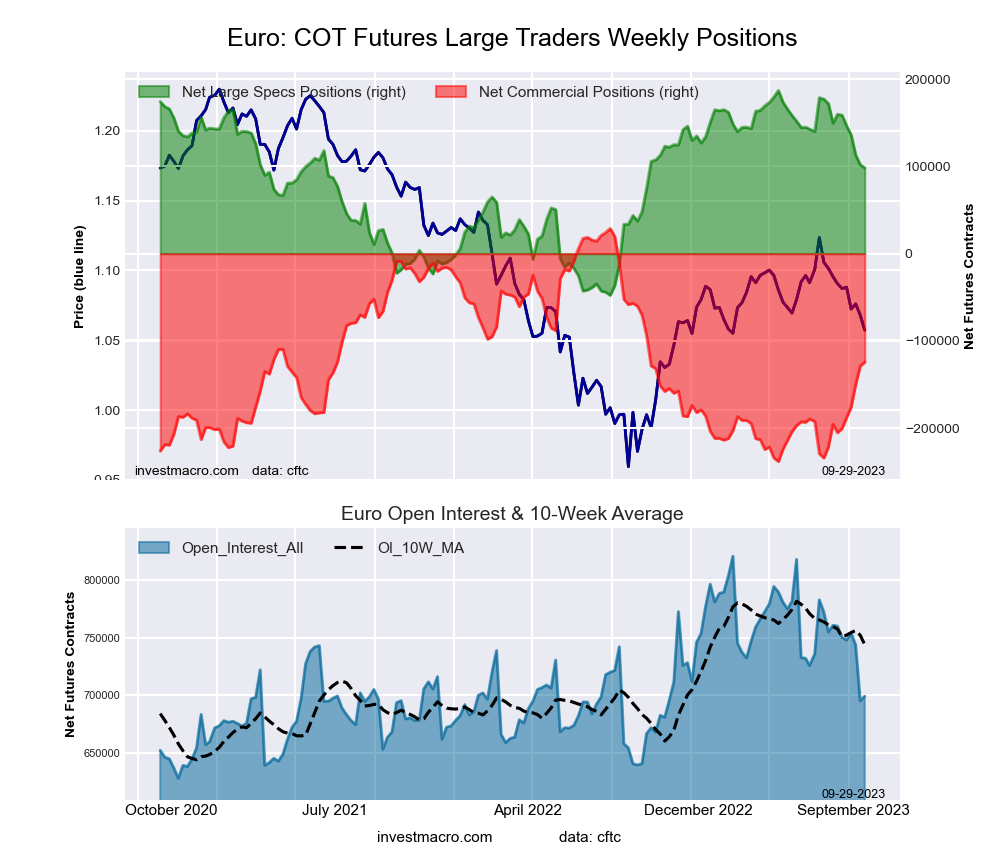 The Euro Currency large speculator standing this week resulted in a net position of 98,399 contracts in the data reported through Tuesday. This was a weekly reduction of -3,582 contracts from the previous week which had a total of 101,981 net contracts.
This week’s current strength score (the trader positioning range over the past three years, measured from 0 to 100) shows the speculators are currently Bullish with a score of 62.2 percent. The commercials are Bearish with a score of 42.6 percent and the small traders (not shown in chart) are Bearish with a score of 20.5 percent.
Price Trend-Following Model: Strong Downtrend
Our weekly trend-following model classifies the current market price position as: Strong Downtrend. The current action for the model is considered to be: Hold – Maintain Short Position.
| EURO Currency Statistics | SPECULATORS | COMMERCIALS | SMALL TRADERS |
| – Percent of Open Interest Longs: | 30.2 | 55.3 | 11.8 |
| – Percent of Open Interest Shorts: | 16.2 | 73.1 | 8.0 |
| – Net Position: | 98,399 | -124,407 | 26,008 |
| – Gross Longs: | 211,516 | 387,030 | 82,167 |
| – Gross Shorts: | 113,117 | 511,437 | 56,159 |
| – Long to Short Ratio: | 1.9 to 1 | 0.8 to 1 | 1.5 to 1 |
| NET POSITION TREND: | | | |
| – Strength Index Score (3 Year Range Pct): | 62.2 | 42.6 | 20.5 |
| – Strength Index Reading (3 Year Range): | Bullish | Bearish | Bearish |
| NET POSITION MOVEMENT INDEX: | | | |
| – 6-Week Change in Strength Index: | -26.2 | 30.3 | -31.0 |
British Pound Sterling Futures:
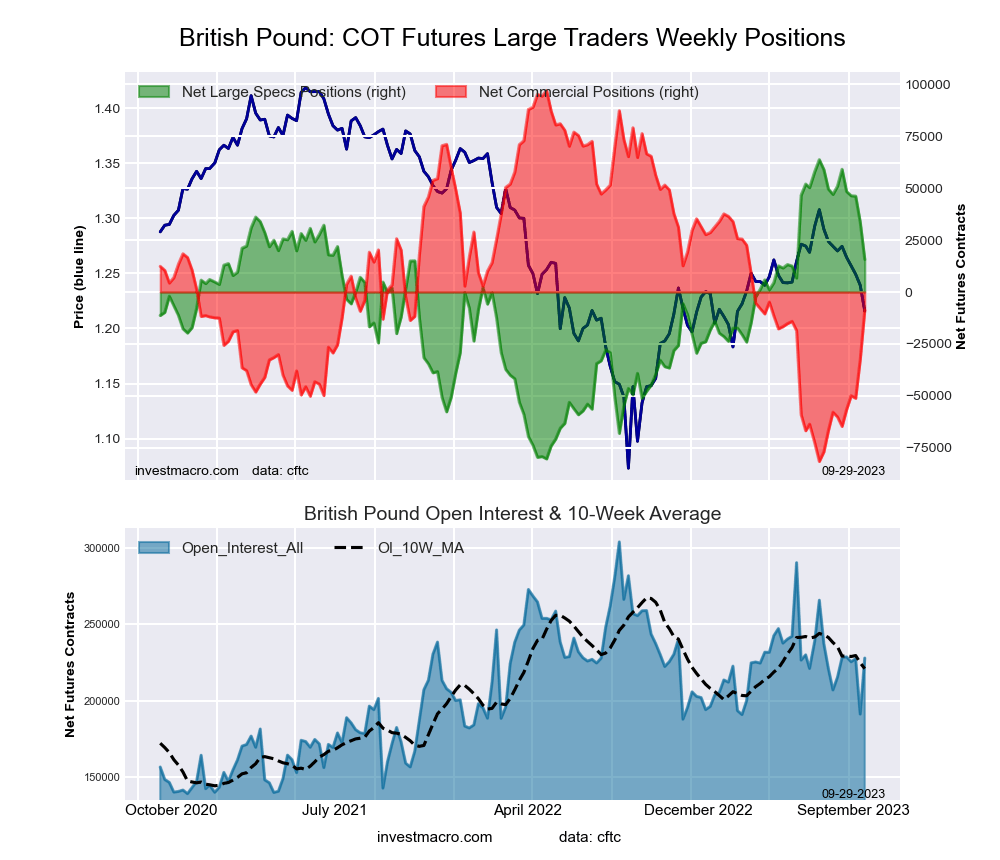 The British Pound Sterling large speculator standing this week resulted in a net position of 15,669 contracts in the data reported through Tuesday. This was a weekly lowering of -18,014 contracts from the previous week which had a total of 33,683 net contracts.
This week’s current strength score (the trader positioning range over the past three years, measured from 0 to 100) shows the speculators are currently Bullish with a score of 66.6 percent. The commercials are Bearish with a score of 40.8 percent and the small traders (not shown in chart) are Bearish with a score of 44.3 percent.
Price Trend-Following Model: Strong Downtrend
Our weekly trend-following model classifies the current market price position as: Strong Downtrend. The current action for the model is considered to be: Hold – Maintain Short Position.
| BRITISH POUND Statistics | SPECULATORS | COMMERCIALS | SMALL TRADERS |
| – Percent of Open Interest Longs: | 37.2 | 48.0 | 11.6 |
| – Percent of Open Interest Shorts: | 30.3 | 51.8 | 14.6 |
| – Net Position: | 15,669 | -8,687 | -6,982 |
| – Gross Longs: | 84,750 | 109,264 | 26,381 |
| – Gross Shorts: | 69,081 | 117,951 | 33,363 |
| – Long to Short Ratio: | 1.2 to 1 | 0.9 to 1 | 0.8 to 1 |
| NET POSITION TREND: | | | |
| – Strength Index Score (3 Year Range Pct): | 66.6 | 40.8 | 44.3 |
| – Strength Index Reading (3 Year Range): | Bullish | Bearish | Bearish |
| NET POSITION MOVEMENT INDEX: | | | |
| – 6-Week Change in Strength Index: | -24.5 | 28.8 | -31.7 |
Japanese Yen Futures:
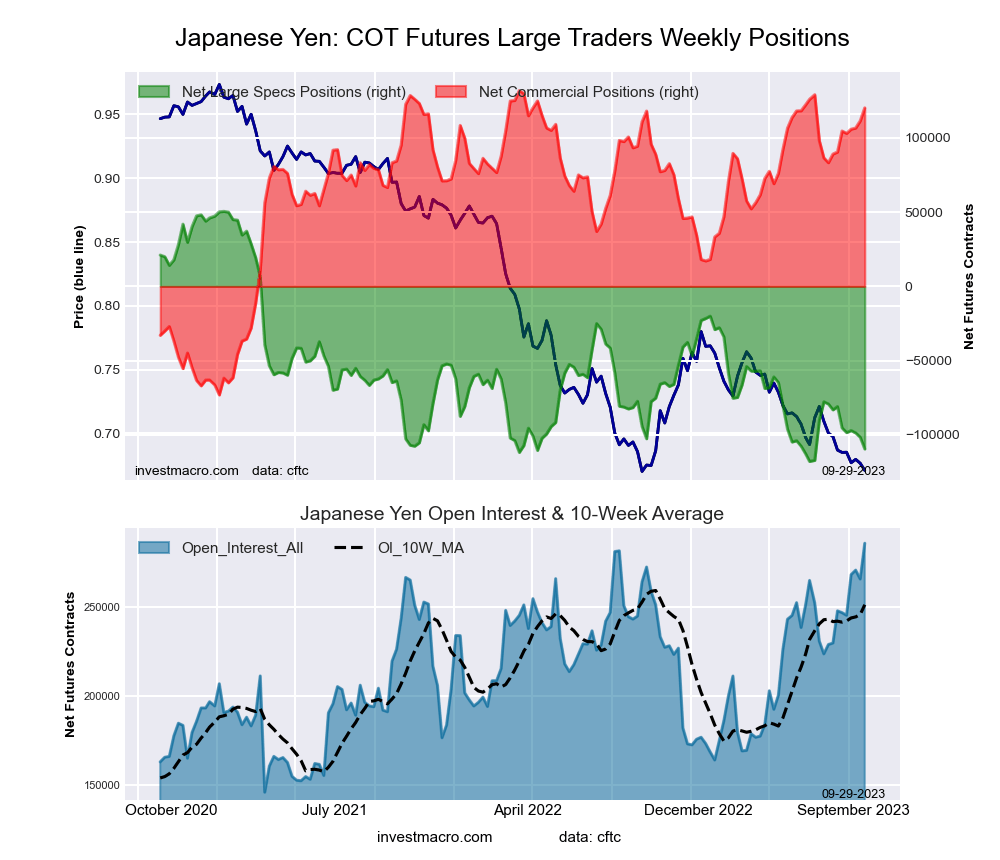 The Japanese Yen large speculator standing this week resulted in a net position of -109,512 contracts in the data reported through Tuesday. This was a weekly decrease of -7,893 contracts from the previous week which had a total of -101,619 net contracts.
This week’s current strength score (the trader positioning range over the past three years, measured from 0 to 100) shows the speculators are currently Bearish-Extreme with a score of 5.0 percent. The commercials are Bullish-Extreme with a score of 94.3 percent and the small traders (not shown in chart) are Bearish with a score of 31.7 percent.
Price Trend-Following Model: Strong Downtrend
Our weekly trend-following model classifies the current market price position as: Strong Downtrend. The current action for the model is considered to be: Hold – Maintain Short Position.
| JAPANESE YEN Statistics | SPECULATORS | COMMERCIALS | SMALL TRADERS |
| – Percent of Open Interest Longs: | 16.1 | 69.9 | 12.3 |
| – Percent of Open Interest Shorts: | 54.4 | 27.9 | 16.0 |
| – Net Position: | -109,512 | 120,227 | -10,715 |
| – Gross Longs: | 46,169 | 200,015 | 35,139 |
| – Gross Shorts: | 155,681 | 79,788 | 45,854 |
| – Long to Short Ratio: | 0.3 to 1 | 2.5 to 1 | 0.8 to 1 |
| NET POSITION TREND: | | | |
| – Strength Index Score (3 Year Range Pct): | 5.0 | 94.3 | 31.7 |
| – Strength Index Reading (3 Year Range): | Bearish-Extreme | Bullish-Extreme | Bearish |
| NET POSITION MOVEMENT INDEX: | | | |
| – 6-Week Change in Strength Index: | -17.0 | 14.5 | -2.4 |
Swiss Franc Futures:
 The Swiss Franc large speculator standing this week resulted in a net position of -9,115 contracts in the data reported through Tuesday. This was a weekly decline of -1,180 contracts from the previous week which had a total of -7,935 net contracts.
This week’s current strength score (the trader positioning range over the past three years, measured from 0 to 100) shows the speculators are currently Bearish with a score of 31.6 percent. The commercials are Bullish with a score of 77.4 percent and the small traders (not shown in chart) are Bearish-Extreme with a score of 18.7 percent.
Price Trend-Following Model: Weak Uptrend
Our weekly trend-following model classifies the current market price position as: Weak Uptrend. The current action for the model is considered to be: Hold – Maintain Long Position.
| SWISS FRANC Statistics | SPECULATORS | COMMERCIALS | SMALL TRADERS |
| – Percent of Open Interest Longs: | 23.0 | 59.3 | 17.7 |
| – Percent of Open Interest Shorts: | 39.9 | 20.5 | 39.6 |
| – Net Position: | -9,115 | 20,914 | -11,799 |
| – Gross Longs: | 12,377 | 31,968 | 9,542 |
| – Gross Shorts: | 21,492 | 11,054 | 21,341 |
| – Long to Short Ratio: | 0.6 to 1 | 2.9 to 1 | 0.4 to 1 |
| NET POSITION TREND: | | | |
| – Strength Index Score (3 Year Range Pct): | 31.6 | 77.4 | 18.7 |
| – Strength Index Reading (3 Year Range): | Bearish | Bullish | Bearish-Extreme |
| NET POSITION MOVEMENT INDEX: | | | |
| – 6-Week Change in Strength Index: | -14.0 | 30.3 | -41.8 |
Canadian Dollar Futures:
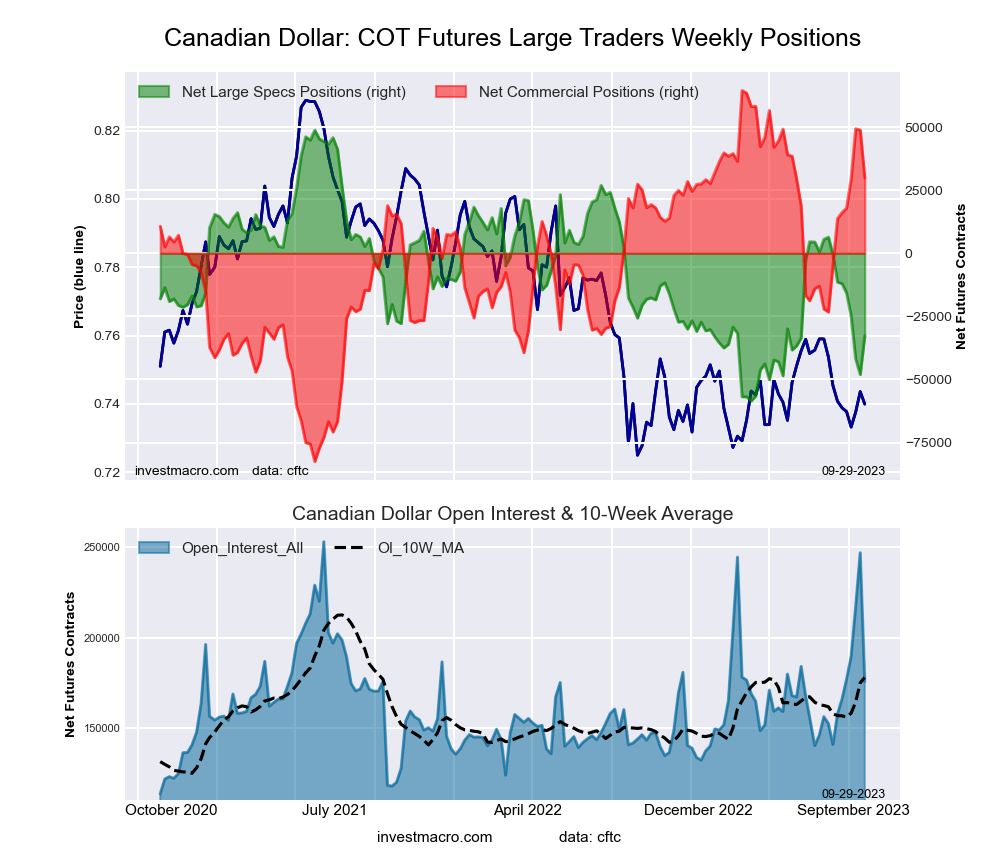 The Canadian Dollar large speculator standing this week resulted in a net position of -32,696 contracts in the data reported through Tuesday. This was a weekly increase of 15,331 contracts from the previous week which had a total of -48,027 net contracts.
This week’s current strength score (the trader positioning range over the past three years, measured from 0 to 100) shows the speculators are currently Bearish with a score of 24.1 percent. The commercials are Bullish with a score of 76.4 percent and the small traders (not shown in chart) are Bearish with a score of 29.2 percent.
Price Trend-Following Model: Strong Downtrend
Our weekly trend-following model classifies the current market price position as: Strong Downtrend. The current action for the model is considered to be: Hold – Maintain Short Position.
| CANADIAN DOLLAR Statistics | SPECULATORS | COMMERCIALS | SMALL TRADERS |
| – Percent of Open Interest Longs: | 9.7 | 68.7 | 19.2 |
| – Percent of Open Interest Shorts: | 28.3 | 51.7 | 17.6 |
| – Net Position: | -32,696 | 29,819 | 2,877 |
| – Gross Longs: | 17,006 | 120,758 | 33,799 |
| – Gross Shorts: | 49,702 | 90,939 | 30,922 |
| – Long to Short Ratio: | 0.3 to 1 | 1.3 to 1 | 1.1 to 1 |
| NET POSITION TREND: | | | |
| – Strength Index Score (3 Year Range Pct): | 24.1 | 76.4 | 29.2 |
| – Strength Index Reading (3 Year Range): | Bearish | Bullish | Bearish |
| NET POSITION MOVEMENT INDEX: | | | |
| – 6-Week Change in Strength Index: | -19.8 | 10.9 | 11.6 |
Australian Dollar Futures:
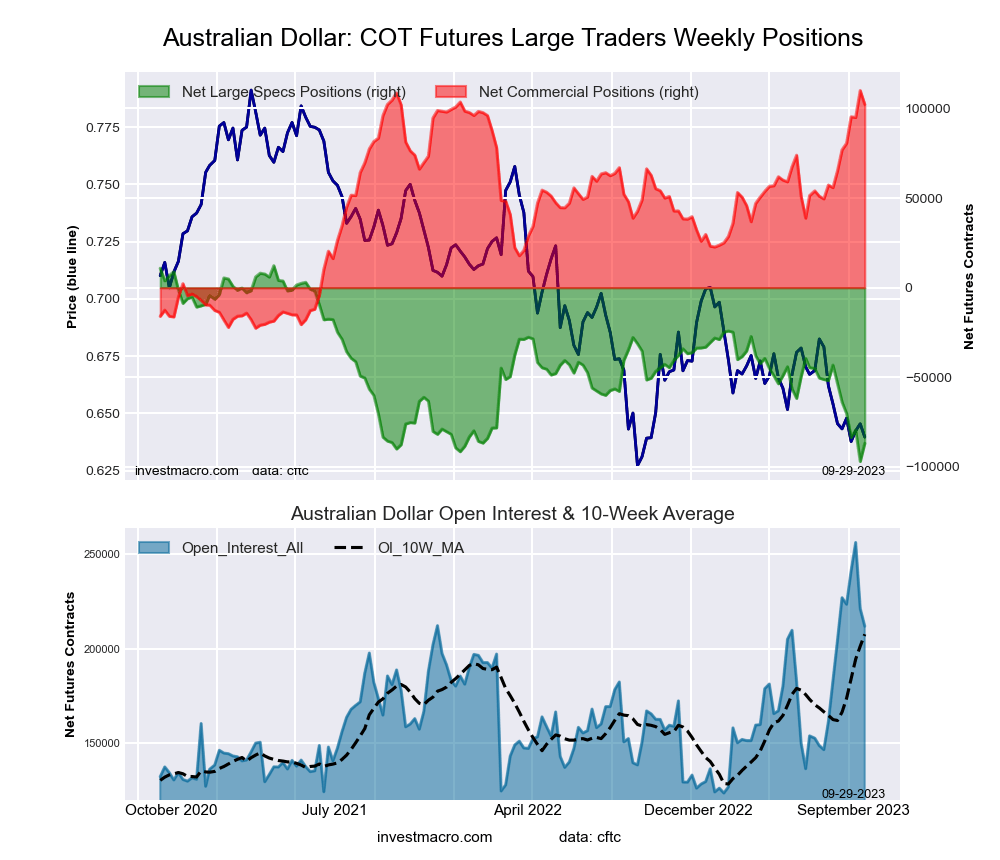 The Australian Dollar large speculator standing this week resulted in a net position of -86,815 contracts in the data reported through Tuesday. This was a weekly increase of 10,131 contracts from the previous week which had a total of -96,946 net contracts.
This week’s current strength score (the trader positioning range over the past three years, measured from 0 to 100) shows the speculators are currently Bearish-Extreme with a score of 9.3 percent. The commercials are Bullish-Extreme with a score of 94.1 percent and the small traders (not shown in chart) are Bearish-Extreme with a score of 14.8 percent.
Price Trend-Following Model: Strong Downtrend
Our weekly trend-following model classifies the current market price position as: Strong Downtrend. The current action for the model is considered to be: Hold – Maintain Short Position.
| AUSTRALIAN DOLLAR Statistics | SPECULATORS | COMMERCIALS | SMALL TRADERS |
| – Percent of Open Interest Longs: | 17.0 | 71.3 | 9.7 |
| – Percent of Open Interest Shorts: | 58.0 | 23.0 | 17.0 |
| – Net Position: | -86,815 | 102,250 | -15,435 |
| – Gross Longs: | 36,104 | 151,041 | 20,512 |
| – Gross Shorts: | 122,919 | 48,791 | 35,947 |
| – Long to Short Ratio: | 0.3 to 1 | 3.1 to 1 | 0.6 to 1 |
| NET POSITION TREND: | | | |
| – Strength Index Score (3 Year Range Pct): | 9.3 | 94.1 | 14.8 |
| – Strength Index Reading (3 Year Range): | Bearish-Extreme | Bullish-Extreme | Bearish-Extreme |
| NET POSITION MOVEMENT INDEX: | | | |
| – 6-Week Change in Strength Index: | -30.6 | 27.9 | -8.7 |
New Zealand Dollar Futures:
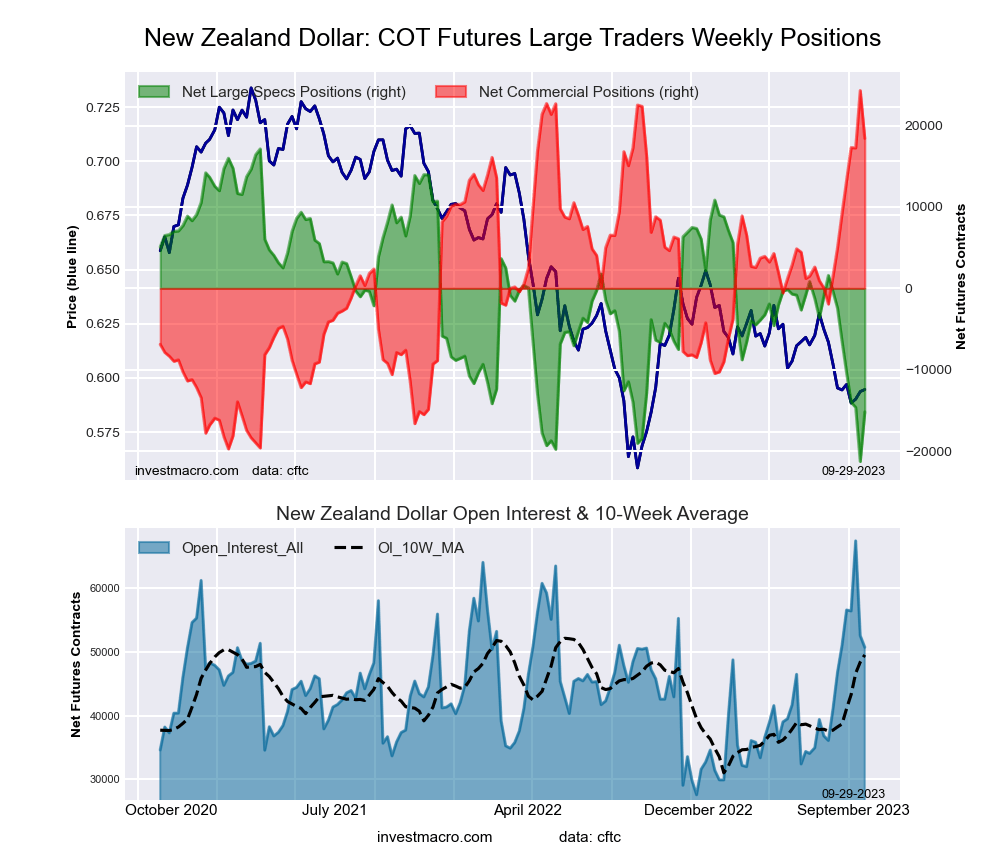 The New Zealand Dollar large speculator standing this week resulted in a net position of -15,181 contracts in the data reported through Tuesday. This was a weekly increase of 6,091 contracts from the previous week which had a total of -21,272 net contracts.
This week’s current strength score (the trader positioning range over the past three years, measured from 0 to 100) shows the speculators are currently Bearish-Extreme with a score of 15.9 percent. The commercials are Bullish-Extreme with a score of 86.6 percent and the small traders (not shown in chart) are Bearish-Extreme with a score of 11.4 percent.
Price Trend-Following Model: Downtrend
Our weekly trend-following model classifies the current market price position as: Downtrend. The current action for the model is considered to be: Hold – Maintain Short Position.
| NEW ZEALAND DOLLAR Statistics | SPECULATORS | COMMERCIALS | SMALL TRADERS |
| – Percent of Open Interest Longs: | 20.9 | 72.6 | 4.6 |
| – Percent of Open Interest Shorts: | 50.9 | 36.3 | 11.0 |
| – Net Position: | -15,181 | 18,421 | -3,240 |
| – Gross Longs: | 10,632 | 36,867 | 2,340 |
| – Gross Shorts: | 25,813 | 18,446 | 5,580 |
| – Long to Short Ratio: | 0.4 to 1 | 2.0 to 1 | 0.4 to 1 |
| NET POSITION TREND: | | | |
| – Strength Index Score (3 Year Range Pct): | 15.9 | 86.6 | 11.4 |
| – Strength Index Reading (3 Year Range): | Bearish-Extreme | Bullish-Extreme | Bearish-Extreme |
| NET POSITION MOVEMENT INDEX: | | | |
| – 6-Week Change in Strength Index: | -33.2 | 30.6 | -8.4 |
Mexican Peso Futures:
 The Mexican Peso large speculator standing this week resulted in a net position of 60,633 contracts in the data reported through Tuesday. This was a weekly lowering of -3,017 contracts from the previous week which had a total of 63,650 net contracts.
This week’s current strength score (the trader positioning range over the past three years, measured from 0 to 100) shows the speculators are currently Bullish with a score of 76.1 percent. The commercials are Bearish with a score of 22.8 percent and the small traders (not shown in chart) are Bearish with a score of 36.7 percent.
Price Trend-Following Model: Weak Uptrend
Our weekly trend-following model classifies the current market price position as: Weak Uptrend. The current action for the model is considered to be: Hold – Maintain Long Position.
| MEXICAN PESO Statistics | SPECULATORS | COMMERCIALS | SMALL TRADERS |
| – Percent of Open Interest Longs: | 42.8 | 53.3 | 3.0 |
| – Percent of Open Interest Shorts: | 14.8 | 83.1 | 1.2 |
| – Net Position: | 60,633 | -64,635 | 4,002 |
| – Gross Longs: | 92,732 | 115,616 | 6,587 |
| – Gross Shorts: | 32,099 | 180,251 | 2,585 |
| – Long to Short Ratio: | 2.9 to 1 | 0.6 to 1 | 2.5 to 1 |
| NET POSITION TREND: | | | |
| – Strength Index Score (3 Year Range Pct): | 76.1 | 22.8 | 36.7 |
| – Strength Index Reading (3 Year Range): | Bullish | Bearish | Bearish |
| NET POSITION MOVEMENT INDEX: | | | |
| – 6-Week Change in Strength Index: | -13.1 | 12.2 | 5.1 |
Brazilian Real Futures:
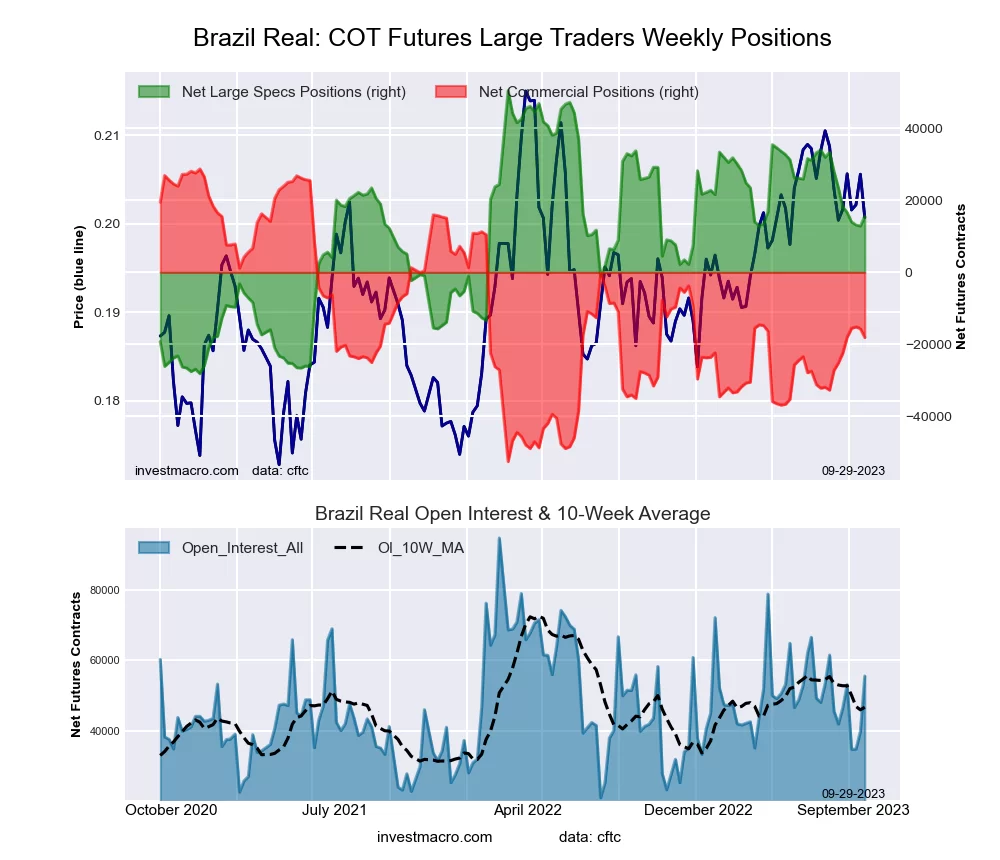 The Brazilian Real large speculator standing this week resulted in a net position of 15,558 contracts in the data reported through Tuesday. This was a weekly advance of 2,705 contracts from the previous week which had a total of 12,853 net contracts.
This week’s current strength score (the trader positioning range over the past three years, measured from 0 to 100) shows the speculators are currently Bullish with a score of 55.6 percent. The commercials are Bearish with a score of 42.3 percent and the small traders (not shown in chart) are Bullish with a score of 58.5 percent.
Price Trend-Following Model: Strong Downtrend
Our weekly trend-following model classifies the current market price position as: Strong Downtrend. The current action for the model is considered to be: New Sell – Short Position.
| BRAZIL REAL Statistics | SPECULATORS | COMMERCIALS | SMALL TRADERS |
| – Percent of Open Interest Longs: | 52.7 | 37.3 | 7.6 |
| – Percent of Open Interest Shorts: | 24.7 | 70.0 | 3.0 |
| – Net Position: | 15,558 | -18,138 | 2,580 |
| – Gross Longs: | 29,298 | 20,746 | 4,229 |
| – Gross Shorts: | 13,740 | 38,884 | 1,649 |
| – Long to Short Ratio: | 2.1 to 1 | 0.5 to 1 | 2.6 to 1 |
| NET POSITION TREND: | | | |
| – Strength Index Score (3 Year Range Pct): | 55.6 | 42.3 | 58.5 |
| – Strength Index Reading (3 Year Range): | Bullish | Bearish | Bullish |
| NET POSITION MOVEMENT INDEX: | | | |
| – 6-Week Change in Strength Index: | -10.1 | 8.7 | 7.8 |
Bitcoin Futures:
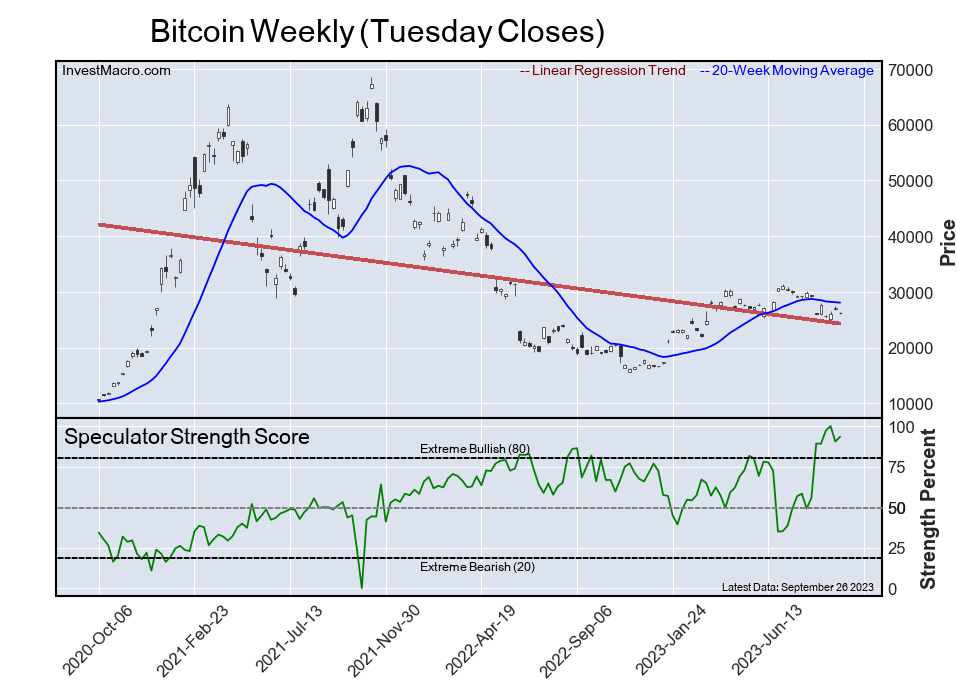
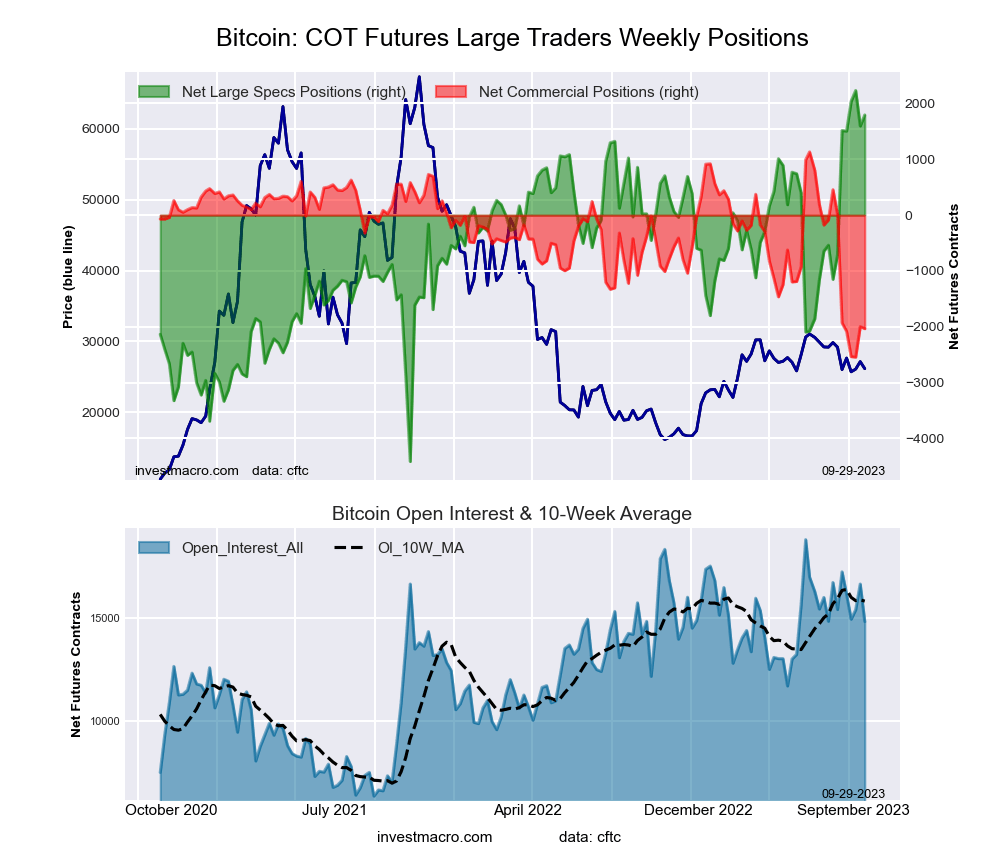 The Bitcoin large speculator standing this week resulted in a net position of 1,794 contracts in the data reported through Tuesday. This was a weekly lift of 197 contracts from the previous week which had a total of 1,597 net contracts.
This week’s current strength score (the trader positioning range over the past three years, measured from 0 to 100) shows the speculators are currently Bullish-Extreme with a score of 93.4 percent. The commercials are Bearish-Extreme with a score of 13.9 percent and the small traders (not shown in chart) are Bearish-Extreme with a score of 18.4 percent.
Price Trend-Following Model: Strong Downtrend
Our weekly trend-following model classifies the current market price position as: Strong Downtrend. The current action for the model is considered to be: Hold – Maintain Short Position.
| BITCOIN Statistics | SPECULATORS | COMMERCIALS | SMALL TRADERS |
| – Percent of Open Interest Longs: | 73.6 | 1.0 | 8.1 |
| – Percent of Open Interest Shorts: | 61.5 | 14.7 | 6.5 |
| – Net Position: | 1,794 | -2,033 | 239 |
| – Gross Longs: | 10,930 | 142 | 1,200 |
| – Gross Shorts: | 9,136 | 2,175 | 961 |
| – Long to Short Ratio: | 1.2 to 1 | 0.1 to 1 | 1.2 to 1 |
| NET POSITION TREND: | | | |
| – Strength Index Score (3 Year Range Pct): | 93.4 | 13.9 | 18.4 |
| – Strength Index Reading (3 Year Range): | Bullish-Extreme | Bearish-Extreme | Bearish-Extreme |
| NET POSITION MOVEMENT INDEX: | | | |
| – 6-Week Change in Strength Index: | 37.7 | -55.7 | -10.4 |
Article By InvestMacro – Receive our weekly COT Newsletter
See our Weekly Trend Model Readings and Actions for each COT Futures Market and Category. All information contained in this data are for general informational purposes only and do not constitute investment advice.
*COT Report: The COT data, released weekly to the public each Friday, is updated through the most recent Tuesday (data is 3 days old) and shows a quick view of how large speculators or non-commercials (for-profit traders) were positioned in the futures markets.
The CFTC categorizes trader positions according to commercial hedgers (traders who use futures contracts for hedging as part of the business), non-commercials (large traders who speculate to realize trading profits) and nonreportable traders (usually small traders/speculators) as well as their open interest (contracts open in the market at time of reporting). See CFTC criteria here.


