In the late 1970s, there arose from the morass of stock market analysts and commodity prognosticators a character that challenged all of the hallowed myths behind Wall Street in a manner that was, at the time, incorrigible. His name was Joseph Granville.
After years as the technical analyst for E.F. Hutton, “Smokin’ Joe” (not the heavyweight boxer) set out on his own in 1963 launching the Granville Market Letter that totally dominated water-cooler meetings and coffee-room get-togethers, both of which were in the late-1970’s the only real source of market gossip one could obtain long before you could use your phone to chat with three million faceless souls with the press of a button.
Whenever Joe got a sell signal, the title of his letter would be “SELL EVERYTHING!” after which thousands of subscribers (and tens of thousands more that got a faxed copy of the note) would call their brokers/traders and SELL every share of stock that they owned. Many times, it was the Granville Market Letter that caused huge drops in the Dow Jones, which in those days was a two-digit drop from a level somewhere under 800.
As his letter grew due to some uncanny market calls (like the January 1981 top in the Dow above 1,000), his popularity (and ego) grew exponentially to the point where his public appearances became circus shows. Once, in Vegas, he had the technicians lay a sheet of plate glass one inch below the surface of the swimming pool such that when he was introduced, he walked across the pool to the awe and amazement of the wildly cheering audience.
In his letter, he would refer to bank trust officers who controlled private wealth as “monkeys” or “chimps” and often trotted real ones out on stage, dressed in three-piece, pin-striped suits to mimic the Wall Street gang. At one conference, he wore phony angel wings as an invisible wire lowered him onto the stage. There are dozens if not hundreds of stories about the highly eccentric technical analyst, and while not all are exactly funny, Joe Granville was a one-of-a-kind character in an industry normally reserved for stodgy, Warren-Buffett types that are about as entertaining as a can of Cherry coke.
Joe enjoyed the limelight month after month during the 1981-1982 bear market until August of 1982 when Paul Volcker suddenly and abruptly slashed interest rates, sending bond yields and other important interest rate measures plummetting but rather than stepping out of the way of the approaching freight train of short-covering and bond-stock allocation switches, Joe ignored his famous “on-balance-volume” indicator and stayed short the market, ridiculing the Wall Street gang relentlessly such that after one particularly nasty correction, he “crossed the line” (as they say) with a headline note that read: “SUE YOUR BROKER!” in reference to the allegedly poor investment advice they had been doling out all through the ’81-’82 downturn. The problem was that he was urging this in the first few months of what was the greatest bull market move in history – the 1982-2001 bull – that saw the Dow Jones advance from 785 to over 11,000 by 2001.
Sadly, when Granville stayed glued to his technical system of tracking “UP” volume versus “DOWN” volume on multi-time-period fronts, his market timing was impeccable. When the footlights of investment stardom lit up his tuxedo-clad visage along with the easily-inflated ego, he abandoned his core system and wound up crashing and on fire with zero subscribers, zero speaking engagements, and zero friends left on Wall Street.
Luckily, I was not a follower at the time, but I was totally fascinated with his rise and his fall because while there are more than enough clowns trotted out today by CNBC telling viewers to “BUY! BUY! BUY!” there will never again be an entertainer like Joe Granville.
The reason I decided to talk about Granville in this weekly missive is the sheer number of emails I have been receiving pumping the tires of this guru and that guru with “proprietary trading systems” and “foolproof money-making algorithms,” but at the end of the day, the question that must be asked is “If the systems are that good, why not just keep it secret and trade it?
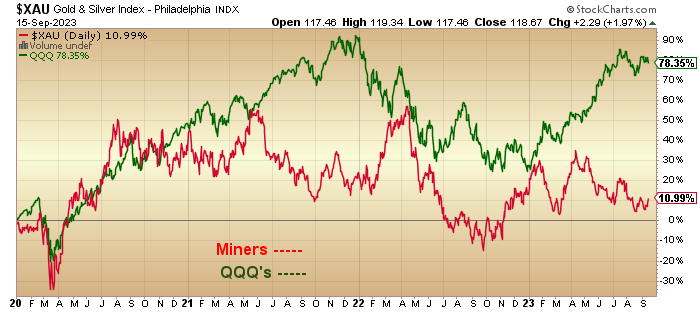
Of all people who should know about the difficulty in calling the market week after week, it is yours truly who has been at it since 1978 and seen the thrill of victory vanquished numerous times by the agony of defeat. The gold and silver newsletters are notoriously-obvious in their self-promotional antics. One look at a chart of the mining stocks versus the technology stocks since the start of 2020, and one wonders how they can attract anyone to their services.
If they are not giving bombastic, self-laudatory speeches while being interviewed by some kiddie podcaster who stares at them goggle-eyed as they talk eloquently of how much money they scammed made in the last uranium bull or the last gold bull or the last coal bull, failing to mention the dozens of deals that blew up that are conveniently omitted from the discussion.
“I like bear markets because I can buy low!” they shrill for all to hear, failing to mention that they never told anyone to that they were sellers at the top while pumping their books to all that would listen. The mining promoters are the masters of promotion, all living by the mantra of “I never met a bid I didn’t LOVE!” while taking full advantage of the same by doing the honorable thing — providing an offer to every one of those lovable bids.
In my next life, I want to publish an investment newsletter called the “Mattress Advisor,” where all of your excess savings one stuffs into a mattress, and the only time it comes out is when markets crash, as in the 2008 Great Financial Bailout Crisis, or March 2020 global flu-bug shutdown.
Special offerings like a vaccine-provider start-up would be offered, knowing full well that government mandates would force the public to buy the vaccine at enormous taxpayer expense and user vulnerability. In this manner, the fees that one would save by avoiding the banks and huge, government-insulated prime brokerage firms would allow you a stress-free retirement fund without the need for a “wealth advisor” clipping you for 2% for three meetings a year while he/she has your money in an index fund.
I follow perhaps two dozen market players, and each one of them has had moments in their careers where they have stood out for an outstanding market call or stock pick or sports prediction, but as talented and as smart and as experienced as they all may be, they have all blown up at least once or twice. In over forty-five years of trading markets (stocks, bonds, commodities futures, options), I can tell you that nobody gets it right all the time. Furthermore, the ones I avoid are those who constantly boast about their wins until I want to take a ball-and-chain hammer to their big, phony, condescending smiles that are designed to infer that they are SO much smarter and SO much richer than you are. Oh, and by the way, for $5,000 per year (cash, cheque, or money order), you can join the thousands of happy customers that are enrolled in their super-duper newsletter, where the disclaimer is so small that it takes an electron microscope to decipher it.
Gold and Silver
At this point of the weekly missive, I usually throw up a few charts and try to make rhyme and/or reason of the price action in gold and silver. Today, I shall refrain.
I am now flat all trading positions in both gold and silver, breaking even on the SPDR Gold Shares ETF (GLD:NYSE) trade and getting clipped for a small hit on the iShares Silver Trust (ETF) (SLV:NYSE). The reason I went flat is quite simple: Both gold and silver are not acting “right.”
I am at the point in my life where I expect that all of the courses and all of the academic degrees (not to mention that getting a margin call on a 5-car holding in pork bellies futures on the Chicago Board of Trade is worth five Harvard Business School degrees) should have me adequately prepared for any and all developments in the precious metals sector but I must confess that gold and silver have me completely stymied, dumbfounded, and, quite frankly, ticked off.
My friend, Ben, and I were talking the other day, and as he is a voracious student of the precious metals markets (and global conspiracies including the WEF and other nefarious outfits), I asked him this question: “If I told you back in 2003 that in the next twenty years, we would have a banking bailout (2008), massive currency creation on a global scale (2008-2011), a global pandemic and economic shutdown (2020-2022), a Russian invasion of the Ukraine, an escalation in U.S. National Debt from $25 trillion to $33 trillion from 2020-2023, and yet another banking bailout (March 2023), where would you put the price of gold?”
His reply was, “Don’t get me started.”
I have younger subscribers, friends, family, and fishing buddies who all ask me where they should put their money, and whereas in prior years, I could make a compelling case for precious metals as a protection against all of those events mentioned above, I cannot look them straight in the face and say “gold and silver.”
The kiddies look at me and ask me if I caught any of the Bitcoin moves in 2014, to which I reply: “HUH?”
We septuagenarians suffer from a combination of recency bias, hubris, and narcissism (our good points), followed by intransigence and mild senility when dealing with the more youthful members of the investment world. That leads to rigidity of attitude and inflexibility of investment posturing, which is why my eyes glaze over when asked that question.
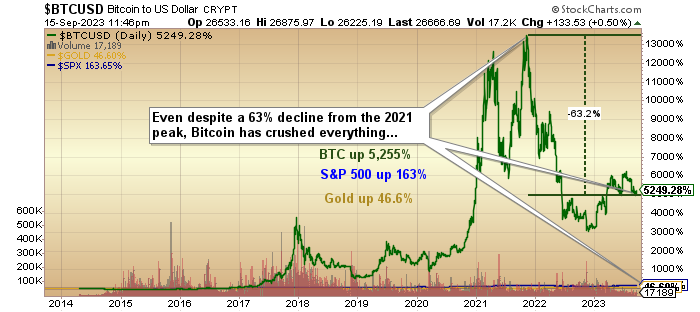
I could never understand the investment case for Bitcoin from Day One because, in my quasi-atrophied mind, it was a duplication of the attributes of gold and silver, stalwart defenders of the purchasing power of savings for five thousand years. As true as that may be, look at that chart. The kiddies were absolutely right because they saw the shenanigans in the gold and silver markets (all completely dominated by the big banks in London and N.Y.), and they said “No thanks” and decided to create their own defense against the government and central bank currency debasement and guess what? It worked.
I do not own Bitcoin. I have never owned cryptocurrencies of any type, form, or semblance, but I will tell you this: “I wish I had.”
I wish I had treated Bitcoin as “just another trade” when I received my first “pitch” on it in 2015. I wish I had stuffed my sexagenarian ego into that old steamer trunk in the attic and grabbed “a few yards of the s*it” simply “as a trade.” It represents all of the virtuous qualities that were taught to me about gold and silver back when I was a “kiddie” while my Bay Street bosses were lecturing me on the wonderment of “government bonds.”
The point I make here is this: as long as the U.S. government views gold as a “Public Enemy,” it is never going to outperform the S&P or copper or zinc or lithium because it is the anti-Christ to the U.S. dollar — period. The U.S. Feds have the U.S. dollar gold price on a leash of sorts. They allow “manageable volatility,” but they will never allow it to replace the dollar as a substitute for “reserve currency” status.
All of that being said, I continue to hold an inordinate amount of physical gold and silver and an embarrassing number of junior gold and silver stocks, all under the assumption that everything I just typed is utter nonsense. After all, that is why we all own gold and silver. Right?
The QQQ’s
The U.S. technology stock steamroller that has sent shorts to the infirmary and the odd mortuary since the banking bailout last March appears to have hit a speed bump, with NASDAQ Composite registering lower highs in choppy trade since it hit its peak at 14,398 back in mid-July. The S&P 500 hit its peak a week later at 4,607 and is also trading more or less sideways as investors try to figure out when and where the much-heralded recession will surface. Every single macro analyst on the planet is scratching their collective heads because the economic data — at least the drivel we are fed — is defying all logic while the lead indicators are screaming, “Economic Cliff-Dive Dead Ahead!”.
What macro analysts forget is that the slash-and-burn artists in the S&P trading pits thrive on liquidity. The quote contained in this graphic of Jerome Powell “manning the printing press” is the precise reason why stocks have enjoyed such a stellar 2023 (thus far). The macro mavens of Wall Street underestimated the amount of new credit that was created firstly in 2008-2011 to bail out the banks and then in 2020-2022 to bail out industry and the consumer. Eight trillion dollars is a great deal of liquidity, and knowing the thieves on Wall Street as I do, they are masters at “gathering assets.”
That behemoth of counterfeit currency created out of thin air to help “the average citizen” weather the pandemic storm in 2020-2022 has found its way into the margin accounts of the “asset gatherers” on Wall Street. The stimmy cheque that was supposed to help a young family of four to “get by” is now trading EOD options and calls on the Invesco QQQ ETF’s (QQQ:NASDAQ) because that is what Wall Street does! Jerome Powell is not manning a device that is spitting out $100 bills to the needy; it is aimed directly at the customers of the big banks that are more than happy to pay fees to play in the financial services sandbox.
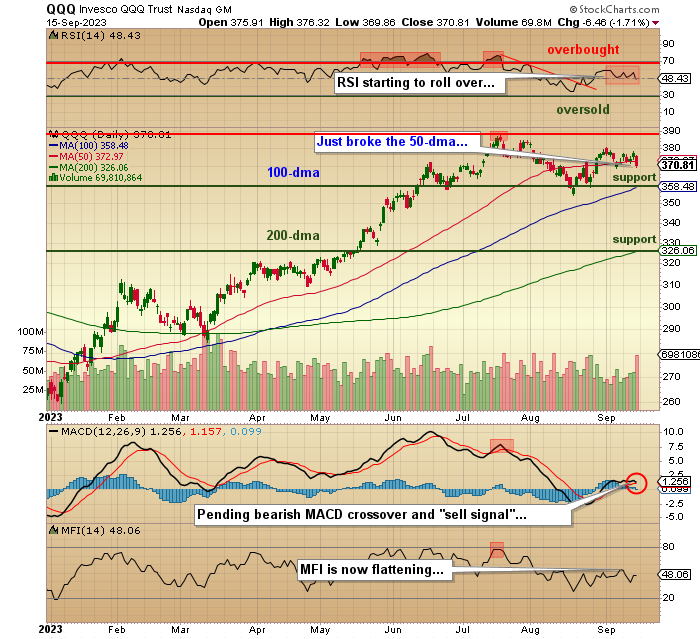
So, when I saw the QQQ’s on their way to 300 back in mid-August after breaking the 50-dma, I had visions of Jerome Powell sending firehoses of fresh-ink cash out into the urban landscapes where the “gatherers” sat in wait. I covered my shorts and went long because there was just too much liquidity in the hands of the trading demons to allow a major crash to occur.
That said, the QQQ’s have broken below the 50-dma at 372.97, and since there is a seasonal tendency for stocks to retrench in the latter half of September, remember that those in control of money flow are enjoying a big year with a 20% gain on several trillion dollars of “assets” which means they have a mountain of loan value to use as we head into the final quarter. Trading from a short position between now and October 1 might work out well, and it might work out really well for the VIX traders, and QQQ put buyers if there is an exogenous event that sends chills down the back alleys of Wall Street, but the fourth quarter is usually a strong one, especially after a nine-month disco dance upon which markets have boogied with absolute vigor.
The window of weakness is a short two weeks during which the QQQ could check back to the 100-dma at around 358 but failing a breakdown of that level; odds are in the bulls’ favor looking out to year-end. If one can think of any event that could drain liquidity from the Wall Street punchbowl between now and January, send me a smoke signal.
Lithium, Uranium, and Copper
To repeat a theme that I will maintain for most of the next seven years (the decade), three components of the electrification movement will need to grow exponentially in order to meet the demand associated with this transition: More clean energy (nuclear); more transmission infrastructure (copper), and increased electrical storage capacity (lithium).
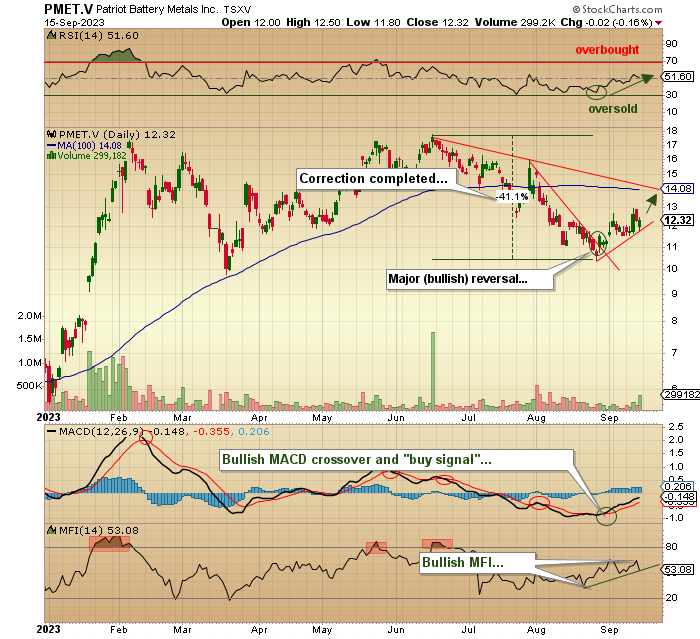
The lithium sector has been the savior of resource brokers and fund managers for most of the past three years. Using the chart of hard rock miner Patriot Battery Metals Inc. (PMET:CA), it appears as though the summer correction that hammered the bulk of the lithium miners has ended. I cannot tell whether it is going to last for very long, but short-term, the runway looks clear.
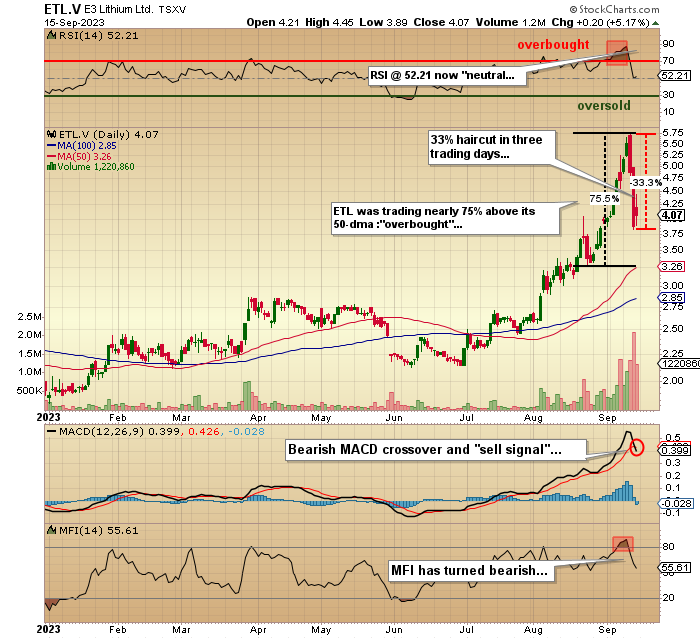
The lithium “briners,” which have been a completely different story this summer, had a much-needed correction last week as the lead “briner,” E3 Lithium Ltd. (ETL:TSXV;EEMMF:US) lost a third of its value in three trading sessions after peaking at a CA$400m market cap at $5.72.
That dragged my top pick for 2023, Volt Lithium Corp. (VLT:TSV;VLTLF:US), down as well from a recovery high at CA$.395 to close out the week at $.315.
Despite the setback, the “briners” will achieve free cash flow objectives a lot sooner than will the “miners,” but with all of the automotive money flooding into “miner projects,” I cannot see any of the lithium space players being left out of the demand-led rally that should last until at least 2030. I am inclined to invest heavily in the ones with the lowest current market cap, where management has demonstrated the ability to execute. The market caps of the three mentioned here are:
- Patriot Battery Metals: CA$1.3 billion
- E3 Lithium Ltd. CA$274 million
- Volt Lithium Corp. CA$31 million
Uranium prices tapped US$62/pound this week, which sent most of the companies friendly to nuclear power on a tear. The Sprott Uranium Miners ETF (URNM::NYSE ARCA) is now up over 40% YTD, versus the NASDAQ up 30% and the S&P up 16%.
Cameco Corp. (CCO:TSX; CCJ:NYSE), the world’s biggest uranium miner, is up 77% YTD, while my personal holding Western Uranium & Vanadium Corp. (WUC:CSE; WSTRF:OTCQX) closed at $1.62, ahead 37% YTD and still well below the peaks in 2018 (CAD $3.40) and 2021 ($4.25).
With lithium and uranium now solidly ahead for the year, one has to wonder when the last component of the “electrification trilogy” — copper — will catch the attention of the big multinational trading houses.
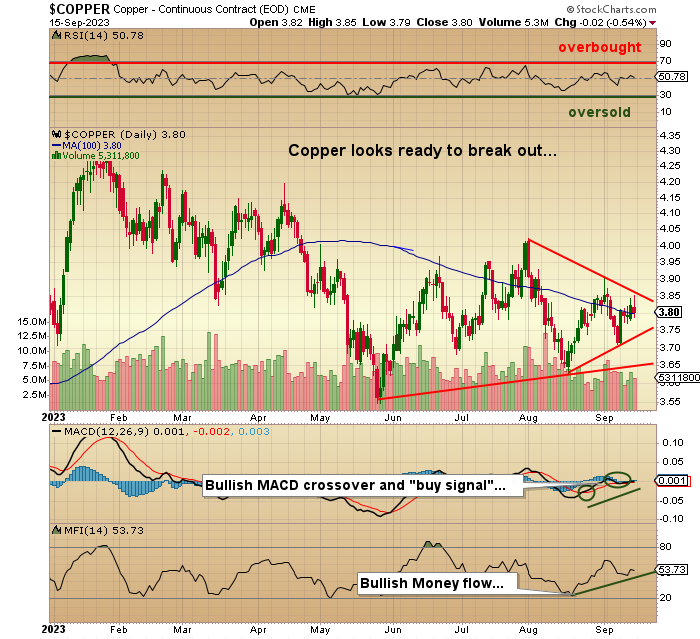
With most of the large copper deposits around the globe now on descending production slopes and with few new discoveries coming onstream, even finite copper demand over the balance of the decade will be enough to affect price in a huge way. However, copper demand is not going to be “finite”; it is going through the roof, and that is with or without China.
The copper bears cite “weak China growth” as a reason for anemic copper prices, but one thing is certain: if you fire up fifty-seven new nuclear reactors around the world, creating several hundred million new megawatts of electricity, you are going to need a much larger transmission infrastructure which means wires and unless they find a way to transmit current more efficiently using a substance other than copper wiring, then copper is going to move into “shortage” at some point and when that point arrives, prices will explode.
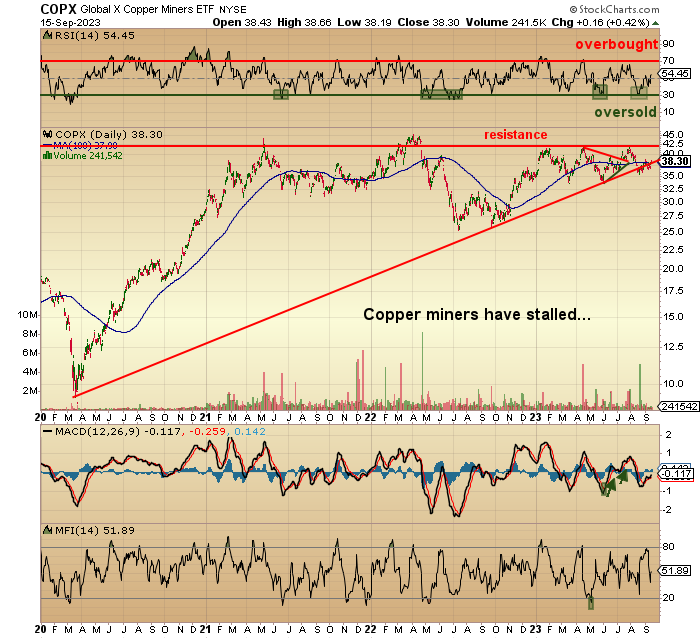
The Copper Miners ETF (COPX:US) has come a long way off the COVID-19 CRASH lows, but tops in the US$42-43 range have not been revisited because of the waffling copper price. If I own uranium and lithium stocks, which I do because I am a fervent believer in the electrification movement, then I cannot construct a portfolio without copper.
Now, copper is seen by many as a boring, unexciting sector with very few junior copper deals commanding much (if any) attention. It may be that copper mining is seen as environmentally hostile to the spirit and soul of the electrification movement and thus shunned by the “woke” community of newbie investors.
I would answer that by pointing to the Energy ETF (XLE:US), up over 27% YTD with many of the components carrying P/E’s of around 8. As socially and politically “uncool” as oil and gas extraction is, money has found the sector, and investors are being rewarded. I think the same result holds true for copper, so outside of owning a few call options on the COPX:US, I am actively seeking out a cheap junior with an advanced exploration or development project that I can get behind before the rest of the world wakes up.
Lithium has soared; uranium is now soaring; the last of the electrification trilogy is about to soar.
BUY COPPER.
Important Disclosures:
- Volt Lithium Corp. has a consulting relationship with an affiliate of Streetwise Reports, and pays a monthly consulting fee between US$8,000 and US$20,000.
- As of the date of this article, officers and/or employees of Streetwise Reports LLC (including members of their household) own securities of Volt Lithium Corp. and Western Uranium & Vanadium Corp.
- Michael Ballanger: I, or members of my immediate household or family, own securities of: All. My company has a financial relationship with: Volt Lithium Corp. I determined which companies would be included in this article based on my research and understanding of the sector.
- Statements and opinions expressed are the opinions of the author and not of Streetwise Reports or its officers. The author is wholly responsible for the validity of the statements. The author was not paid by Streetwise Reports for this article. Streetwise Reports was not paid by the author to publish or syndicate this article. Streetwise Reports requires contributing authors to disclose any shareholdings in, or economic relationships with, companies that they write about. Streetwise Reports relies upon the authors to accurately provide this information and Streetwise Reports has no means of verifying its accuracy.
- This article does not constitute investment advice. Each reader is encouraged to consult with his or her individual financial professional. By opening this page, each reader accepts and agrees to Streetwise Reports’ terms of use and full legal disclaimer. This article is not a solicitation for investment. Streetwise Reports does not render general or specific investment advice and the information on Streetwise Reports should not be considered a recommendation to buy or sell any security. Streetwise Reports does not endorse or recommend the business, products, services or securities of any company.
For additional disclosures, please click here.
Michael Ballanger Disclosures
This letter makes no guarantee or warranty on the accuracy or completeness of the data provided. Nothing contained herein is intended or shall be deemed to be investment advice, implied or otherwise. This letter represents my views and replicates trades that I am making but nothing more than that. Always consult your registered advisor to assist you with your investments. I accept no liability for any loss arising from the use of the data contained on this letter. Options and junior mining stocks contain a high level of risk that may result in the loss of part or all invested capital and therefore are suitable for experienced and professional investors and traders only. One should be familiar with the risks involved in junior mining and options trading and we recommend consulting a financial adviser if you feel you do not understand the risks involved.