By InvestMacro | COT | Data Tables | COT Leaders | Downloads | COT Newsletter
Here are the latest charts and statistics for the Commitment of Traders (COT) data published by the Commodities Futures Trading Commission (CFTC).
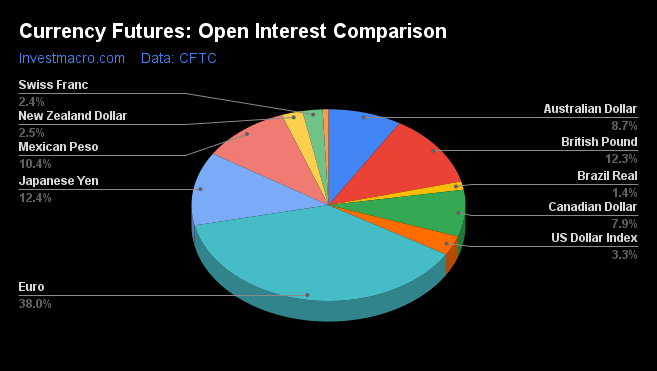
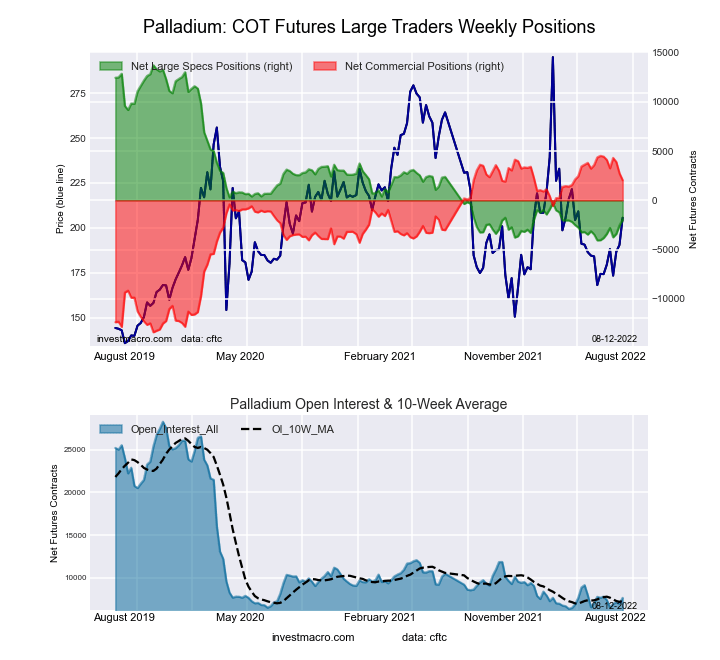
The latest COT data is updated through Tuesday August 9th and shows a quick view of how large traders (for-profit speculators and commercial entities) were positioned in the futures markets. All currency positions are in direct relation to the US dollar where, for example, a bet for the euro is a bet that the euro will rise versus the dollar while a bet against the euro will be a bet that the euro will decline versus the dollar.
Weekly Speculator Changes
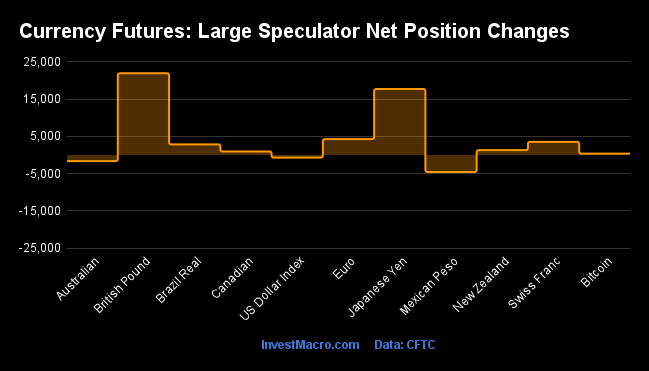
The COT currency market speculator bets were higher this week as eight out of the eleven currency markets we cover had higher positioning while the other three markets had lower speculator contracts.
Leading the gains for the currency markets was British pound sterling (21,941 contracts) and the Japanese yen (17,721 contracts) with the Euro (4,275 contracts), Swiss franc (3,526 contracts), Brazil real (2,863 contracts), New Zealand dollar (1,297 contracts), Canadian dollar (946 contracts) and Bitcoin (351 contracts) also recording positive weeks.
The currencies leading the declines in speculator bets this week were the Mexican peso (-4,568 contracts) with the Australian dollar (-1,638 contracts) and the US Dollar Index (-710 contracts) also registering lower bets on the week.
Highlighting the COT currency changes this week is the continued rebound in the Japanese yen speculator positions. The yen positioning has been in net bearish territory for seventy-four consecutive weeks (dating back to March 9th of 2021) but has started to see a strong decrease in its bearish levels lately. Speculators have improved their yen standing in three out of the past four weeks and by a total of +36,449 contracts in the past two weeks alone. This recent positive sentiment has brought the overall yen speculative standing (currently at -25,032 contracts) to the least bearish level of the past seventy-four weeks or since the position turned bearish last year. The yen price has rebounded a bit over the past month as the USDJPY currency pair has cooled off after reaching 20-year highs above 139.35 exchange rate in July. Currently, the USDJPY is trading around the 133.50 exchange rate and has come out of overbought territory on the weekly RSI Indicator (Relative Strength Index).
British pound sterling speculators also sharply cut their bearish positions this week as speculator positioning have now risen in three out of the past four weeks as well as in eight out of the previous eleven weeks. Speculative positions recorded a large improvement by +21,941 contracts this week which is the best weekly gain for GBP bets since the middle of January. This positive development has dropped the overall bearish position to the best level (or the least bearish level) since March 15th, a span of twenty-one weeks. The British pound price has been in a deep and consistent downtrend against the US Dollar since ascending over the 1.4200 exchange rate in May of 2021 and touched a recent low below 1.1800 in July (for an approximate -17.5 percent drop over that period). However, on the positive side, the pound has managed to rise in three out of the past four weeks, closing out the week at the 1.2136 exchange rate and, notably, a bullish divergence recently appeared on the weekly RSI Indicator following the July low.
| Aug-09-2022 | OI | OI-Index | Spec-Net | Spec-Index | Com-Net | COM-Index | Smalls-Net | Smalls-Index |
|---|
| USD Index | 59,639 | 88 | 38,637 | 89 | -42,099 | 9 | 3,462 | 54 |
| EUR | 692,398 | 79 | -34,536 | 24 | 14,402 | 80 | 20,134 | 8 |
| GBP | 224,581 | 59 | -34,468 | 45 | 52,050 | 62 | -17,582 | 19 |
| JPY | 225,834 | 72 | -25,032 | 53 | 36,994 | 54 | -11,962 | 29 |
| CHF | 43,202 | 27 | -9,782 | 32 | 19,464 | 75 | -9,682 | 25 |
| CAD | 143,646 | 26 | 21,223 | 63 | -29,743 | 44 | 8,520 | 47 |
| AUD | 158,100 | 51 | -57,588 | 31 | 59,441 | 63 | -1,853 | 48 |
| NZD | 45,350 | 35 | -276 | 71 | 4,044 | 37 | -3,768 | 8 |
| MXN | 189,988 | 45 | -27,621 | 16 | 24,722 | 83 | 2,899 | 55 |
| RUB | 20,930 | 4 | 7,543 | 31 | -7,150 | 69 | -393 | 24 |
| BRL | 25,481 | 7 | 1,733 | 52 | -3,884 | 47 | 2,151 | 90 |
| Bitcoin | 12,510 | 70 | -230 | 76 | -71 | 0 | 301 | 20 |
Strength Scores
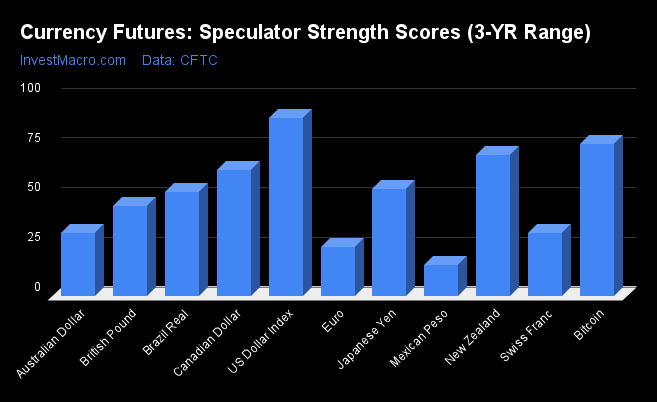
Strength Scores (a normalized measure of Speculator positions over a 3-Year range, from 0 to 100 where above 80 is extreme bullish and below 20 is extreme bearish) showed that the US Dollar Index (89.4 percent) leads the currency markets scores currently and is in a bullish extreme position (above 80 percent). Bitcoin (76.1 percent) comes in as the next highest in the currency markets in strength scores followed by the New Zealand Dollar (70.8 percent) and then the Canadian Dollar (63.2 percent). On the downside, the Mexican Peso (15.6 percent) continues to be the only currency in an extreme bearish level (below 20 percent). The next lowest strength scores are the EuroFX (24.4 percent), Australian Dollar (31.4 percent) and the Swiss Franc (31.7 percent).
Strength Statistics:
US Dollar Index (89.4 percent) vs US Dollar Index previous week (90.6 percent)
EuroFX (24.4 percent) vs EuroFX previous week (23.1 percent)
British Pound Sterling (45.1 percent) vs British Pound Sterling previous week (28.0 percent)
Japanese Yen (53.5 percent) vs Japanese Yen previous week (42.5 percent)
Swiss Franc (31.7 percent) vs Swiss Franc previous week (22.8 percent)
Canadian Dollar (63.2 percent) vs Canadian Dollar previous week (62.1 percent)
Australian Dollar (31.4 percent) vs Australian Dollar previous week (33.0 percent)
New Zealand Dollar (70.8 percent) vs New Zealand Dollar previous week (68.6 percent)
Mexican Peso (15.6 percent) vs Mexican Peso previous week (17.5 percent)
Brazil Real (52.1 percent) vs Brazil Real previous week (49.3 percent)
Bitcoin (76.1 percent) vs Bitcoin previous week (69.7 percent)
Strength Trends
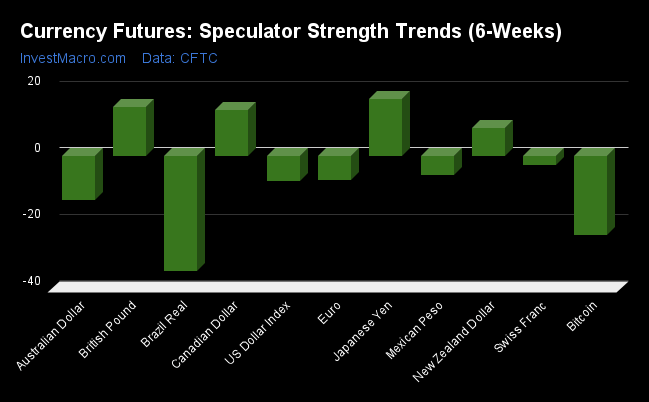
Strength Score Trends (or move index, calculates the 6-week changes in strength scores) showed that the Japanese Yen (17.0 percent) and the British Pound Sterling (14.5 percent) lead the past six weeks trends for the currency markets this week. The Canadian Dollar (13.6 percent) and the New Zealand Dollar (8.4 percent) fill out the only other positive movers in the latest trends data. The Brazil Real (-34.7 percent) leads the downside trend scores currently while the next market with lower trend scores were Bitcoin (-23.9 percent) followed by the Australian Dollar (-13.5 percent).
Strength Trend Statistics:
US Dollar Index (-7.7 percent) vs US Dollar Index previous week (-9.4 percent)
EuroFX (-7.3 percent) vs EuroFX previous week (-7.1 percent)
British Pound Sterling (14.5 percent) vs British Pound Sterling previous week (5.3 percent)
Japanese Yen (17.0 percent) vs Japanese Yen previous week (9.7 percent)
Swiss Franc (-3.0 percent) vs Swiss Franc previous week (-15.6 percent)
Canadian Dollar (13.6 percent) vs Canadian Dollar previous week (18.2 percent)
Australian Dollar (-13.5 percent) vs Australian Dollar previous week (-14.2 percent)
New Zealand Dollar (8.4 percent) vs New Zealand Dollar previous week (6.5 percent)
Mexican Peso (-5.8 percent) vs Mexican Peso previous week (1.6 percent)
Brazil Real (-34.7 percent) vs Brazil Real previous week (-44.7 percent)
Bitcoin (-23.9 percent) vs Bitcoin previous week (-29.6 percent)
Individual Markets:
US Dollar Index Futures:
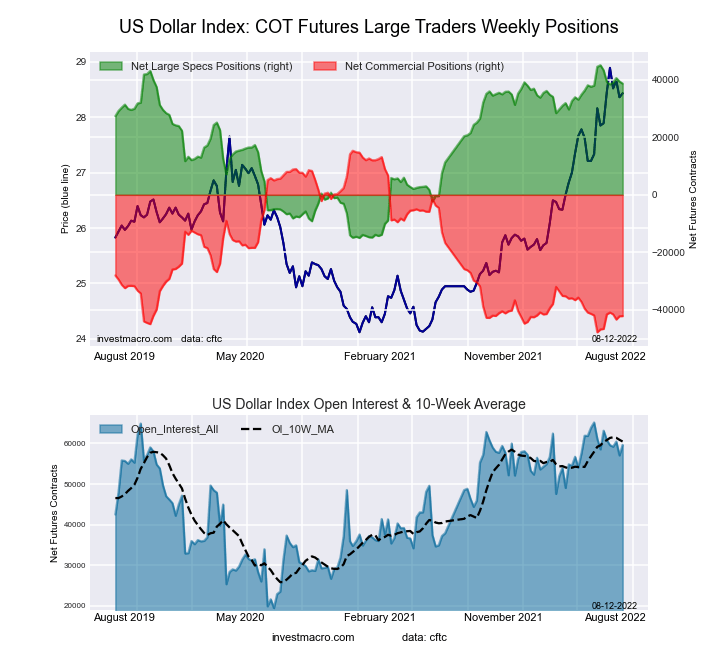 The US Dollar Index large speculator standing this week resulted in a net position of 38,637 contracts in the data reported through Tuesday. This was a weekly decline of -710 contracts from the previous week which had a total of 39,347 net contracts.
This week’s current strength score (the trader positioning range over the past three years, measured from 0 to 100) shows the speculators are currently Bullish-Extreme with a score of 89.4 percent. The commercials are Bearish-Extreme with a score of 8.9 percent and the small traders (not shown in chart) are Bullish with a score of 54.4 percent.
| US DOLLAR INDEX Statistics | SPECULATORS | COMMERCIALS | SMALL TRADERS |
| – Percent of Open Interest Longs: | 85.1 | 3.5 | 9.2 |
| – Percent of Open Interest Shorts: | 20.3 | 74.1 | 3.4 |
| – Net Position: | 38,637 | -42,099 | 3,462 |
| – Gross Longs: | 50,738 | 2,079 | 5,481 |
| – Gross Shorts: | 12,101 | 44,178 | 2,019 |
| – Long to Short Ratio: | 4.2 to 1 | 0.0 to 1 | 2.7 to 1 |
| NET POSITION TREND: | | | |
| – Strength Index Score (3 Year Range Pct): | 89.4 | 8.9 | 54.4 |
| – Strength Index Reading (3 Year Range): | Bullish-Extreme | Bearish-Extreme | Bullish |
| NET POSITION MOVEMENT INDEX: | | | |
| – 6-Week Change in Strength Index: | -7.7 | 7.1 | 1.5 |
Euro Currency Futures:
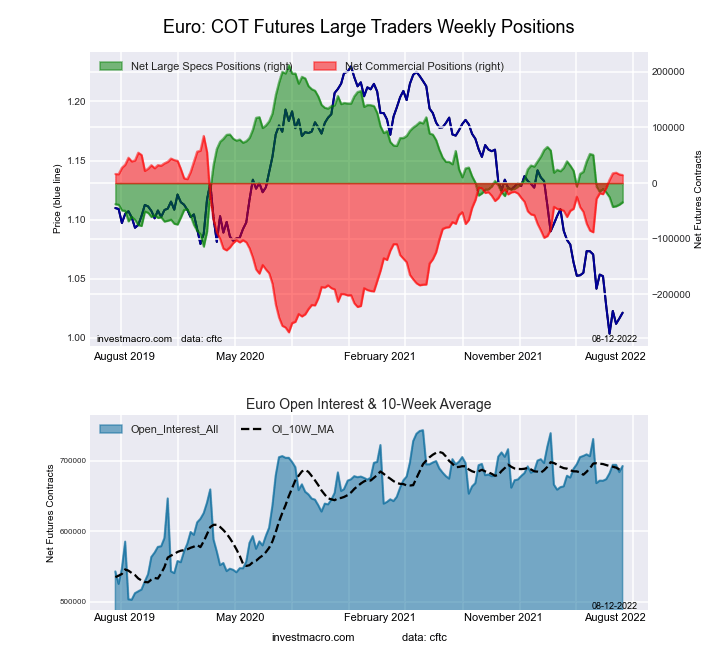 The Euro Currency large speculator standing this week resulted in a net position of -34,536 contracts in the data reported through Tuesday. This was a weekly increase of 4,275 contracts from the previous week which had a total of -38,811 net contracts.
This week’s current strength score (the trader positioning range over the past three years, measured from 0 to 100) shows the speculators are currently Bearish with a score of 24.4 percent. The commercials are Bullish-Extreme with a score of 80.1 percent and the small traders (not shown in chart) are Bearish-Extreme with a score of 7.8 percent.
| EURO Currency Statistics | SPECULATORS | COMMERCIALS | SMALL TRADERS |
| – Percent of Open Interest Longs: | 28.9 | 57.0 | 11.4 |
| – Percent of Open Interest Shorts: | 33.9 | 54.9 | 8.5 |
| – Net Position: | -34,536 | 14,402 | 20,134 |
| – Gross Longs: | 200,088 | 394,543 | 78,944 |
| – Gross Shorts: | 234,624 | 380,141 | 58,810 |
| – Long to Short Ratio: | 0.9 to 1 | 1.0 to 1 | 1.3 to 1 |
| NET POSITION TREND: | | | |
| – Strength Index Score (3 Year Range Pct): | 24.4 | 80.1 | 7.8 |
| – Strength Index Reading (3 Year Range): | Bearish | Bullish-Extreme | Bearish-Extreme |
| NET POSITION MOVEMENT INDEX: | | | |
| – 6-Week Change in Strength Index: | -7.3 | 9.7 | -17.0 |
British Pound Sterling Futures:
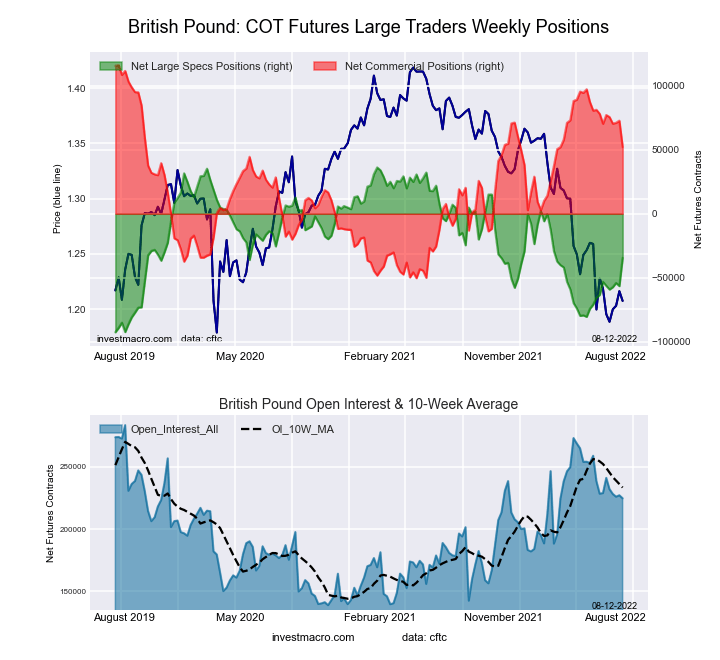 The British Pound Sterling large speculator standing this week resulted in a net position of -34,468 contracts in the data reported through Tuesday. This was a weekly gain of 21,941 contracts from the previous week which had a total of -56,409 net contracts.
This week’s current strength score (the trader positioning range over the past three years, measured from 0 to 100) shows the speculators are currently Bearish with a score of 45.1 percent. The commercials are Bullish with a score of 61.6 percent and the small traders (not shown in chart) are Bearish-Extreme with a score of 19.2 percent.
| BRITISH POUND Statistics | SPECULATORS | COMMERCIALS | SMALL TRADERS |
| – Percent of Open Interest Longs: | 18.8 | 69.6 | 8.6 |
| – Percent of Open Interest Shorts: | 34.1 | 46.4 | 16.4 |
| – Net Position: | -34,468 | 52,050 | -17,582 |
| – Gross Longs: | 42,219 | 156,282 | 19,243 |
| – Gross Shorts: | 76,687 | 104,232 | 36,825 |
| – Long to Short Ratio: | 0.6 to 1 | 1.5 to 1 | 0.5 to 1 |
| NET POSITION TREND: | | | |
| – Strength Index Score (3 Year Range Pct): | 45.1 | 61.6 | 19.2 |
| – Strength Index Reading (3 Year Range): | Bearish | Bullish | Bearish-Extreme |
| NET POSITION MOVEMENT INDEX: | | | |
| – 6-Week Change in Strength Index: | 14.5 | -10.9 | -1.0 |
Japanese Yen Futures:
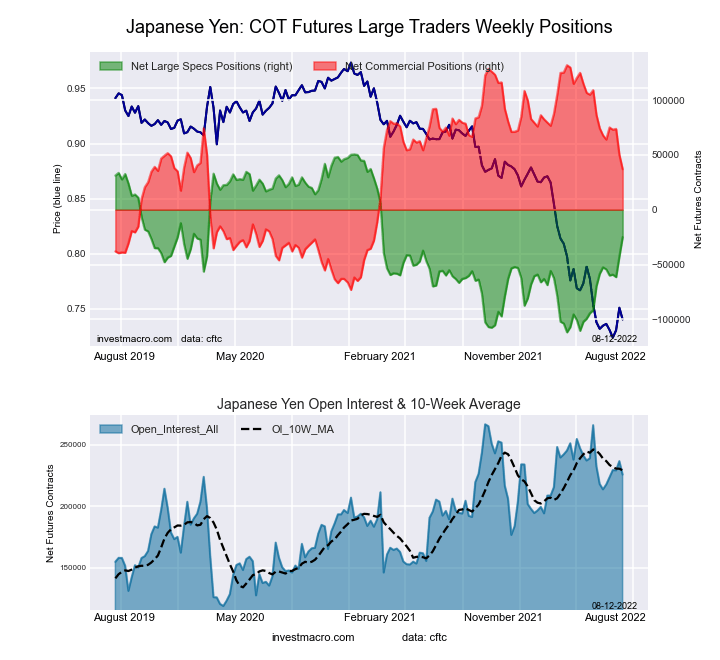 The Japanese Yen large speculator standing this week resulted in a net position of -25,032 contracts in the data reported through Tuesday. This was a weekly advance of 17,721 contracts from the previous week which had a total of -42,753 net contracts.
This week’s current strength score (the trader positioning range over the past three years, measured from 0 to 100) shows the speculators are currently Bullish with a score of 53.5 percent. The commercials are Bullish with a score of 53.7 percent and the small traders (not shown in chart) are Bearish with a score of 29.1 percent.
| JAPANESE YEN Statistics | SPECULATORS | COMMERCIALS | SMALL TRADERS |
| – Percent of Open Interest Longs: | 23.2 | 65.8 | 9.3 |
| – Percent of Open Interest Shorts: | 34.3 | 49.4 | 14.6 |
| – Net Position: | -25,032 | 36,994 | -11,962 |
| – Gross Longs: | 52,333 | 148,628 | 20,978 |
| – Gross Shorts: | 77,365 | 111,634 | 32,940 |
| – Long to Short Ratio: | 0.7 to 1 | 1.3 to 1 | 0.6 to 1 |
| NET POSITION TREND: | | | |
| – Strength Index Score (3 Year Range Pct): | 53.5 | 53.7 | 29.1 |
| – Strength Index Reading (3 Year Range): | Bullish | Bullish | Bearish |
| NET POSITION MOVEMENT INDEX: | | | |
| – 6-Week Change in Strength Index: | 17.0 | -15.1 | 6.8 |
Swiss Franc Futures:
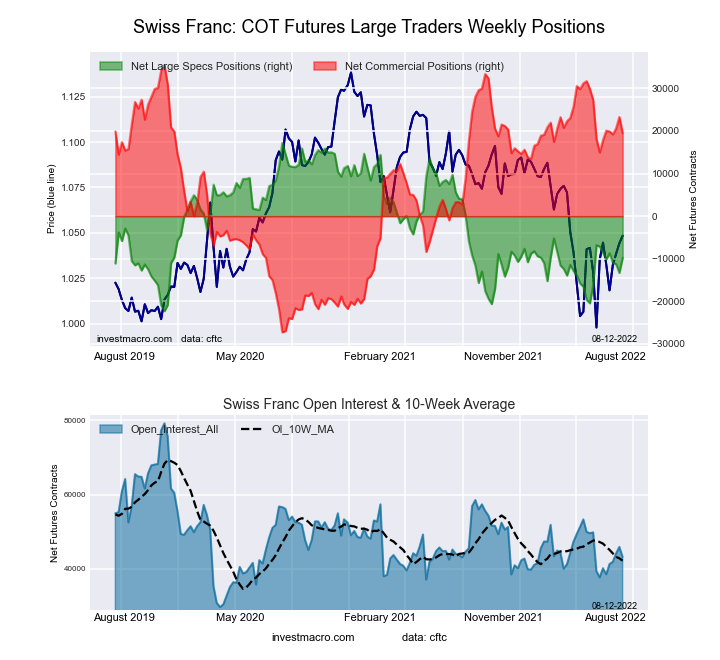 The Swiss Franc large speculator standing this week resulted in a net position of -9,782 contracts in the data reported through Tuesday. This was a weekly gain of 3,526 contracts from the previous week which had a total of -13,308 net contracts.
This week’s current strength score (the trader positioning range over the past three years, measured from 0 to 100) shows the speculators are currently Bearish with a score of 31.7 percent. The commercials are Bullish with a score of 74.5 percent and the small traders (not shown in chart) are Bearish with a score of 24.7 percent.
| SWISS FRANC Statistics | SPECULATORS | COMMERCIALS | SMALL TRADERS |
| – Percent of Open Interest Longs: | 20.0 | 58.1 | 21.8 |
| – Percent of Open Interest Shorts: | 42.6 | 13.0 | 44.2 |
| – Net Position: | -9,782 | 19,464 | -9,682 |
| – Gross Longs: | 8,635 | 25,084 | 9,414 |
| – Gross Shorts: | 18,417 | 5,620 | 19,096 |
| – Long to Short Ratio: | 0.5 to 1 | 4.5 to 1 | 0.5 to 1 |
| NET POSITION TREND: | | | |
| – Strength Index Score (3 Year Range Pct): | 31.7 | 74.5 | 24.7 |
| – Strength Index Reading (3 Year Range): | Bearish | Bullish | Bearish |
| NET POSITION MOVEMENT INDEX: | | | |
| – 6-Week Change in Strength Index: | -3.0 | 2.6 | -1.4 |
Canadian Dollar Futures:
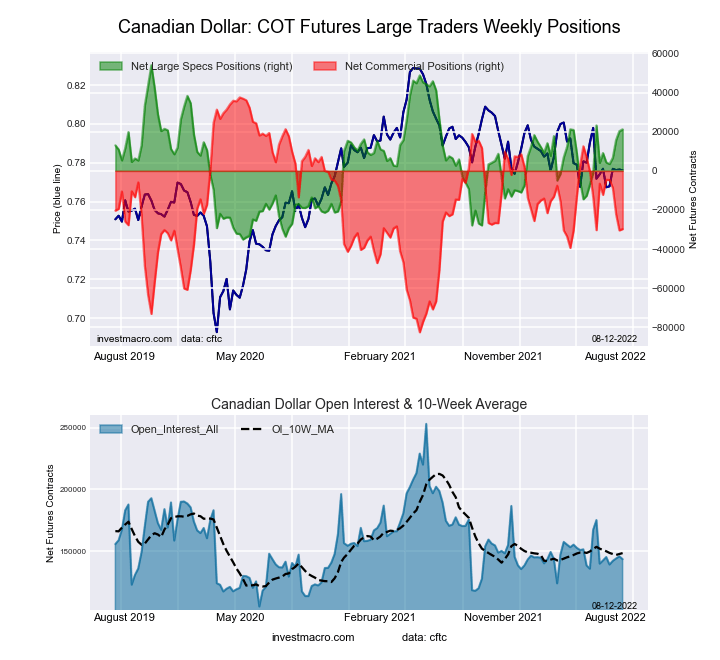 The Canadian Dollar large speculator standing this week resulted in a net position of 21,223 contracts in the data reported through Tuesday. This was a weekly increase of 946 contracts from the previous week which had a total of 20,277 net contracts.
This week’s current strength score (the trader positioning range over the past three years, measured from 0 to 100) shows the speculators are currently Bullish with a score of 63.2 percent. The commercials are Bearish with a score of 43.9 percent and the small traders (not shown in chart) are Bearish with a score of 47.2 percent.
| CANADIAN DOLLAR Statistics | SPECULATORS | COMMERCIALS | SMALL TRADERS |
| – Percent of Open Interest Longs: | 32.6 | 41.6 | 23.5 |
| – Percent of Open Interest Shorts: | 17.9 | 62.3 | 17.6 |
| – Net Position: | 21,223 | -29,743 | 8,520 |
| – Gross Longs: | 46,898 | 59,798 | 33,808 |
| – Gross Shorts: | 25,675 | 89,541 | 25,288 |
| – Long to Short Ratio: | 1.8 to 1 | 0.7 to 1 | 1.3 to 1 |
| NET POSITION TREND: | | | |
| – Strength Index Score (3 Year Range Pct): | 63.2 | 43.9 | 47.2 |
| – Strength Index Reading (3 Year Range): | Bullish | Bearish | Bearish |
| NET POSITION MOVEMENT INDEX: | | | |
| – 6-Week Change in Strength Index: | 13.6 | -14.6 | 10.8 |
Australian Dollar Futures:
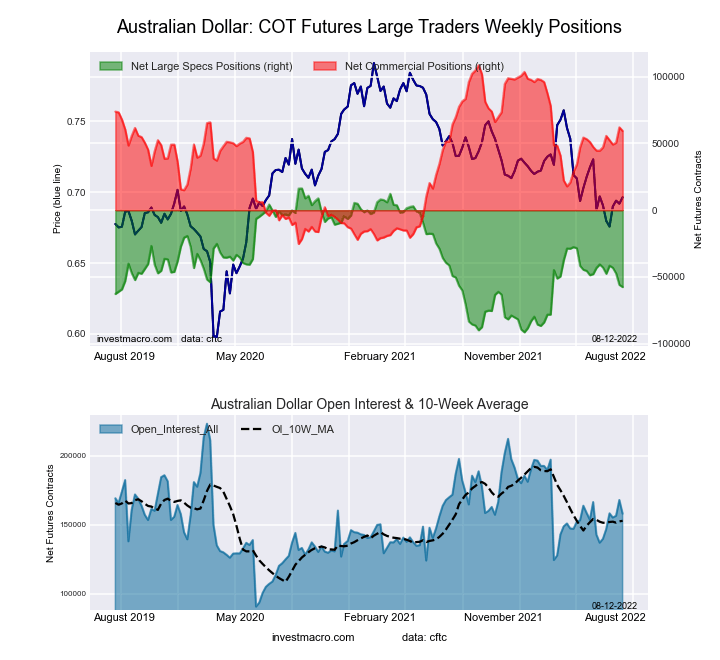 The Australian Dollar large speculator standing this week resulted in a net position of -57,588 contracts in the data reported through Tuesday. This was a weekly decline of -1,638 contracts from the previous week which had a total of -55,950 net contracts.
This week’s current strength score (the trader positioning range over the past three years, measured from 0 to 100) shows the speculators are currently Bearish with a score of 31.4 percent. The commercials are Bullish with a score of 63.2 percent and the small traders (not shown in chart) are Bearish with a score of 47.9 percent.
| AUSTRALIAN DOLLAR Statistics | SPECULATORS | COMMERCIALS | SMALL TRADERS |
| – Percent of Open Interest Longs: | 16.2 | 69.3 | 12.3 |
| – Percent of Open Interest Shorts: | 52.6 | 31.7 | 13.4 |
| – Net Position: | -57,588 | 59,441 | -1,853 |
| – Gross Longs: | 25,644 | 109,593 | 19,378 |
| – Gross Shorts: | 83,232 | 50,152 | 21,231 |
| – Long to Short Ratio: | 0.3 to 1 | 2.2 to 1 | 0.9 to 1 |
| NET POSITION TREND: | | | |
| – Strength Index Score (3 Year Range Pct): | 31.4 | 63.2 | 47.9 |
| – Strength Index Reading (3 Year Range): | Bearish | Bullish | Bearish |
| NET POSITION MOVEMENT INDEX: | | | |
| – 6-Week Change in Strength Index: | -13.5 | 9.2 | 5.7 |
New Zealand Dollar Futures:
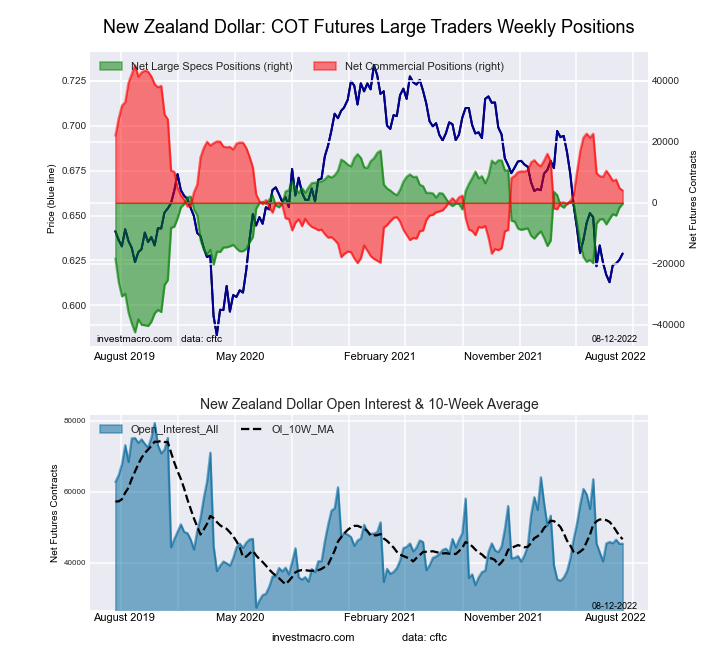 The New Zealand Dollar large speculator standing this week resulted in a net position of -276 contracts in the data reported through Tuesday. This was a weekly advance of 1,297 contracts from the previous week which had a total of -1,573 net contracts.
This week’s current strength score (the trader positioning range over the past three years, measured from 0 to 100) shows the speculators are currently Bullish with a score of 70.8 percent. The commercials are Bearish with a score of 36.6 percent and the small traders (not shown in chart) are Bearish-Extreme with a score of 8.3 percent.
| NEW ZEALAND DOLLAR Statistics | SPECULATORS | COMMERCIALS | SMALL TRADERS |
| – Percent of Open Interest Longs: | 40.2 | 54.5 | 4.9 |
| – Percent of Open Interest Shorts: | 40.8 | 45.5 | 13.2 |
| – Net Position: | -276 | 4,044 | -3,768 |
| – Gross Longs: | 18,224 | 24,700 | 2,239 |
| – Gross Shorts: | 18,500 | 20,656 | 6,007 |
| – Long to Short Ratio: | 1.0 to 1 | 1.2 to 1 | 0.4 to 1 |
| NET POSITION TREND: | | | |
| – Strength Index Score (3 Year Range Pct): | 70.8 | 36.6 | 8.3 |
| – Strength Index Reading (3 Year Range): | Bullish | Bearish | Bearish-Extreme |
| NET POSITION MOVEMENT INDEX: | | | |
| – 6-Week Change in Strength Index: | 8.4 | -6.9 | -6.1 |
Mexican Peso Futures:
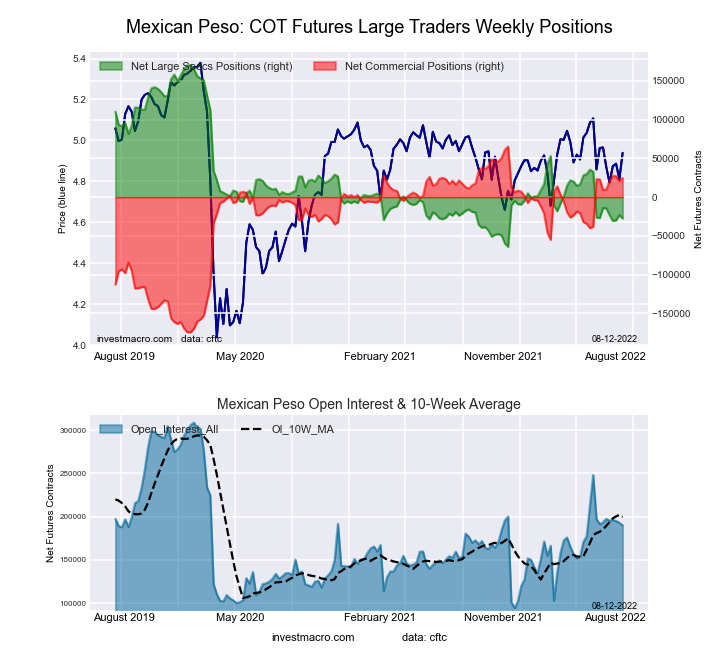 The Mexican Peso large speculator standing this week resulted in a net position of -27,621 contracts in the data reported through Tuesday. This was a weekly decline of -4,568 contracts from the previous week which had a total of -23,053 net contracts.
This week’s current strength score (the trader positioning range over the past three years, measured from 0 to 100) shows the speculators are currently Bearish-Extreme with a score of 15.6 percent. The commercials are Bullish-Extreme with a score of 83.1 percent and the small traders (not shown in chart) are Bullish with a score of 55.3 percent.
| MEXICAN PESO Statistics | SPECULATORS | COMMERCIALS | SMALL TRADERS |
| – Percent of Open Interest Longs: | 50.3 | 46.3 | 3.2 |
| – Percent of Open Interest Shorts: | 64.8 | 33.3 | 1.6 |
| – Net Position: | -27,621 | 24,722 | 2,899 |
| – Gross Longs: | 95,572 | 88,036 | 5,991 |
| – Gross Shorts: | 123,193 | 63,314 | 3,092 |
| – Long to Short Ratio: | 0.8 to 1 | 1.4 to 1 | 1.9 to 1 |
| NET POSITION TREND: | | | |
| – Strength Index Score (3 Year Range Pct): | 15.6 | 83.1 | 55.3 |
| – Strength Index Reading (3 Year Range): | Bearish-Extreme | Bullish-Extreme | Bullish |
| NET POSITION MOVEMENT INDEX: | | | |
| – 6-Week Change in Strength Index: | -5.8 | 6.5 | -8.4 |
Brazilian Real Futures:
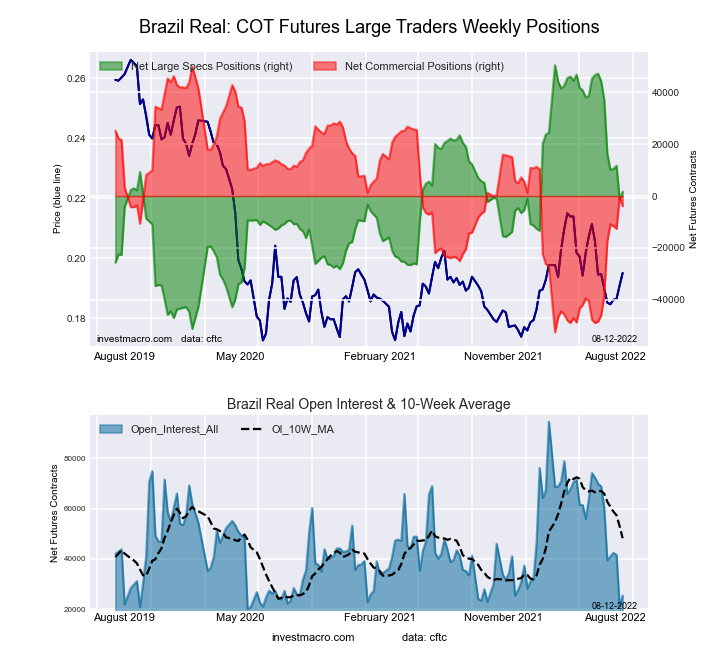 The Brazilian Real large speculator standing this week resulted in a net position of 1,733 contracts in the data reported through Tuesday. This was a weekly rise of 2,863 contracts from the previous week which had a total of -1,130 net contracts.
This week’s current strength score (the trader positioning range over the past three years, measured from 0 to 100) shows the speculators are currently Bullish with a score of 52.1 percent. The commercials are Bearish with a score of 47.5 percent and the small traders (not shown in chart) are Bullish-Extreme with a score of 90.0 percent.
| BRAZIL REAL Statistics | SPECULATORS | COMMERCIALS | SMALL TRADERS |
| – Percent of Open Interest Longs: | 53.5 | 33.1 | 13.4 |
| – Percent of Open Interest Shorts: | 46.7 | 48.4 | 4.9 |
| – Net Position: | 1,733 | -3,884 | 2,151 |
| – Gross Longs: | 13,635 | 8,440 | 3,405 |
| – Gross Shorts: | 11,902 | 12,324 | 1,254 |
| – Long to Short Ratio: | 1.1 to 1 | 0.7 to 1 | 2.7 to 1 |
| NET POSITION TREND: | | | |
| – Strength Index Score (3 Year Range Pct): | 52.1 | 47.5 | 90.0 |
| – Strength Index Reading (3 Year Range): | Bullish | Bearish | Bullish-Extreme |
| NET POSITION MOVEMENT INDEX: | | | |
| – 6-Week Change in Strength Index: | -34.7 | 33.8 | 7.6 |
Bitcoin Futures:
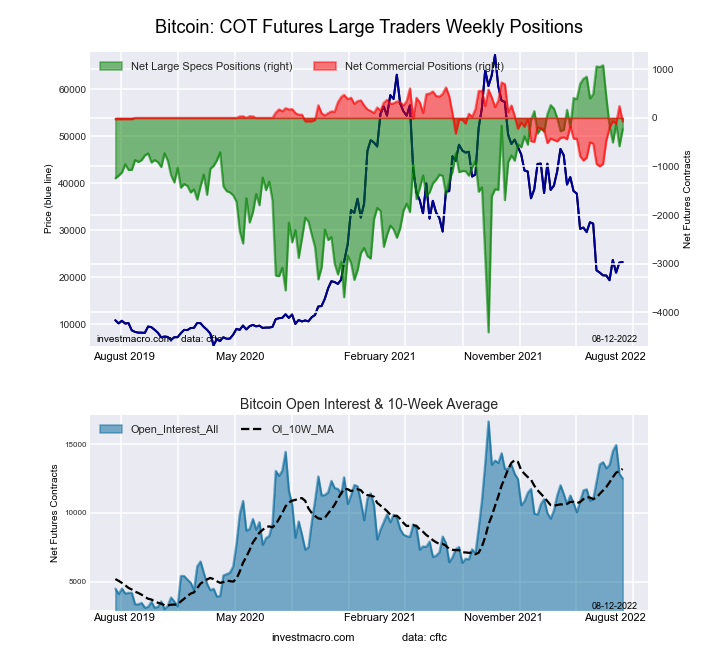 The Bitcoin large speculator standing this week resulted in a net position of -230 contracts in the data reported through Tuesday. This was a weekly lift of 351 contracts from the previous week which had a total of -581 net contracts.
This week’s current strength score (the trader positioning range over the past three years, measured from 0 to 100) shows the speculators are currently Bullish with a score of 76.1 percent. The commercials are Bullish with a score of 53.6 percent and the small traders (not shown in chart) are Bearish-Extreme with a score of 19.8 percent.
| BITCOIN Statistics | SPECULATORS | COMMERCIALS | SMALL TRADERS |
| – Percent of Open Interest Longs: | 74.3 | 3.5 | 8.3 |
| – Percent of Open Interest Shorts: | 76.1 | 4.1 | 5.9 |
| – Net Position: | -230 | -71 | 301 |
| – Gross Longs: | 9,294 | 439 | 1,034 |
| – Gross Shorts: | 9,524 | 510 | 733 |
| – Long to Short Ratio: | 1.0 to 1 | 0.9 to 1 | 1.4 to 1 |
| NET POSITION TREND: | | | |
| – Strength Index Score (3 Year Range Pct): | 76.1 | 53.6 | 19.8 |
| – Strength Index Reading (3 Year Range): | Bullish | Bullish | Bearish-Extreme |
| NET POSITION MOVEMENT INDEX: | | | |
| – 6-Week Change in Strength Index: | -23.9 | 50.8 | 10.0 |
Article By InvestMacro – Receive our weekly COT Reports by Email
*COT Report: The COT data, released weekly to the public each Friday, is updated through the most recent Tuesday (data is 3 days old) and shows a quick view of how large speculators or non-commercials (for-profit traders) were positioned in the futures markets.
The CFTC categorizes trader positions according to commercial hedgers (traders who use futures contracts for hedging as part of the business), non-commercials (large traders who speculate to realize trading profits) and nonreportable traders (usually small traders/speculators) as well as their open interest (contracts open in the market at time of reporting).See CFTC criteria here.


 Undergraduate students at the University of Nebraska Omaha collaborate on a group assignment for a STEM course.


.jpg#/media/File:A_Wafer_of_the_Latest_D-Wave_Quantum_Computers_(39188583425).jpg)
.svg#/media/File:Cmos-chip_structure_in_2000s_(en).svg)